Bitcoin Teeters at $105K as US-China Trade Talks Loom—Will Bulls Hold the Line?

Bitcoin's rally faces a critical test as geopolitical tensions take center stage. The $105,000 level—once a springboard for ATH chasers—now risks becoming a trapdoor if macro winds shift.
Trade talks resurface, markets flinch. The crypto crowd watches Washington and Beijing like hawks, knowing full well that 'constructive dialogue' often translates to 'volatility incoming.' Meanwhile, Wall Street's algo-traders sharpen their knives—because nothing spices up a slow June like watching retail investors relearn the meaning of 'asymmetric risk.'
Can BTC dodge the fallout? Grab your popcorn—this is where rubber meets the road.
Markets remain cautious ahead of trade talks
The immediate event determining sentiment in global markets and Bitcoin prices is the second round of discussions between the US and China. In the previous discussion on May 12, both sides decided to lower tariffs for 90 days, resulting in a recovery in the S&P 500 and the cryptocurrency market.
The following key stage in de-escalating the trade war was the first phone call between Donald TRUMP and Xi Jinping since the US President’s inauguration. President Trump stated the one-hour-long call led to “a very positive conclusion,” with China restarting the rare earth minerals consignments to the US.
Still, the second round of meetings occurs after both parties have accused each other of violating the Geneva agreement.
The US blames a delay in the approval of additional critical minerals exports, while China is displeased with new restrictions on Chinese student visas and rising export restrictions on semiconductors.
As the current agreement between the US and China becomes fragile, market sentiments sour, projecting a possibility of investors cashing out to avoid volatility spikes.
Beyond trade talks, the upcoming US CPI data on Wednesday and the inflation expectations data on Friday are expected to have a significant impact on the market as they could reflect the first impact of Trump's tariffs.
Global corporations continue to buy Bitcoin, shrugging off short-term tensions
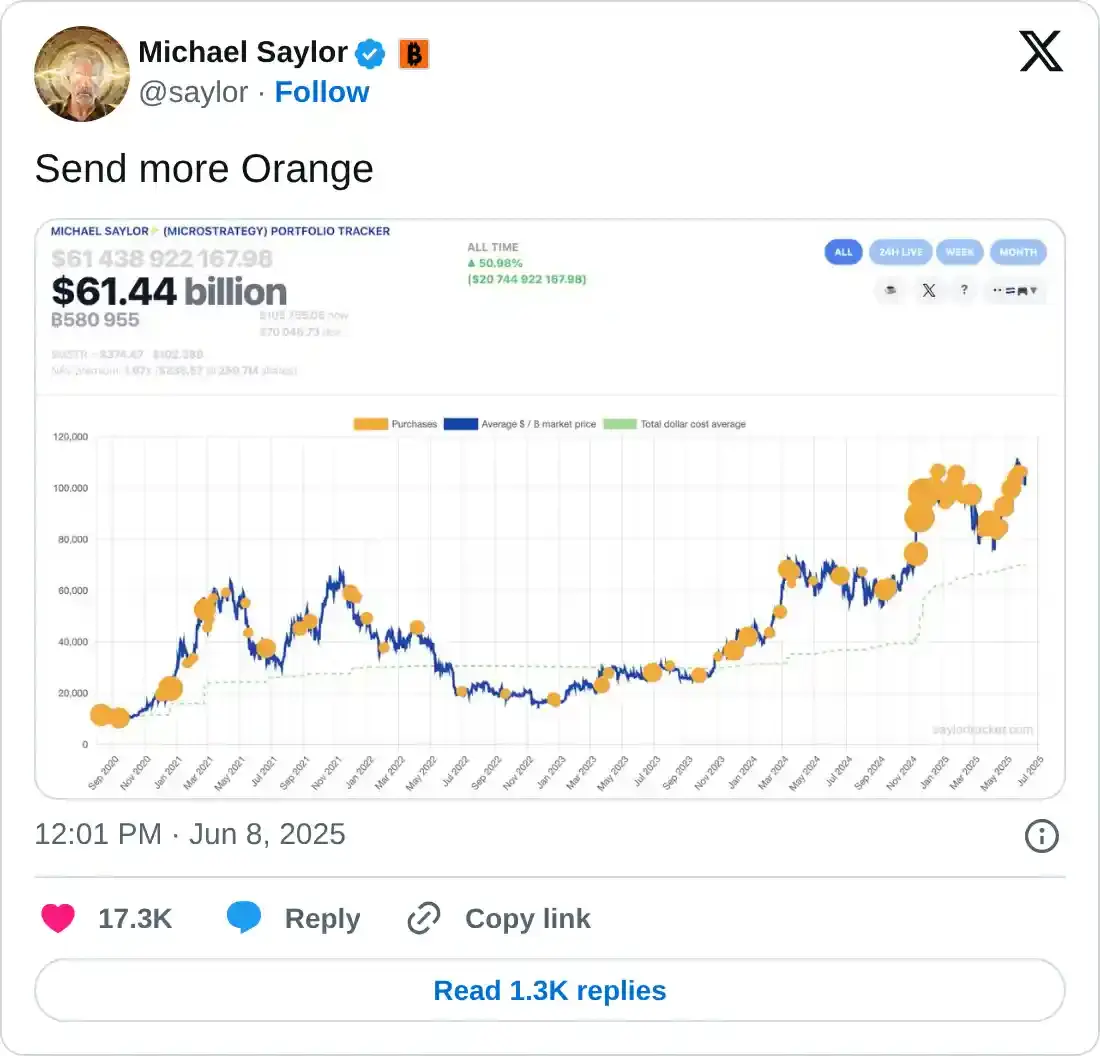
In an X post on Sunday, Michael Saylor, the Chairman of Strategy, shared the iconic MicroStrategy Portfolio Tracker chart with the caption, “Send more Orange.”
The Chairman hints at a new purchase from Strategy, as such posts of portfolio charts often follow announcements of BTC holdings growth.
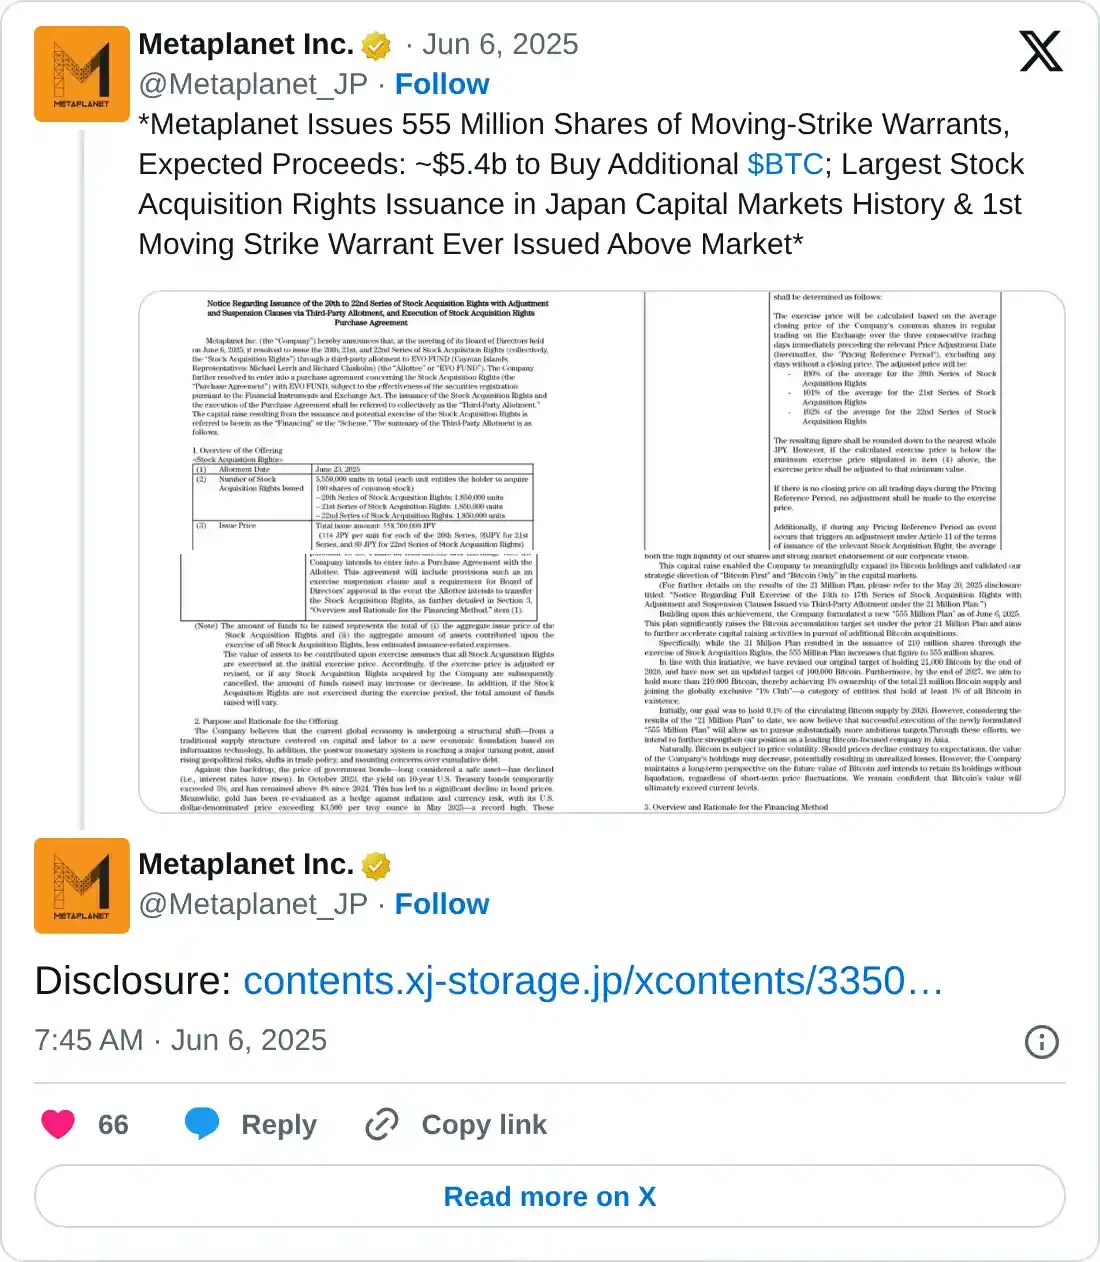
MetaPlanet, a Japanese investment firm, has announced the issuance of 555 million shares on Friday, expected to raise nearly 771 billion yen (~$5.4 billion) through the stock acquisition rights to acquire additional bitcoins. Metaplanet also announced on Friday its new target to acquire 210,000 BTC by 2027.
With the announcement to acquire more Bitcoins in the coming years and the issuance of Moving-Strike Warrants, MetaPlanet shares were up by over 15% on Monday.
In European markets, The Blockchain Group signaled a similar strategy to that of Michael Saylor and MetaPlanet. The Blockchain Group has announced a € 300 million ATM-type capital increase program to become Europe's first bitcoin treasury company.
Bitcoin risks losing $105,000
On the daily chart, BTC holds above $105,000 with a Doji candle in making at press time, indicating short-term uncertainty. With its second consecutive Doji, Bitcoin struggles to push above last week's high at $106,794, in confluence with a short-term resistance trendline.
Investors must watch out for a potential buy signal coming from the Moving Average Convergence/Divergence (MACD) indicator. The signal is indicated by the blue line (MACD) crossing above the red line (signal).
The Relative Strength Index (RSI) at 54 resurfaces above the halfway level but maintains a sideways trend, suggesting low momentum.
A potential push below Saturday’s opening price at $104,288 could extend the correction to the 50-day Exponential Moving Average at $101,499.
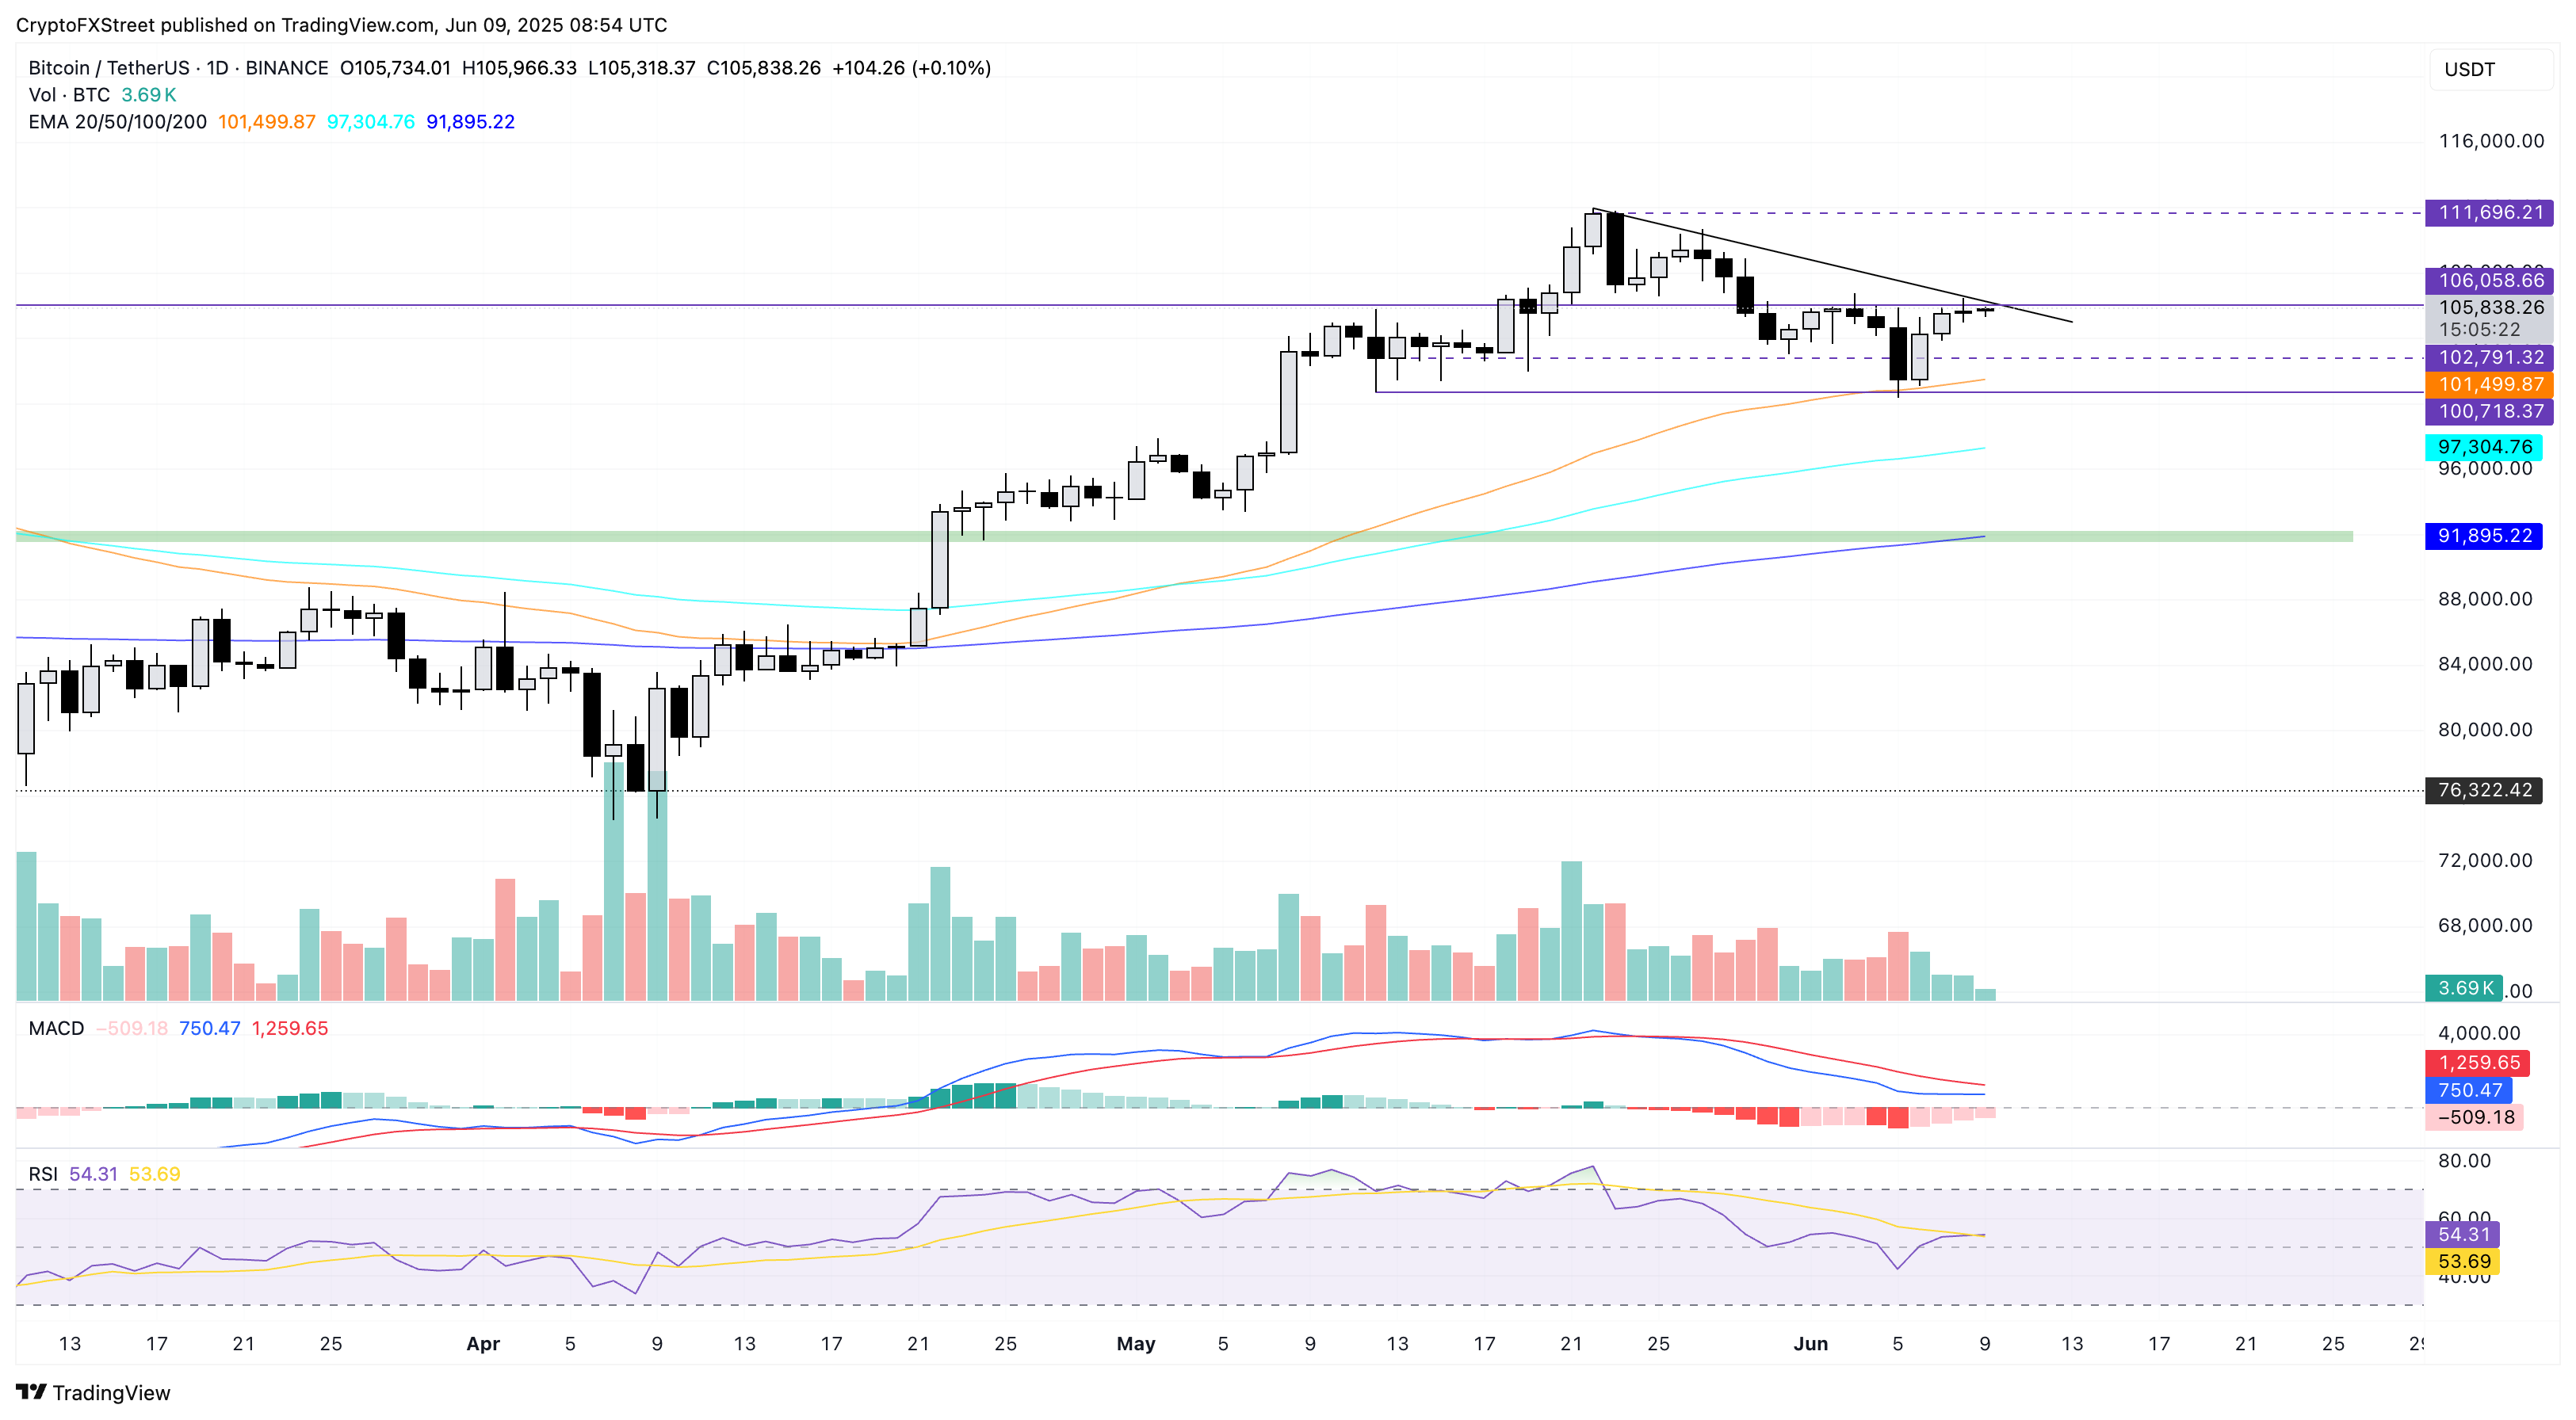
BTC/USDT daily price chart. Source: TradingView
On the other hand, sideline investors seeking bullish opportunities could wait for a surge above the weekly high at $106,794 to target the all-time high of $111,980.

Log in to Reply
Log in to comment your thoughtsComments
Related Articles
|Square
Get the BTCC app to start your crypto journey
Get started today Scan to join our 100M+ users