Sui Teeters on the Brink: $3.00 Support Hangs by a Thread as Bears Take Control

Sui's price action turns ugly—another day, another slide toward critical support. The $3.00 level now acts as a psychological battleground, with traders bracing for a potential breakdown.
Market sentiment? Brutally one-sided. Shorts pile in while bulls scramble for cover. No fancy narratives here—just cold, hard price gravity at work.
Funny how these 'next-gen' chains always promise moon shots but deliver margin calls first. Maybe Sui should've spent less on marketing and more on buy pressure.
Sui’s DeFi TVL recovers despite increasing sell-side pressure
Sui’s Decentralized Finance (DeFi) Total Value Locked (TVL) edged higher over the last 24 hours to $1.75 billion after dropping to $1.54 billion on May 23. The chart below shows that TVL is up 29% from the $1.24 billion recorded on April 1.
TVL refers to the total value of all coins held in smart contracts across all protocols on the network.
A persistent increase in TVL is a bullish signal as it suggests that investors are confident in the ecosystem. The subsequent decrease in the circulating supply reduces potential selling pressure, thus creating a suitable environment for a sustainable price increase.
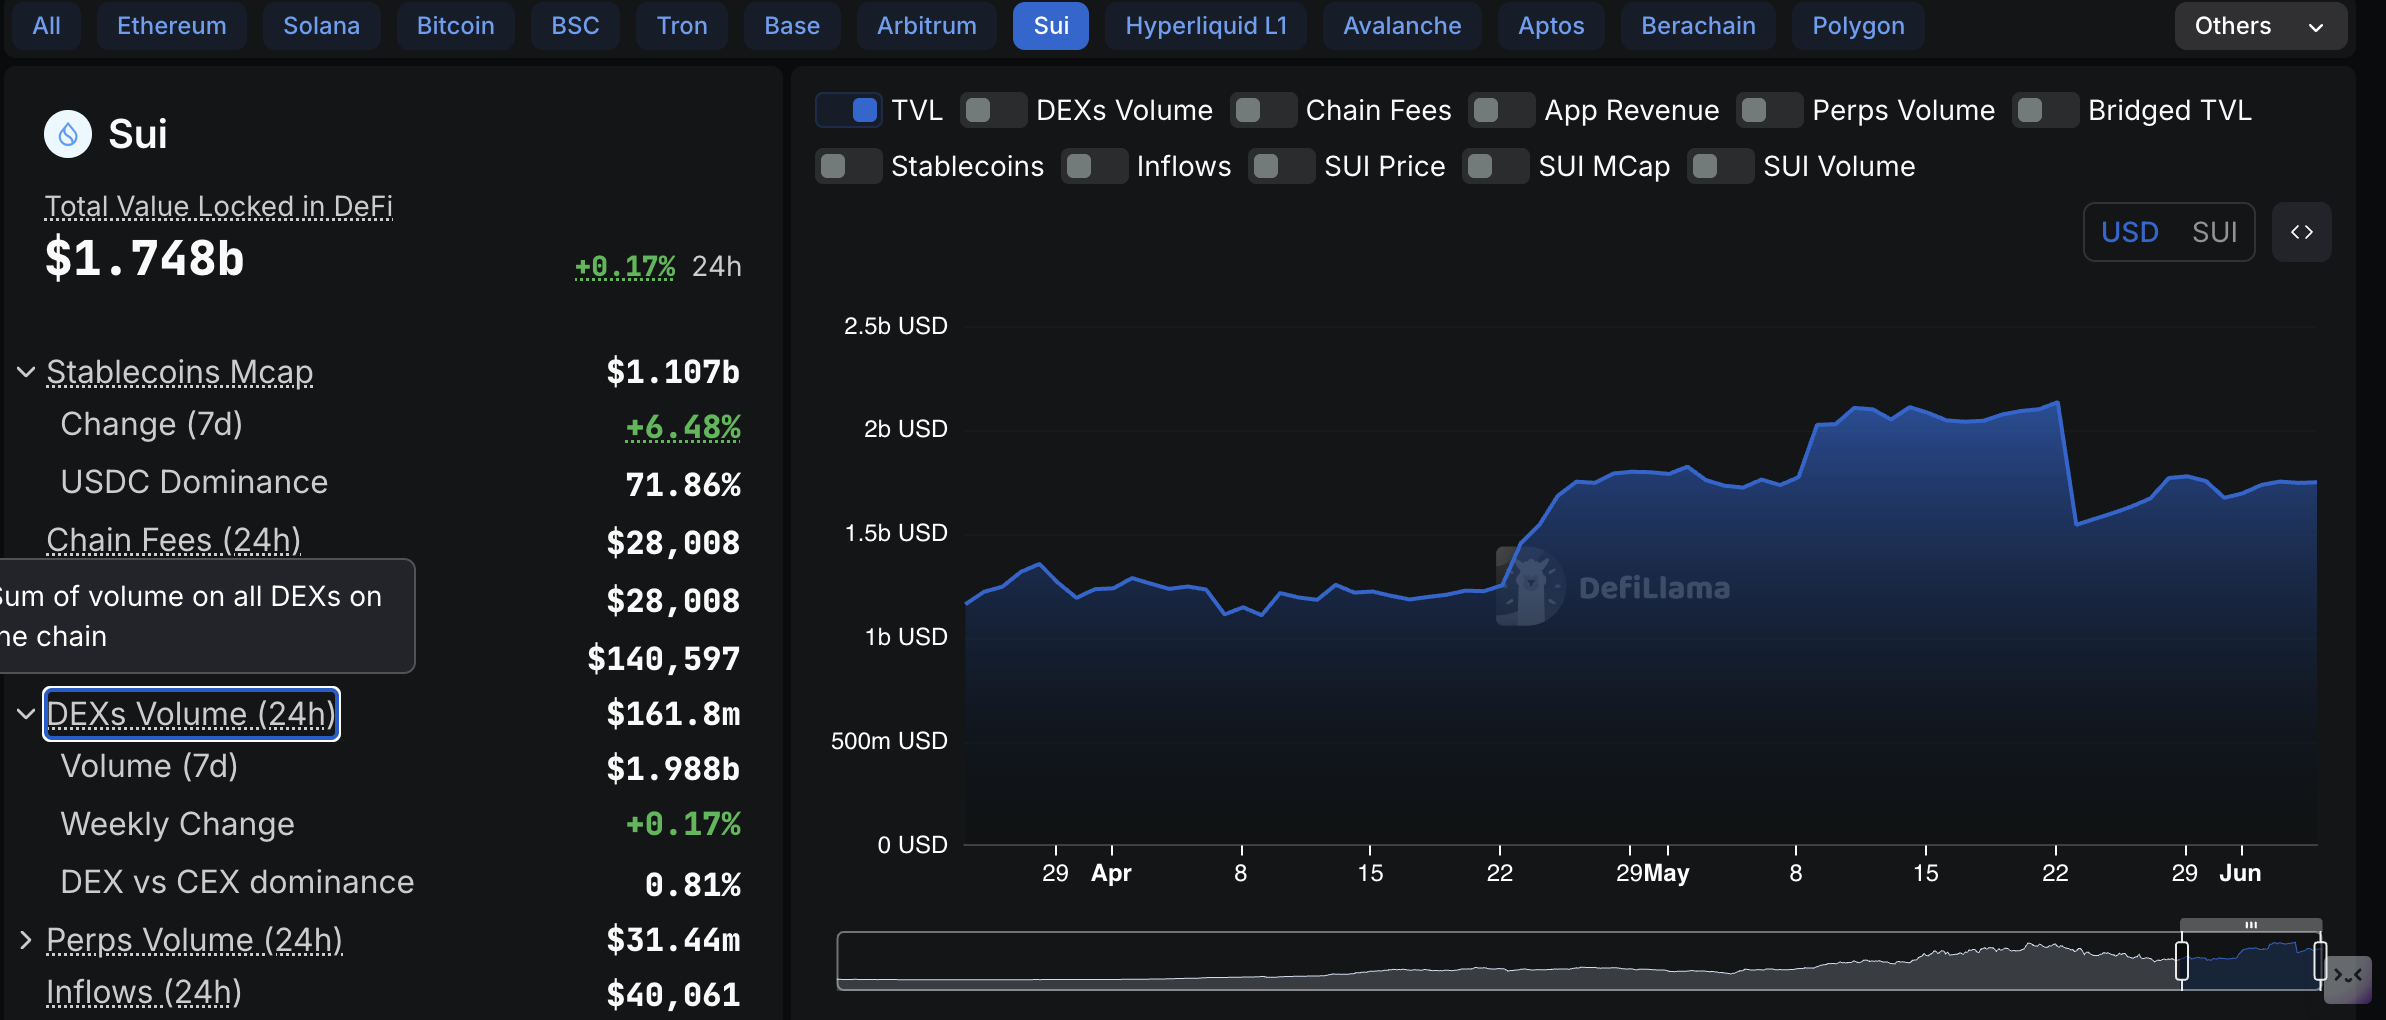
Sui DeFi TVL | Source: DefiLlama
Technical outlook: Can Sui defend $3.00 support to resume the uptrend?
Sui’s technical structure shows signs of potential recovery; however, the sell signal from the Moving Average Convergence Divergence (MACD) indicator could overshadow demand, resulting in extended declines below the immediate $3.00 support level.
Such a sell signal manifests when the blue MACD line crosses above the red signal line, making shorts attractive to traders. The red histogram bars, which expand below the mean line (0.00), reinforce the bearish grip.
The Relative Strength Index (RSI), although stabilizing at 40, has sustained a downtrend since the overbought conditions in early May. Should the RSI drop into the oversold territory below 30, the path of least resistance will stay downwards. However, traders could look out for a swing above the 50 midline to ascertain a trend reversal in Sui’s price.
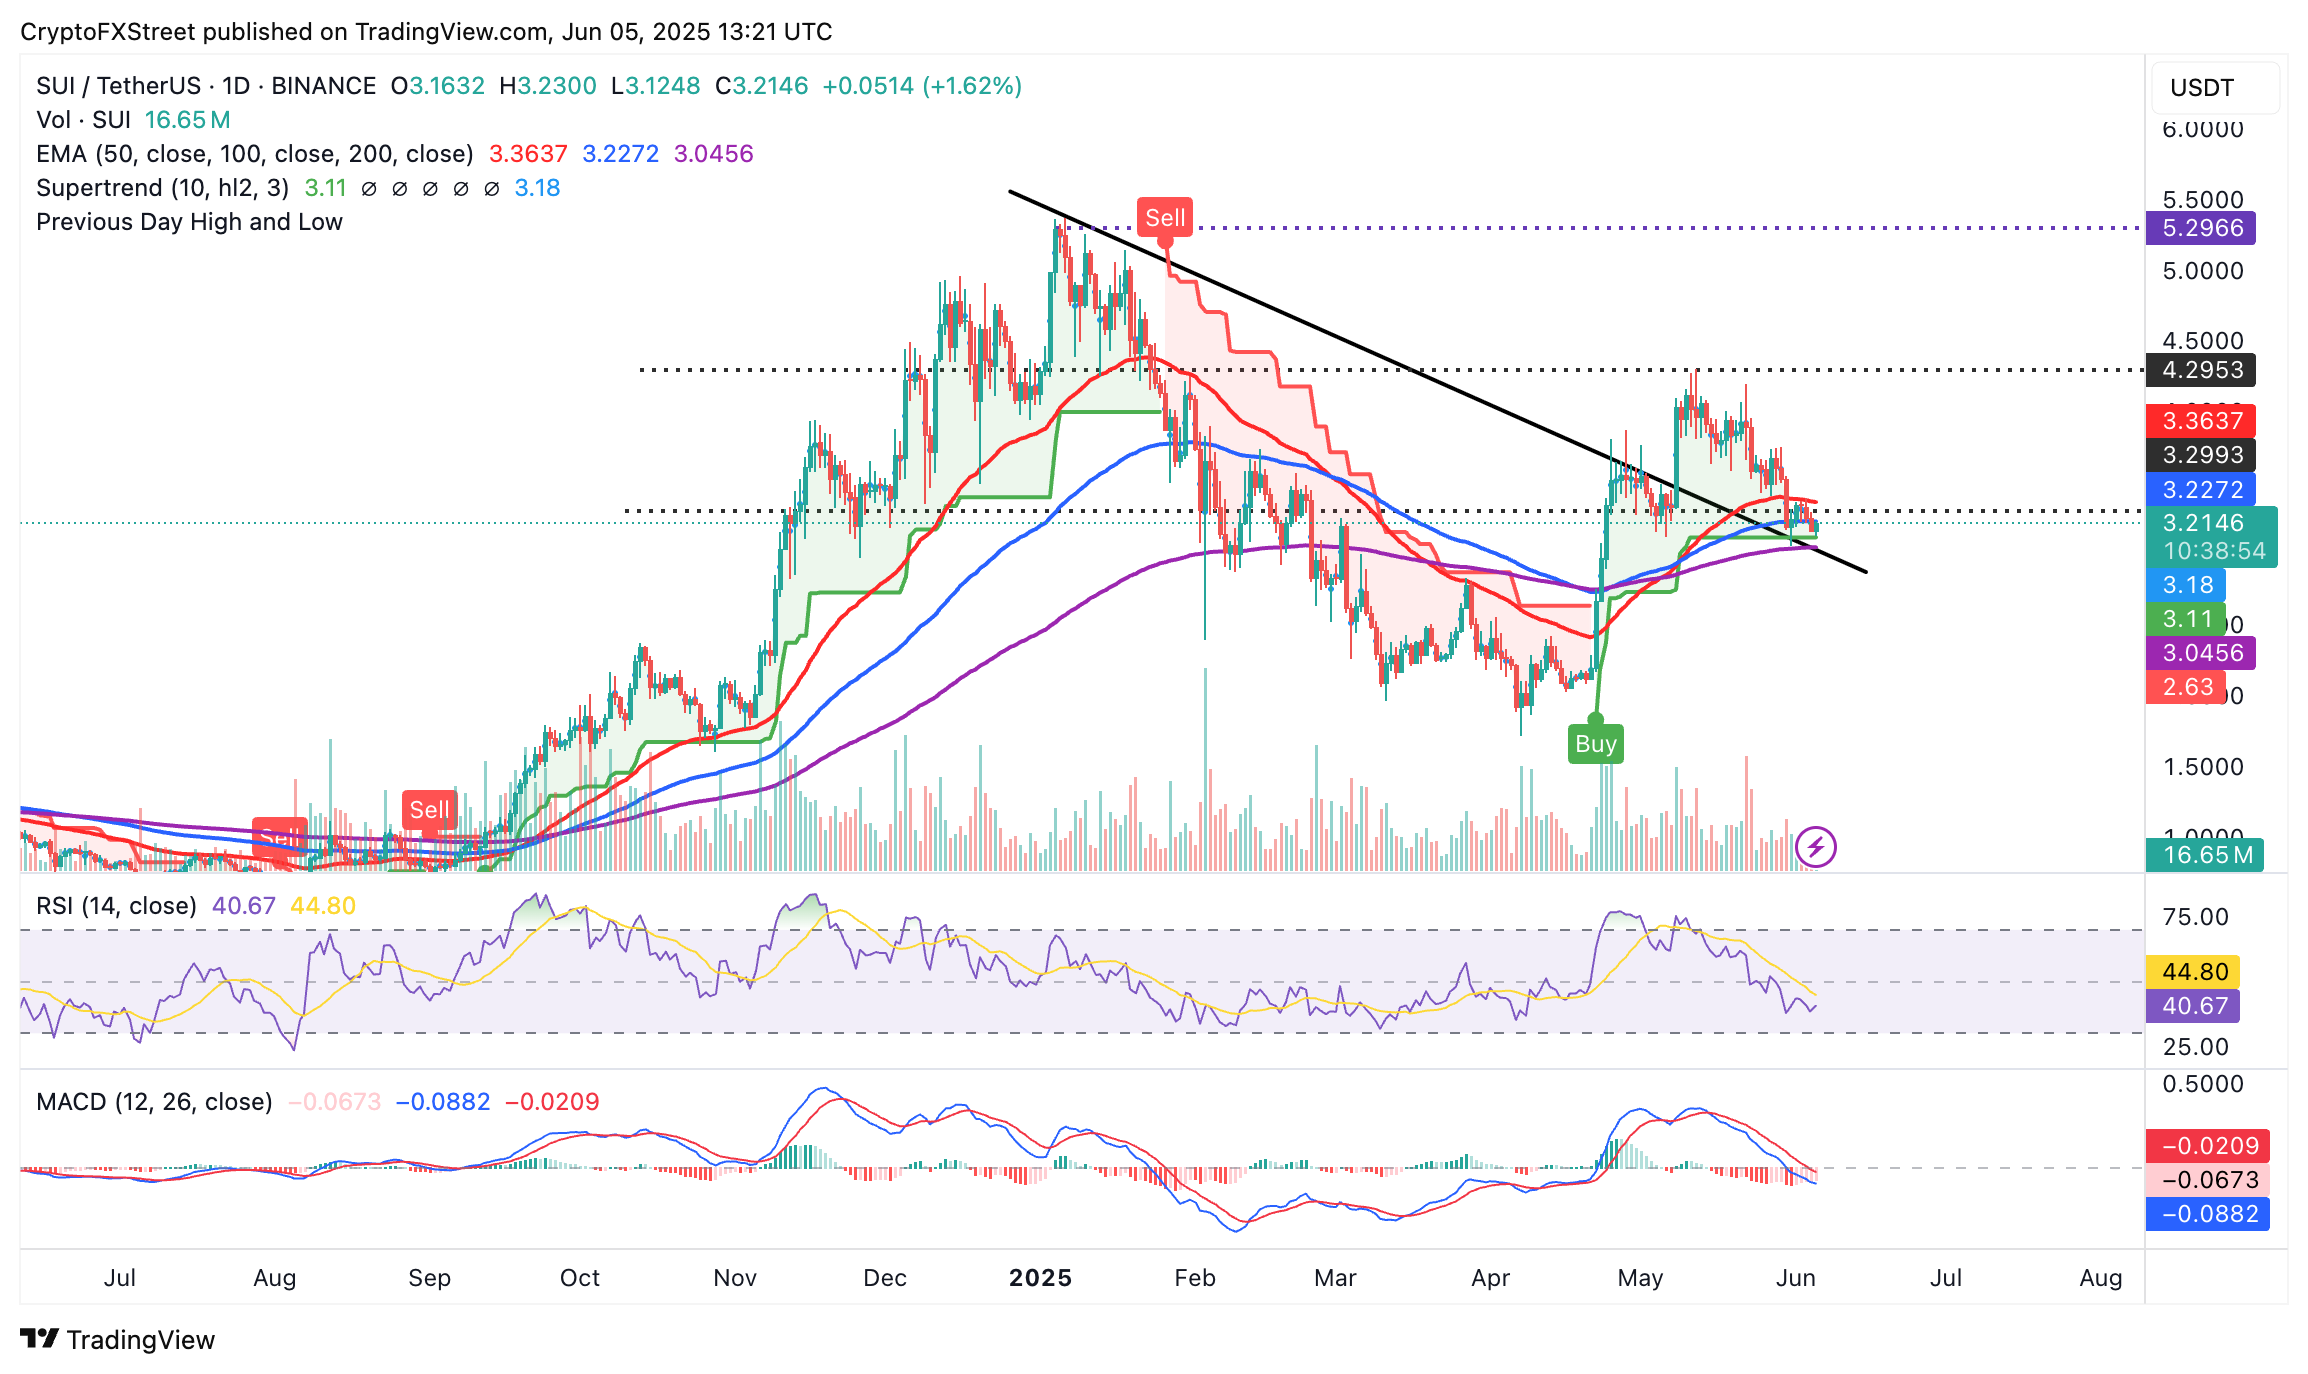
SUI/USDT daily chart
The SuperTrend indicator issued a buy signal on April 23, triggered when Sui’s price crossed above the trend-following tool. By utilizing the Average True Range (ATR), the SuperTrend gauges market volatility, acting as a dynamic support and resistance.
As long as the buy signal holds, the probability of Sui resuming the uptrend, targeting recent highs above $4.00, will be higher. A break above the 50-day Exponential Moving Average (EMA) resistance at $3.36 WOULD imply bullish momentum.
Cryptocurrency metrics FAQs
What is circulating supply?
The developer or creator of each cryptocurrency decides on the total number of tokens that can be minted or issued. Only a certain number of these assets can be minted by mining, staking or other mechanisms. This is defined by the algorithm of the underlying blockchain technology. On the other hand, circulating supply can also be decreased via actions such as burning tokens, or mistakenly sending assets to addresses of other incompatible blockchains.
What is market capitalization?
Market capitalization is the result of multiplying the circulating supply of a certain asset by the asset’s current market value.
What is trading volume?
Trading volume refers to the total number of tokens for a specific asset that has been transacted or exchanged between buyers and sellers within set trading hours, for example, 24 hours. It is used to gauge market sentiment, this metric combines all volumes on centralized exchanges and decentralized exchanges. Increasing trading volume often denotes the demand for a certain asset as more people are buying and selling the cryptocurrency.
What is the funding rate?
Funding rates are a concept designed to encourage traders to take positions and ensure perpetual contract prices match spot markets. It defines a mechanism by exchanges to ensure that future prices and index prices periodic payments regularly converge. When the funding rate is positive, the price of the perpetual contract is higher than the mark price. This means traders who are bullish and have opened long positions pay traders who are in short positions. On the other hand, a negative funding rate means perpetual prices are below the mark price, and hence traders with short positions pay traders who have opened long positions.
