Meme Coins Defy Gravity: WIF, SPX, and APE Signal Bullish Breakouts

Dogwifhat (WIF), SPX6900 (SPX), and ApeCoin (APE) are flashing green as meme coins shake off their 'joke asset' stigma—at least for now. Traders chasing the next parabolic move are piling into these tokens, betting against the odds (and maybe common sense).
WIF leads the pack with a 24-hour surge that’s got degens whispering 'next SHIB.' SPX follows close behind, riding speculative hype around its meme-stock nostalgia play. Meanwhile, APE claws back from its NFT winter slump, fueled by fresh metaverse rumors.
Will this rally outlast a TikTok trend? Unlikely. But in crypto, even the dumbest money can get smart returns—until the music stops. Just ask the 'stablecoin yield farmers' from 2021.
Dogwifhat aims to surpass the 200-day EMA
WIF trades at $0.978 at the time of writing on Wednesday, printing a potential Doji candle in the daily chart after three consecutive bullish candles, resulting in over a 23% surge from the low at $0.786 on Saturday.
The meme coin is in an uptrend as it formed a local bottom above the Supertrend indicator line at $0.780. Notably, the 50-day and 100-day Exponential Moving Averages (EMAs) NEAR $0.860 held the previous week's close above dynamic support levels.
With the recovery in action this week, the Moving Average Convergence/Divergence (MACD) indicator nears the signal line, hinting at a positive crossover that could signal a bullish reversal.
The 200-day EMA overlaps with the 50% Fibonacci retracement level at $1.147, drawn from November’s swing high at $4.163 to April’s lowest closing price at $0.316. A potential breakout above $1.147 could prolong the uptrend to the 78.6% Fibonacci retracement level at $2.398.
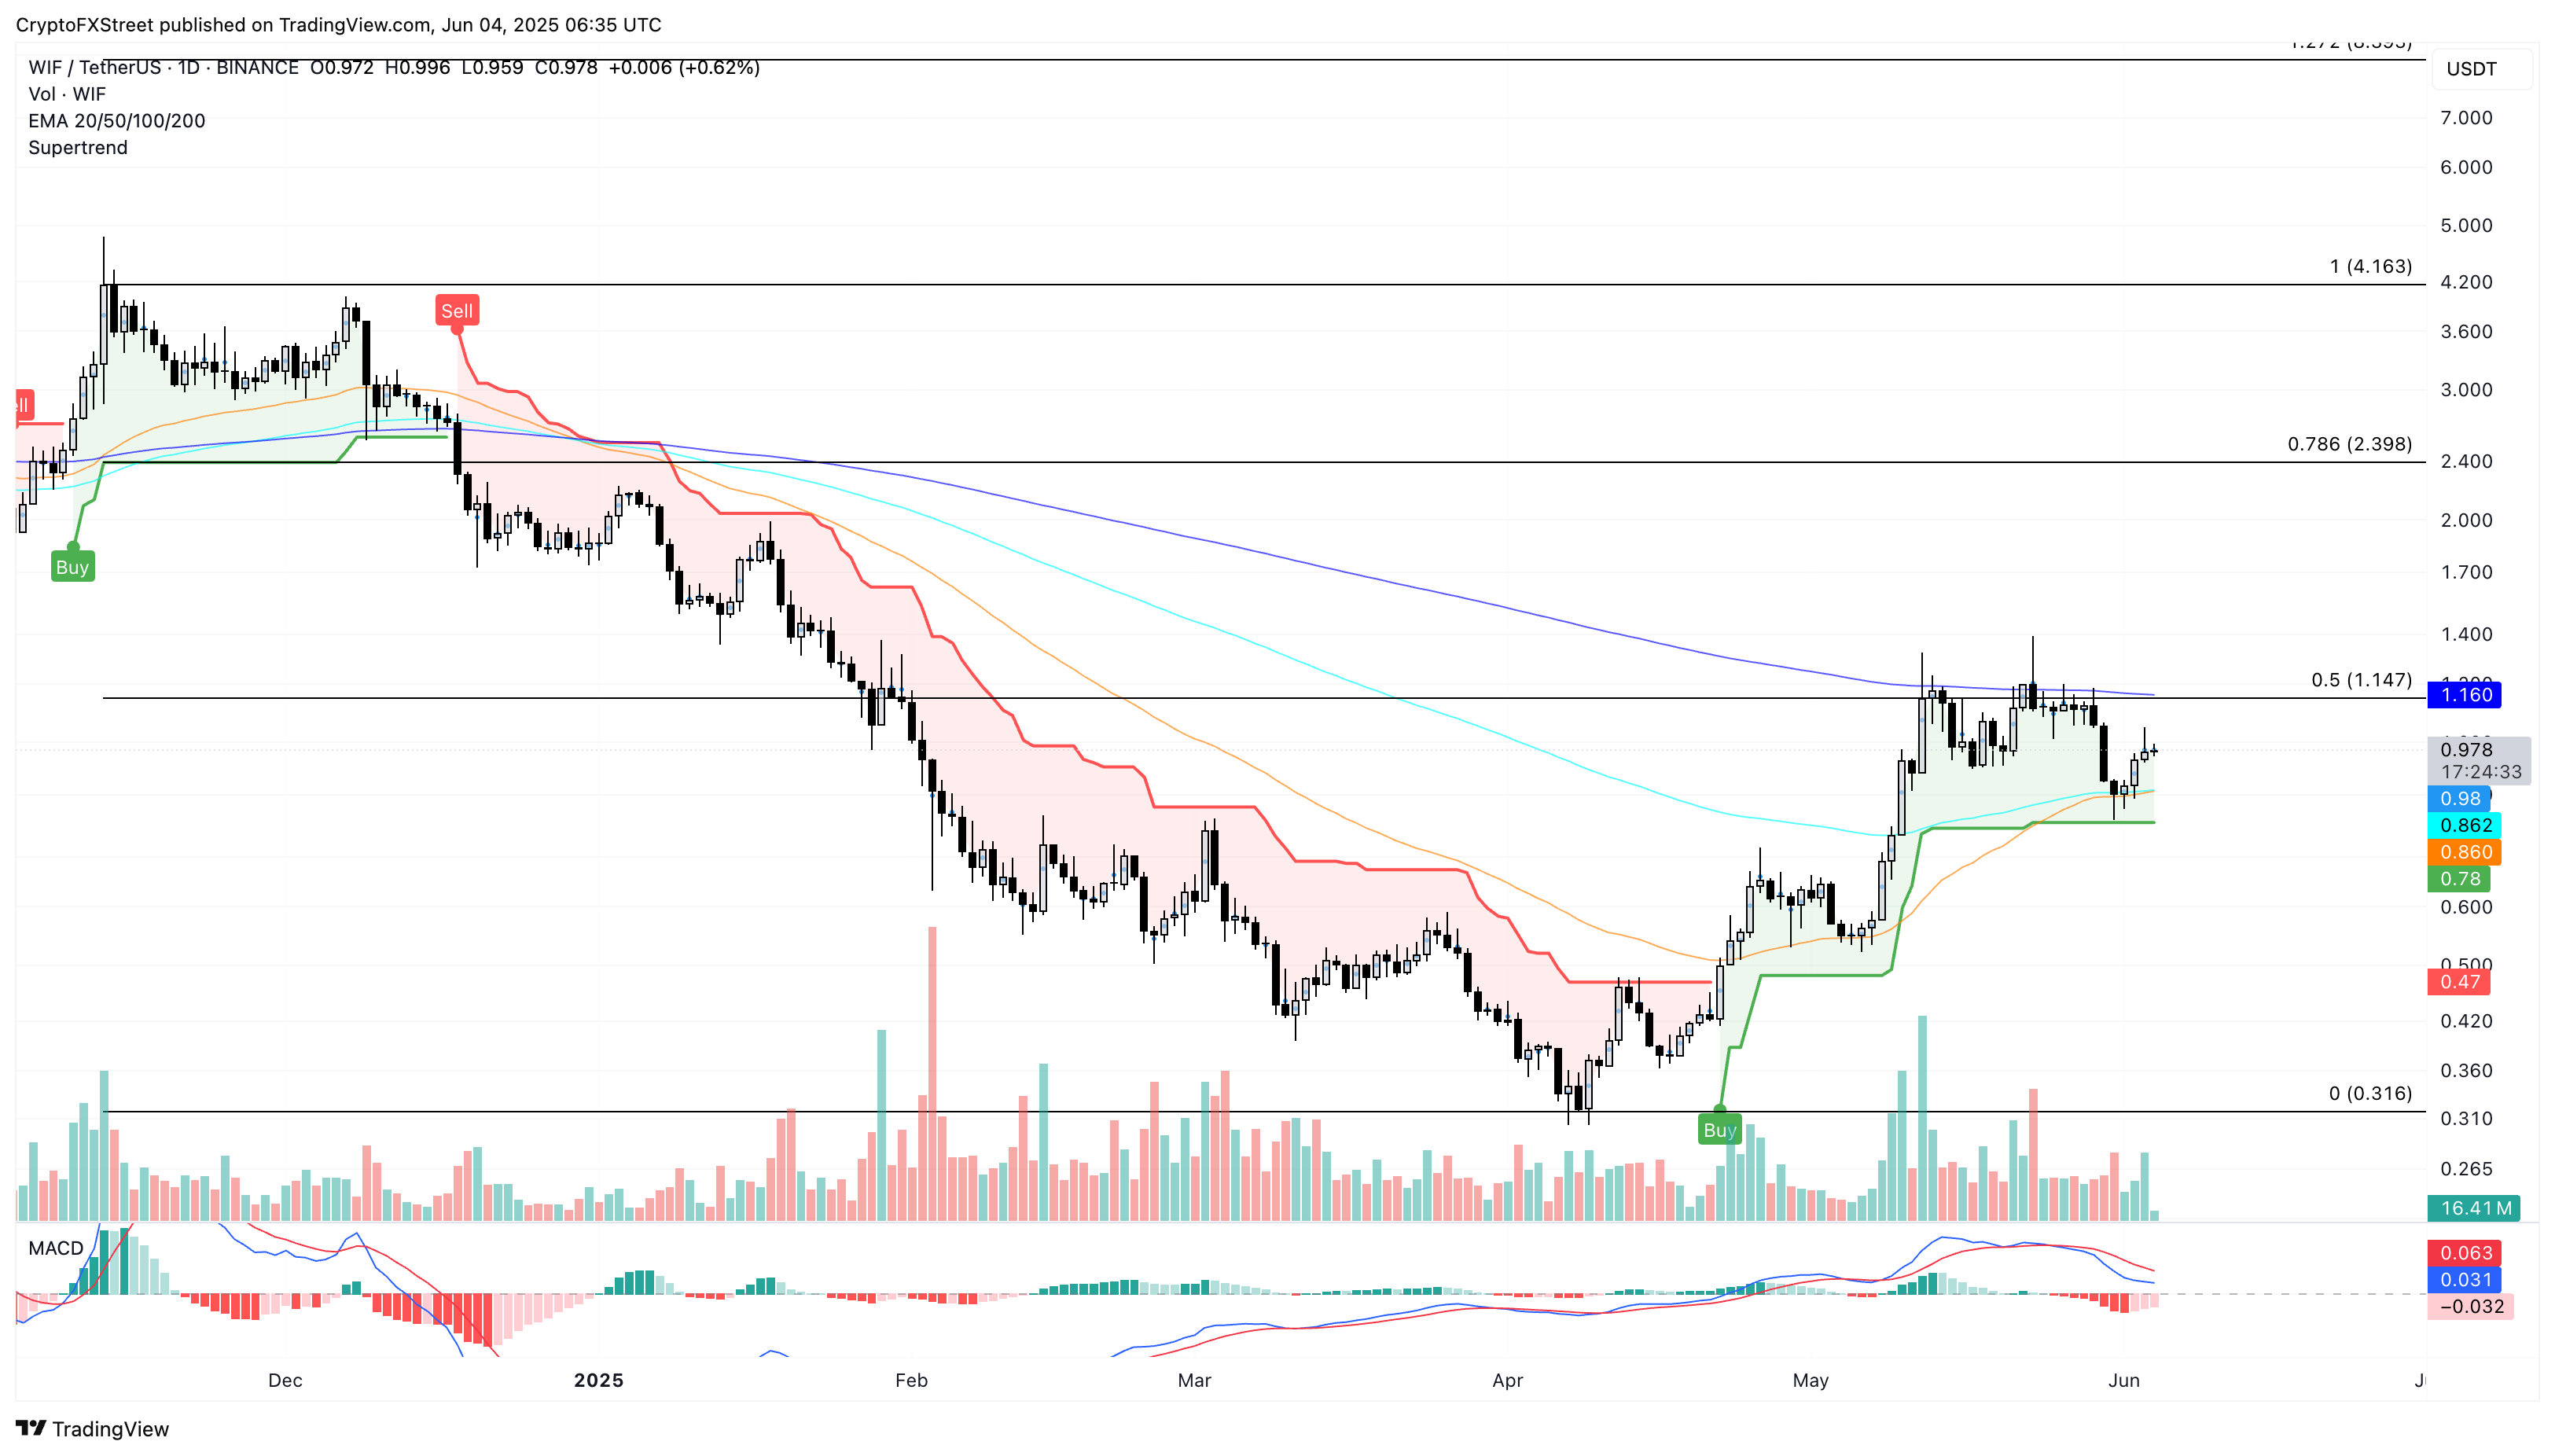
WIF/USDT daily price chart. Source: Tradingview
On the flip side, a potential reversal could result in a decline to Saturday's low near the 50-day EMA at $0.860.
SPX to extend bull run
SPX meme coin trades at $1.189, with a near 9% surge at press time on Wednesday, extending the weekly gains to 15% so far. Taking off the 50% Fibonacci retracement level at $0.92, drawn between the highest January closing price at $1.553 and the March’s lowest closing price of $0.294, SPX aims to challenge the 78.6% Fibonacci level at $1.284.
With the ongoing rally, the 50-day and 200-day EMAs flashed a golden cross on Sunday, a bullish signal for price action traders. Adding to this, the 100-day and 200-day EMAs are closing towards a bullish crossover, to reinstate a complete uptrend in motion.
However, the rising SPX price fails to reflect a momentum surge as the RSI line at 69 hovers almost flat near the overbought boundary line. This indicates a bearish divergence between the price and the RSI, hinting at a potential pullback during the uptrend.
If SPX closes above $1.284 on a daily basis, it could undermine the RSI bearish divergence, and the price could rise to $1.553.
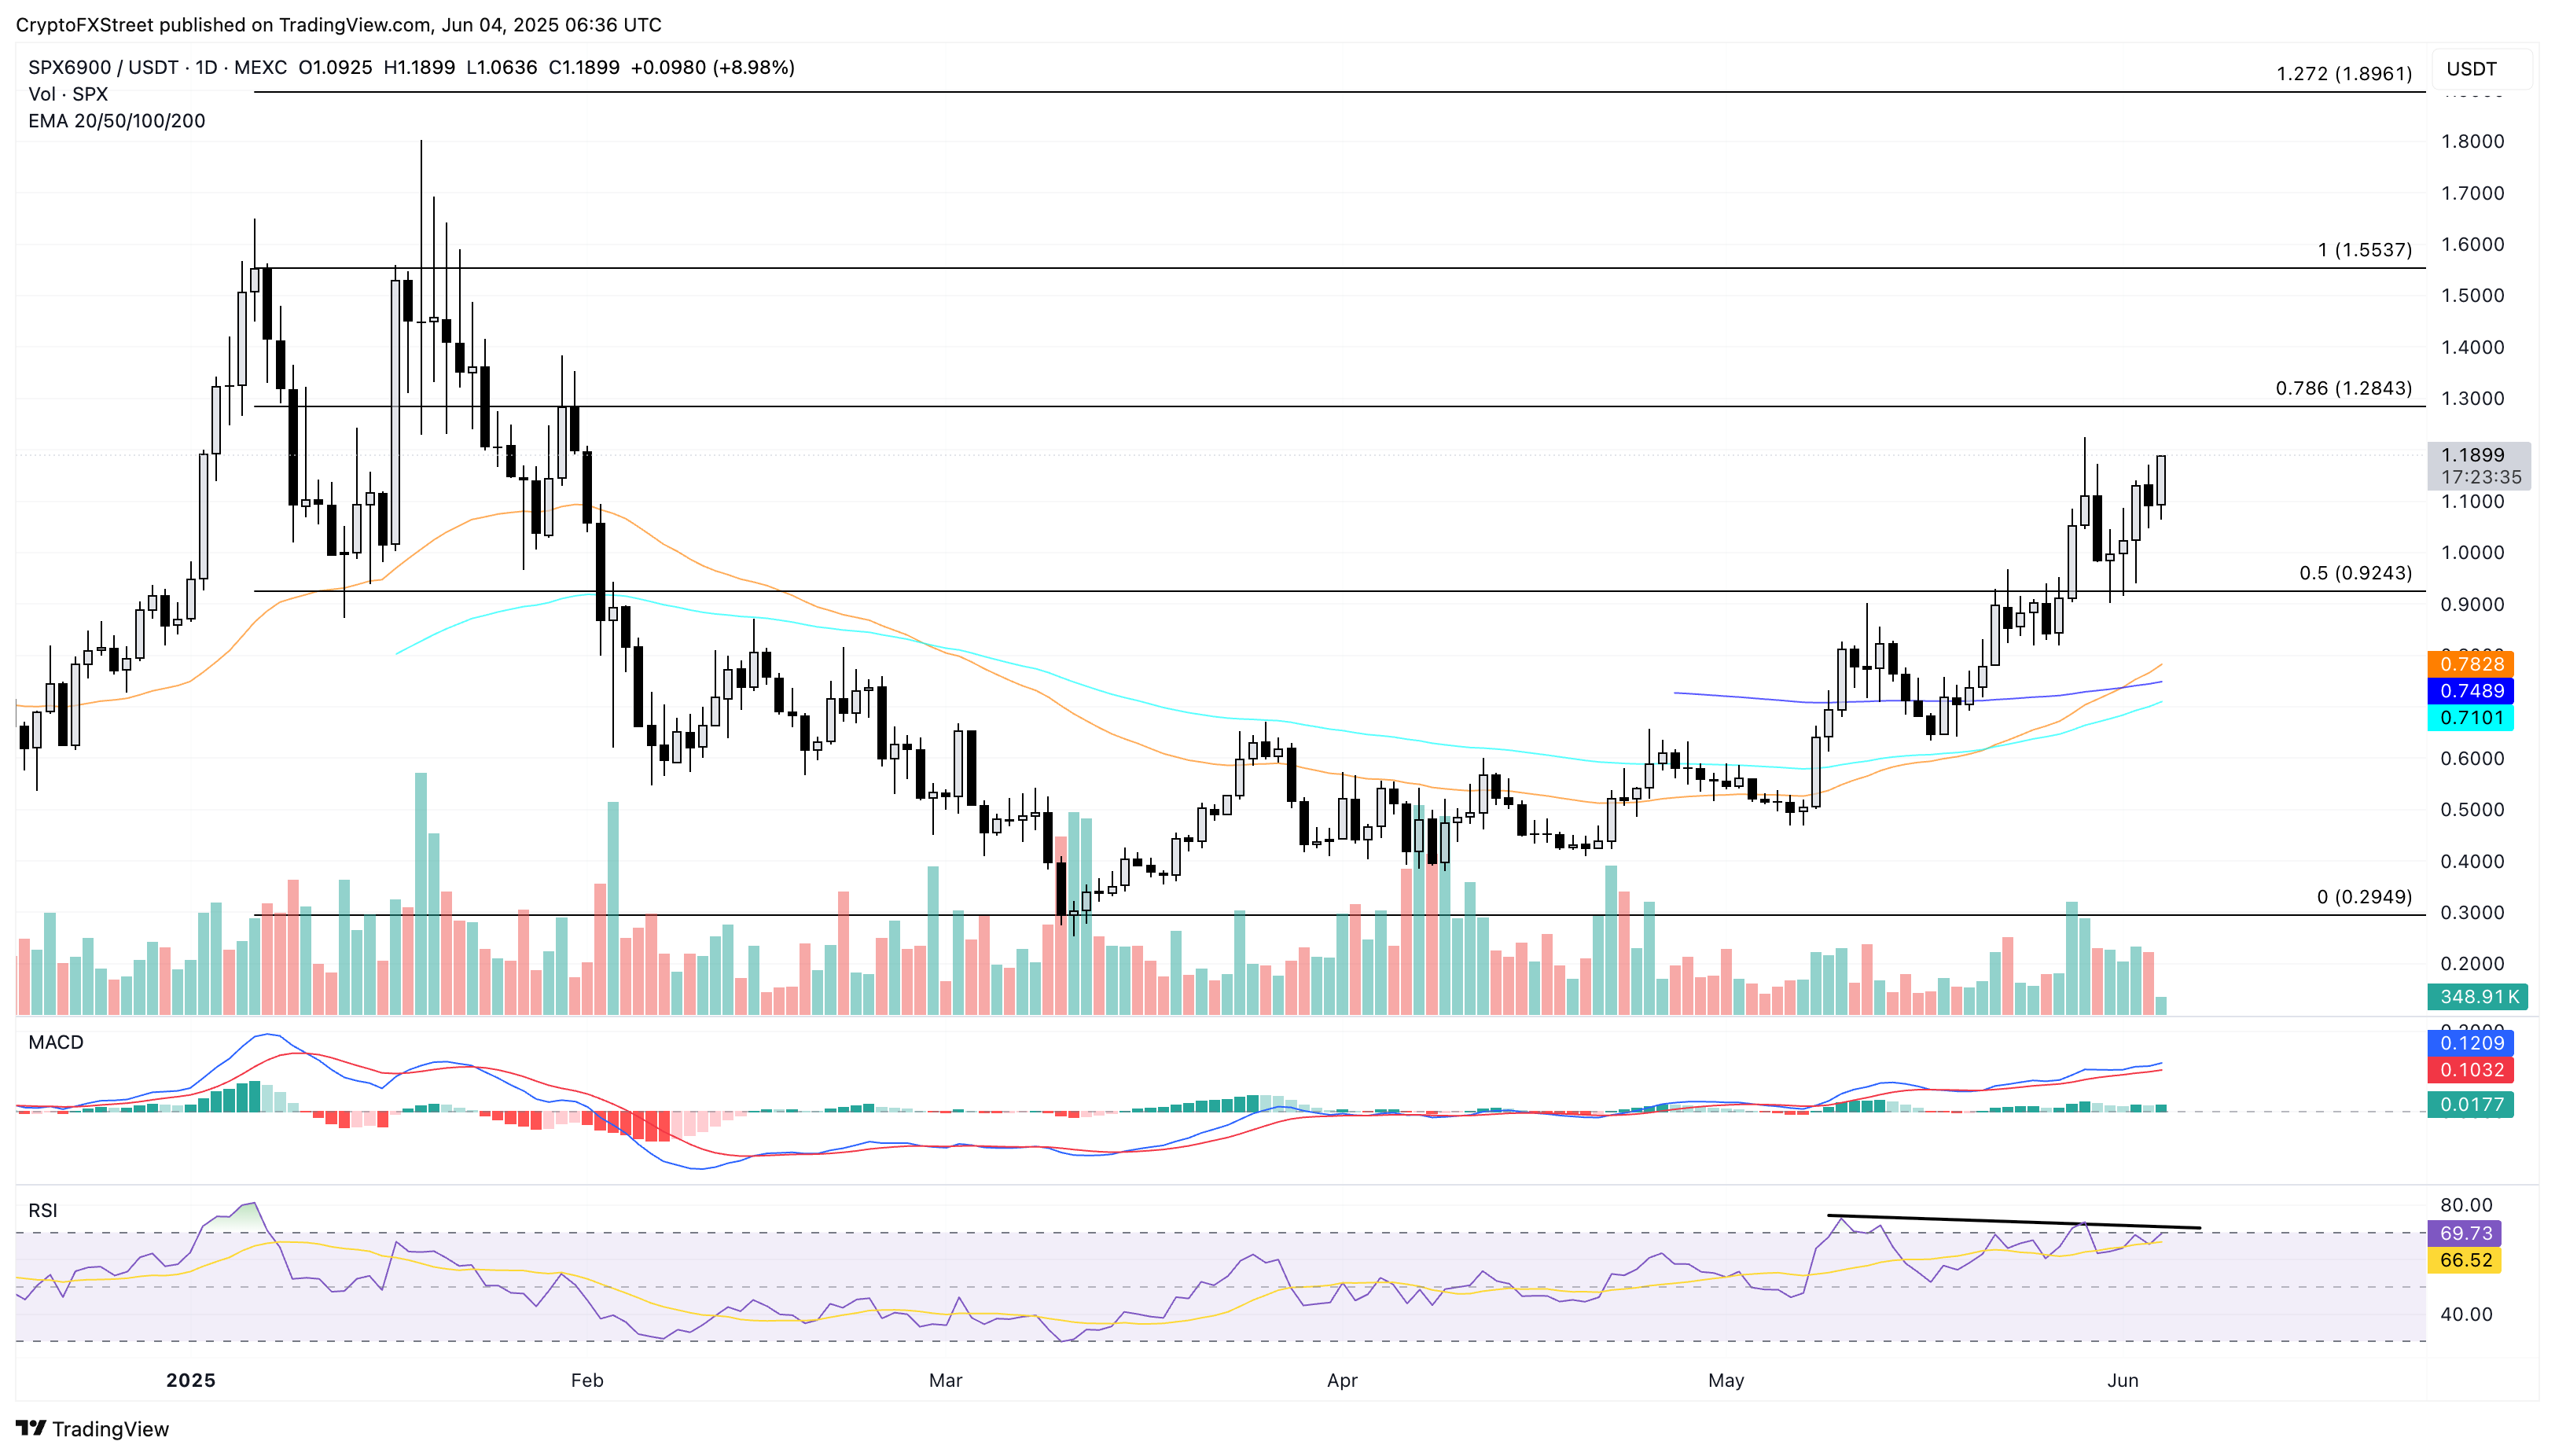
SPX/USDT daily price chart. Source: Tradingview
Conversely, a reversal from $1.284 could result in a steep decline to the 50% Fibonacci retracement level at $0.924.
Apecoin nears the 200-day EMA breakout to reach $1.16
APE is up nearly 14% in the day at press time, signaling a range breakout formed between the 200-day EMA at $0.7379 and the 100-day EMA at $0.6325. The 23.60% Fibonacci retracement level aligns with the 200-day EMA, drawn from $1.9450 on December 4 to $0.3769 on April 8.
To mark a decisive breakout, the meme coin must sustain a closing price above the breached levels. This could result in a price surge to the 50% Fibonacci retracement level at $1.1610. Investors could anticipate a minor hurdle near the $1 psychological mark.
The MACD and its signal line mark a bullish crossover, while the RSI line shows a spike to 64, indicating room for growth. As the momentum indicators suggest a surge in buying pressure, investors could witness a sharp rally upon breakout.
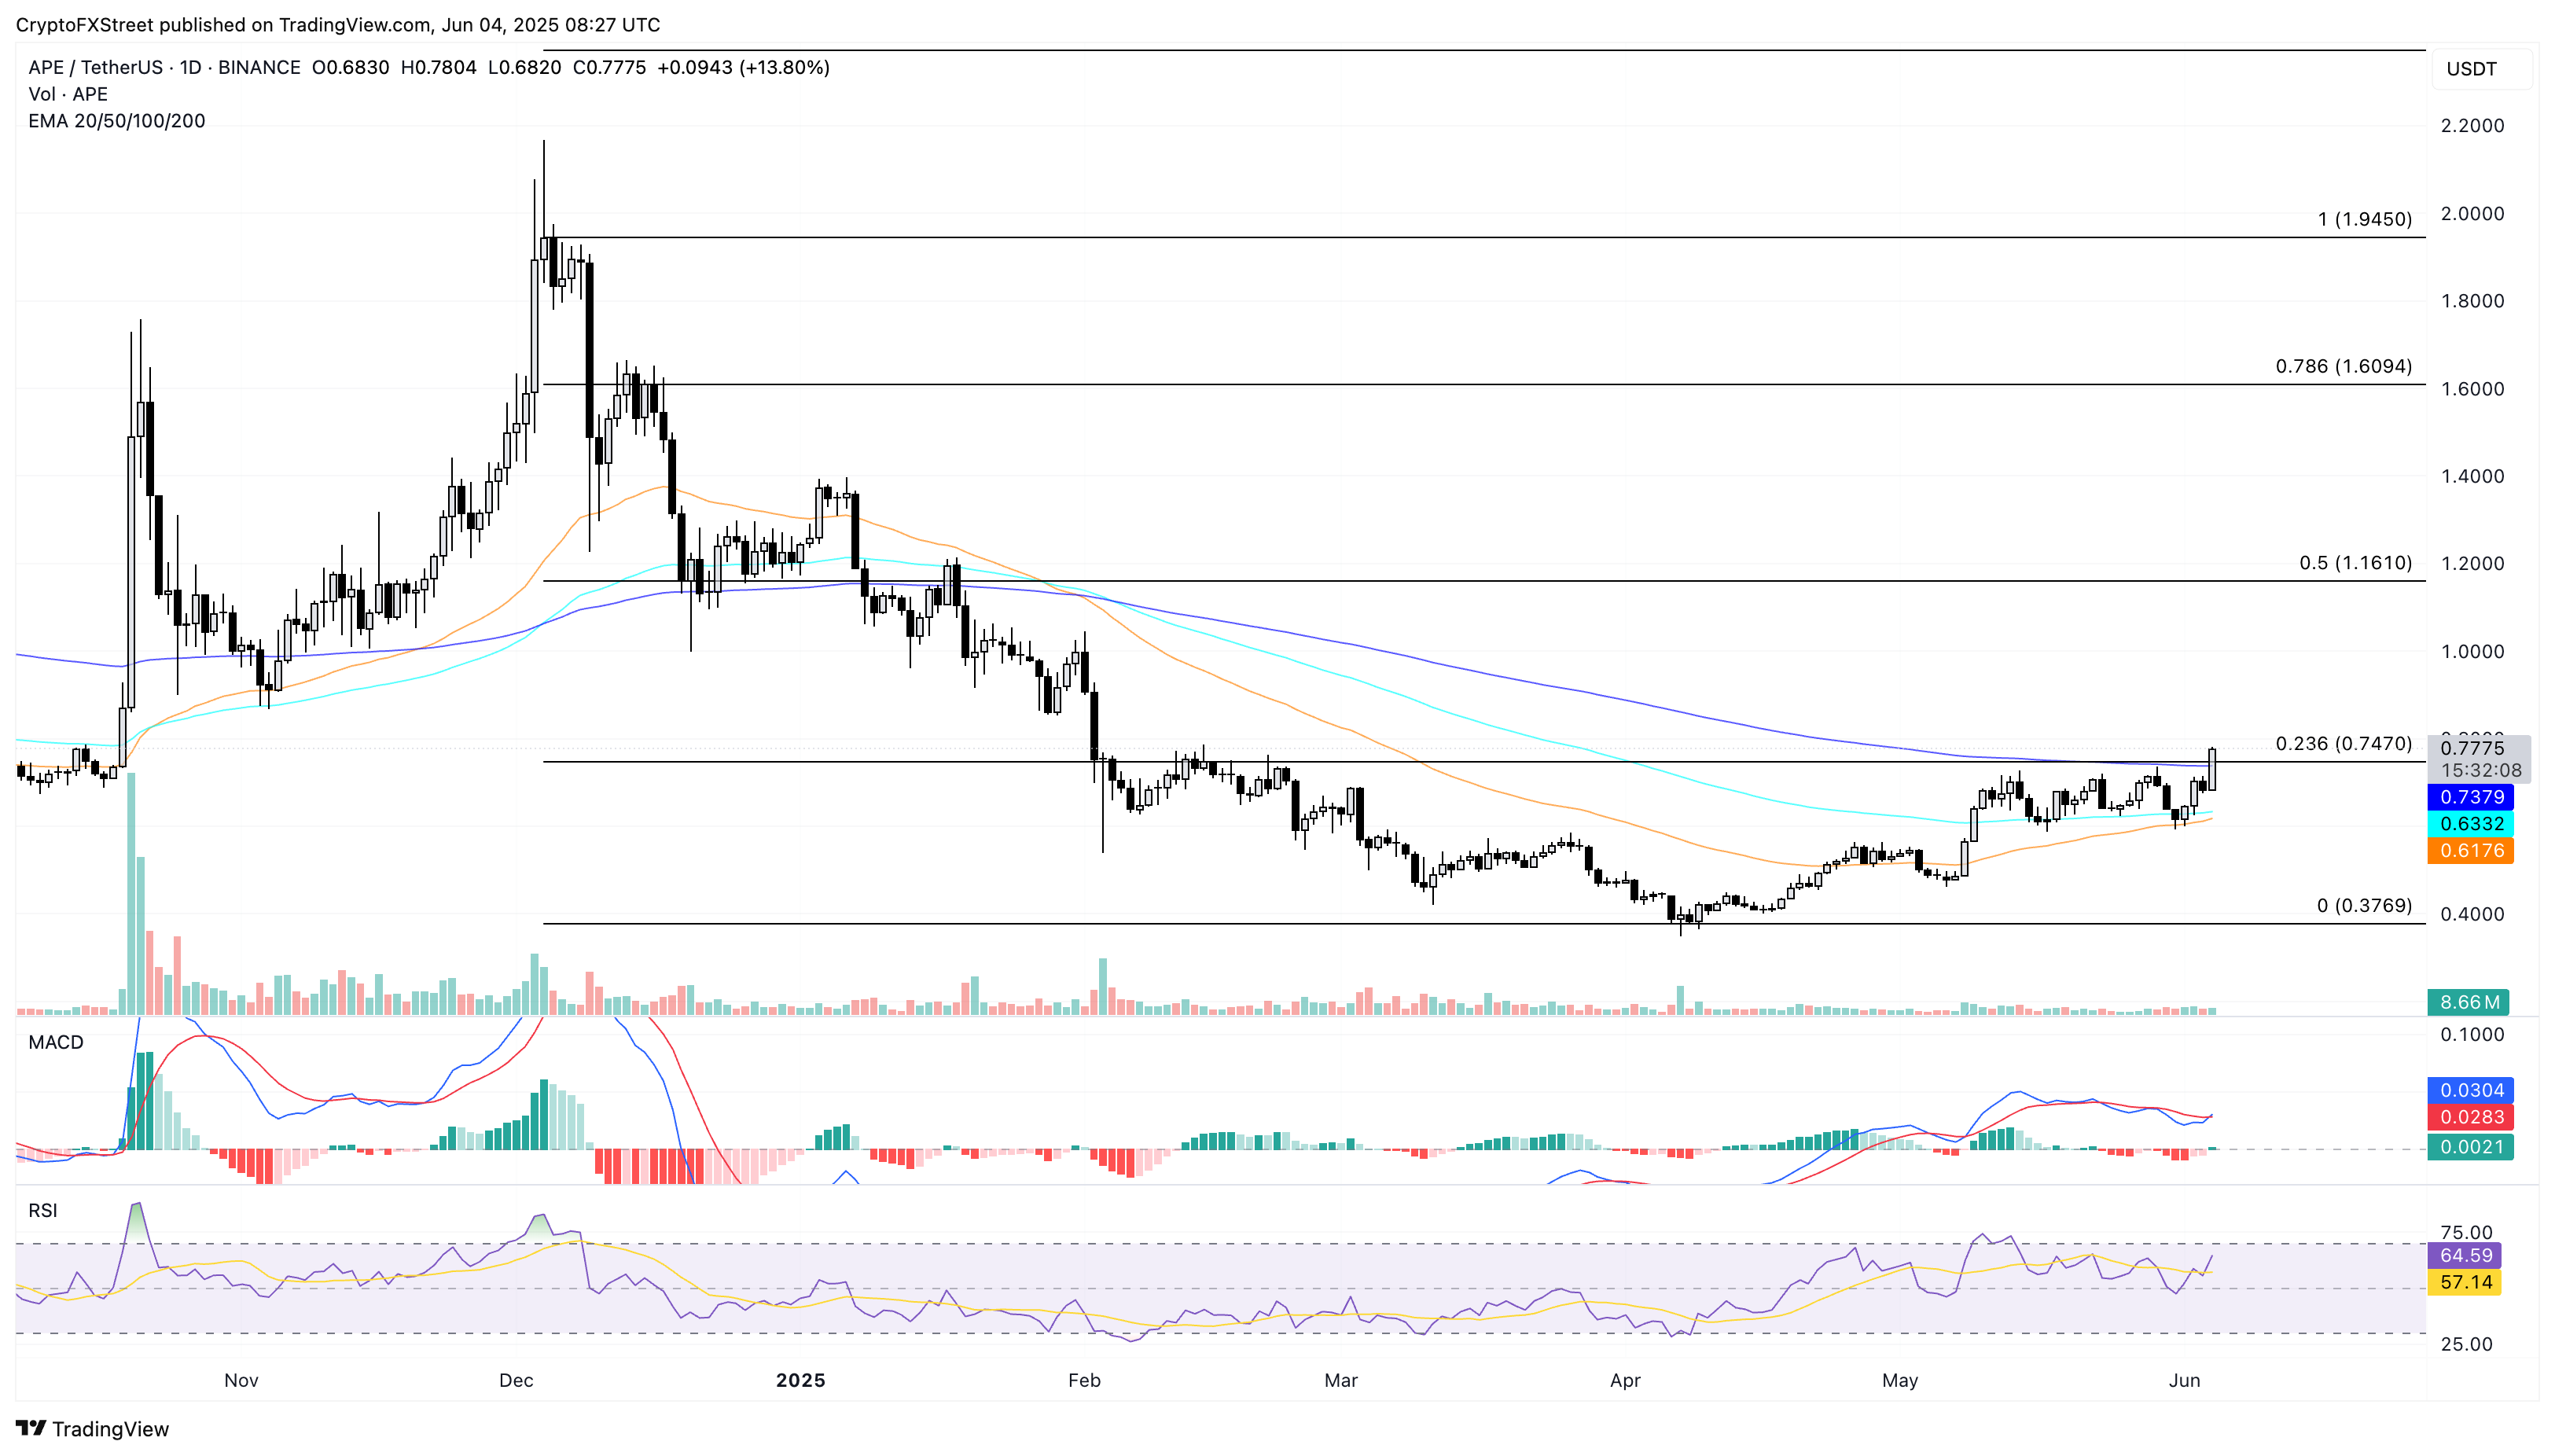
APE/USDT daily price chart. Source: Tradingview
Conversely, a failure to hold prices above the 200-day EMA could result in a retest of the 50-day EMA at $0.6176.

Log in to Reply
Log in to comment your thoughtsComments
Related Articles
|Square
Get the BTCC app to start your crypto journey
Get started today Scan to join our 100M+ users