AAVE, APE, CRO: Three Altcoins Primed for a Bullish Surge This Week

Crypto traders, take note—AAVE, APE, and CRO are flashing breakout signals as market sentiment tilts bullish. Here's why these tokens could dominate the conversation.
AAVE: DeFi's Resilient Contender
Despite the sector's ups and downs, AAVE's lending protocol keeps defying gravity—because nothing says 'trust the system' like algorithmic interest rates.
APE: Meme Hype Meets Utility
Bored Ape's token refuses to fade into irrelevance, proving that even in a bear market, primate-themed assets have staying power.
CRO: The Exchange Token With Ambition
Crypto.com's native token keeps climbing—turns out relentless marketing and stadium naming rights do move the needle after all.
Will this trio deliver gains, or is it just another case of hopium-fueled speculation? Only the charts—and the whales—will tell.
Aave bulls target $350 if it closes above its key resistance
Aave price faced rejection from its daily level at $282.84 on May 27 and declined by nearly 10% until Sunday. However, it recovered almost all its recent losses in the following two days. At the time of writing on Wednesday, it hovers around $264.
If AAVE breaks and closes above its daily resistance at $282.84 on a daily basis, it could extend the rally toward its January 31 daily high at $349.23.
The Relative Strength Index (RSI) on the daily chart reads 63, above its neutral level of 50, indicating bullish momentum.
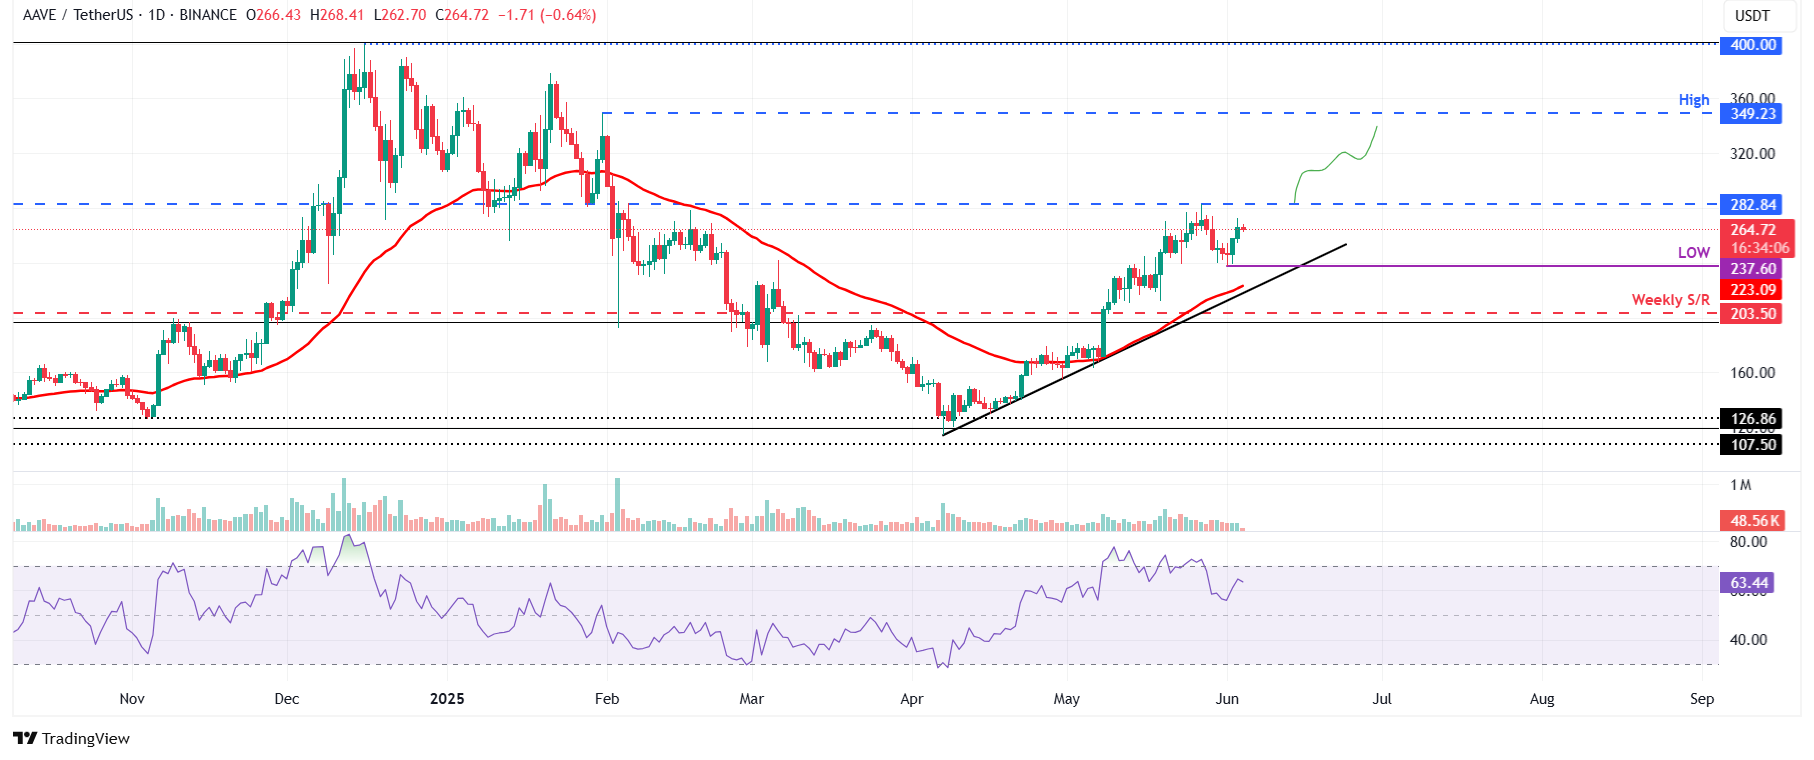
AAVE/USDT daily chart
However, if Aave fails to close above the $282.84 level and declines, it could extend the correction to retest its Sunday low of $237.60.
ApeCoin price action is on the verge of a bullish breakout
ApeCoin price has produced multiple higher lows and roughly equal highs since early February.
Connecting these swing points using a trend line reveals an ascending triangle formation in the daily chart. This technical pattern exhibits a bullish bias, and the target is typically determined by measuring the distance between the first swing high and the first swing low to the breakout point. At the time of writing on Wednesday, APE is nearly its upper boundary of this pattern, around $0.73.
If AAVE breaks above the upper boundary of this pattern at around $0.80, it could extend the rally toward its technical target of $1.15. Investors should be cautious of this theoretical move, as any upside MOVE could encounter resistance at the psychological level of $1, where traders could book some profits.
The RSI on the daily chart reads 60, above its neutral level of 50 and points upward, indicating bullish momentum is gaining traction. The Moving Average Convergence Divergence (MACD) indicator is about to flip a bullish crossover on the daily chart. A successful bullish crossover WOULD provide a buy signal supporting the upward trend.
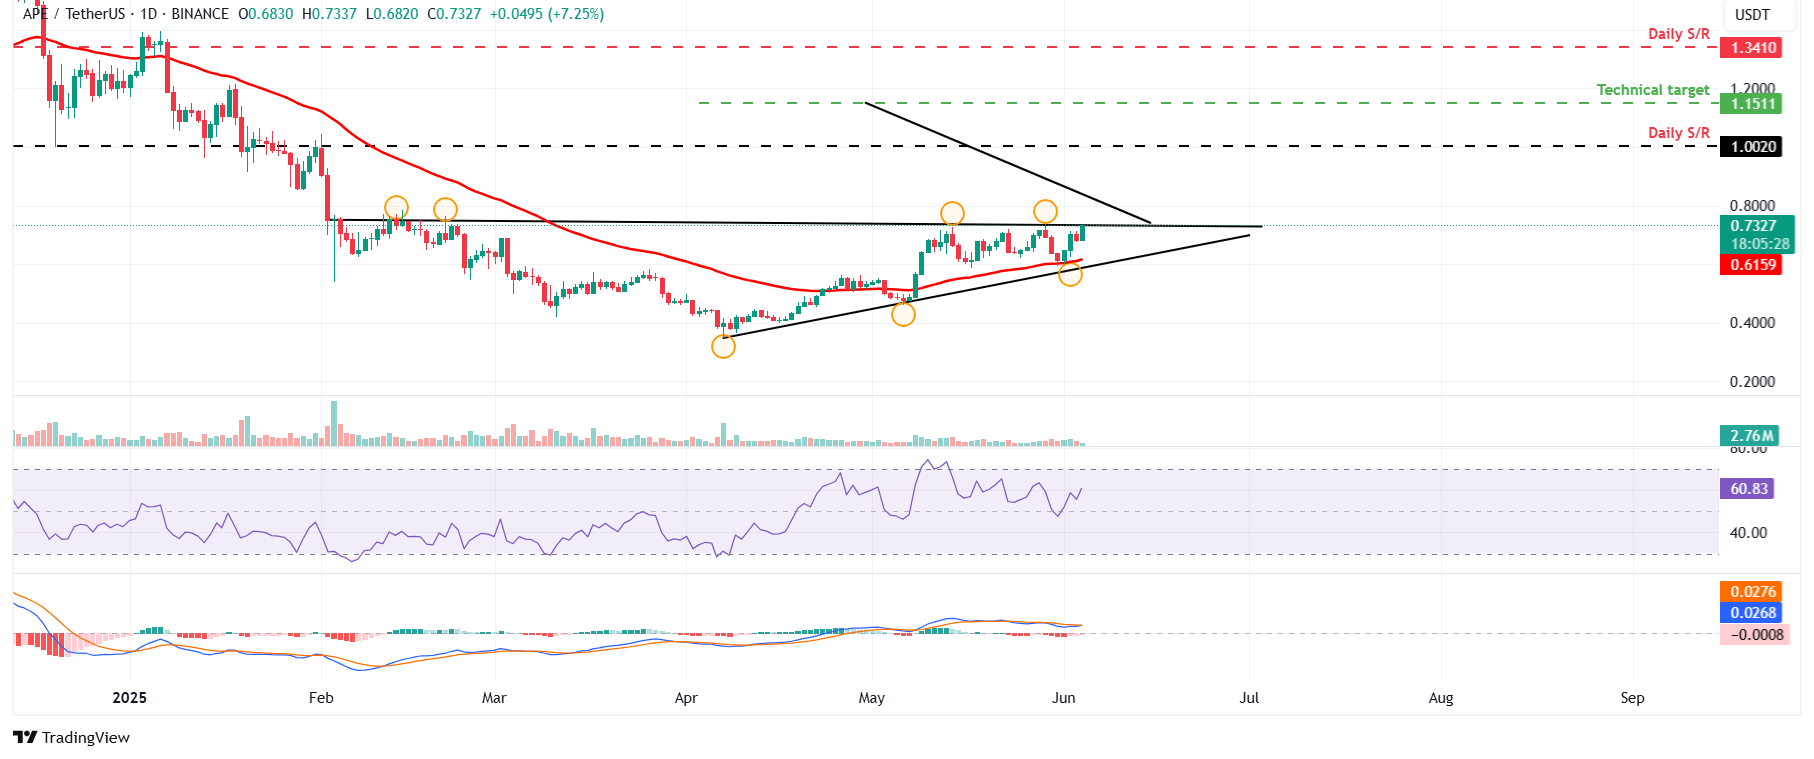
APE/USDT daily chart
However, if APE faces rejection from its upper boundary, it could extend the decline to find support around its 50-day EMA at $0.61.
Cronos could rally if it breaks above its symmetrical triangle pattern
Cronos price trades inside a symmetrical triangle pattern. This pattern is formed by connecting multiple high and low levels with two converging trendlines (from the end of January to early June). Breaking above this pattern favors the bulls, and at the time of writing on Wednesday, CRO trades around $0.102.
If CRO breaks above the upper trendline boundary and closes above the weekly resistance at $0.108, it could extend the rally toward its technical target of $0.171 (obtained by measuring the distance between the first daily high and the first daily low and adding it to the breakout point). This is a theoretical target, and traders could opt to realize some profits earlier, at around the daily level of $0.136.
The RSI on the daily chart reads 55, above its neutral level of 50, indicating slight bullish momentum. The MACD showed a bullish crossover on Sunday, providing a buy signal.
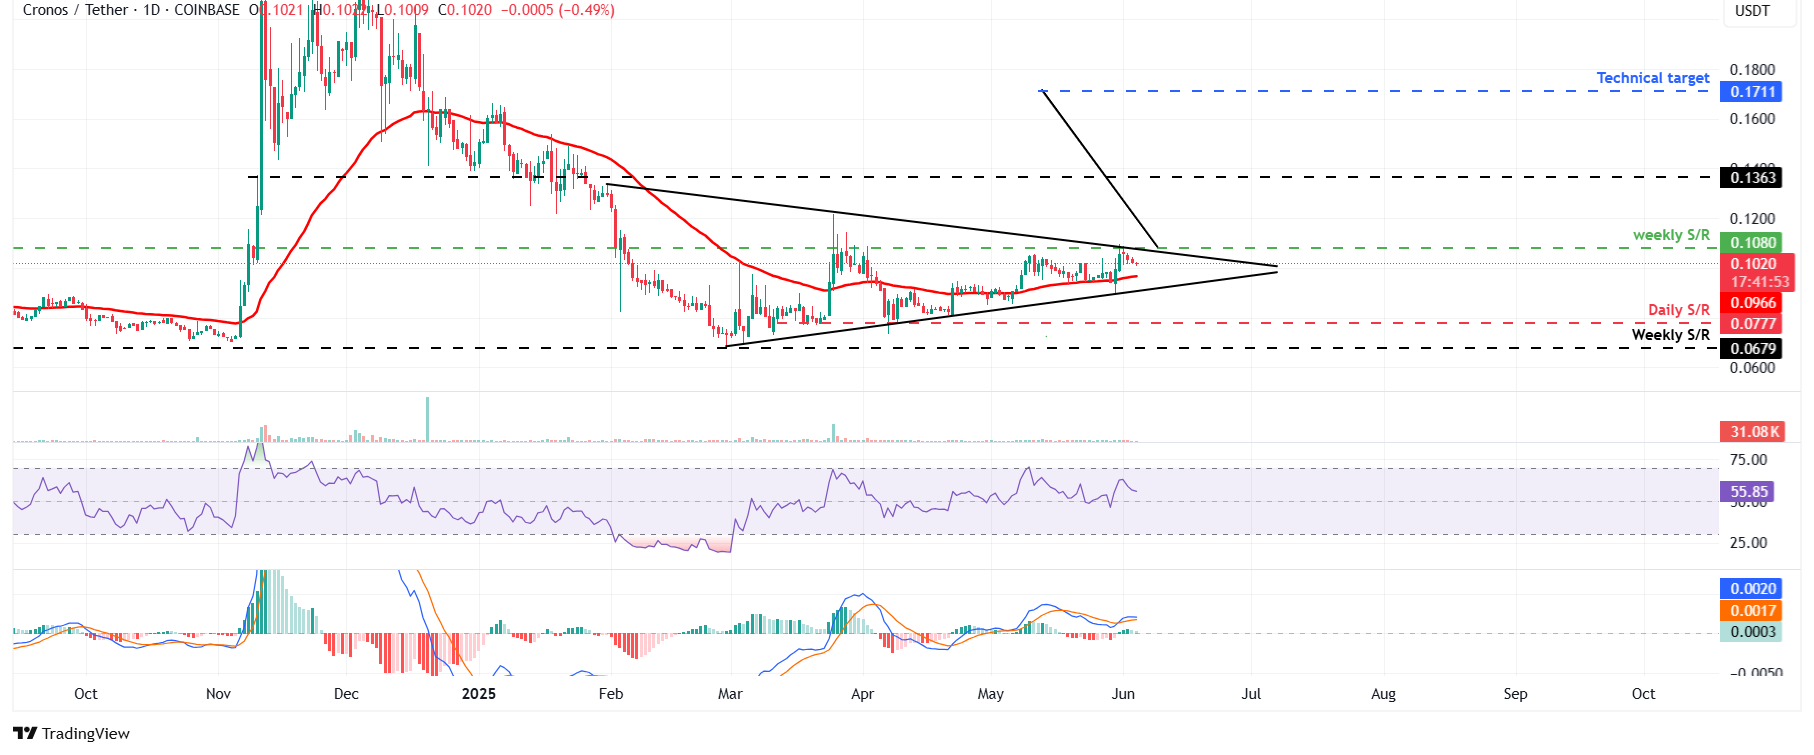
CRO/USDT daily chart
However, if CRO faces a pullback, it could extend the decline to find support around its 50-day EMA at $0.096.
