Solana Goes Legit in Dubai: Foundation Inks Deal with Crypto Watchdog VARA
Solana just got a golden ticket to the Middle East’s crypto playground. The blockchain’s nonprofit arm signed a memorandum with Dubai’s Virtual Assets Regulatory Authority (VARA)—because nothing says ’serious project’ like cozying up to regulators.
This isn’t just a handshake deal. The MOU signals Solana’s push for institutional credibility in a region that’s equal parts crypto oasis and compliance minefield. VARA gets another big-name ally for its sandbox; Solana gets a foothold in a market where others flounder with red tape.
Funny how blockchain’s anti-establishment darlings now queue up for government stamps of approval. Maybe decentralization was just the first draft.
Solana’s growing ecosystem
The solana Foundation announced on Tuesday that it has signed a Memorandum of Understanding with Dubai’s VARA. This collaboration aims to foster crypto innovation through talent development programs, data sharing, workshops, advisory sessions and provide support for a Solana Economic Zone in Dubai.
“This partnership helps Solana founders plug directly into that momentum,” says Solana on its X post.

Earlier on Monday, a fertility services provider in Asia, NewGenIvf Group Limited, announced its plans to invest $30 million in Solana staking. The firm had invested $1 million in Bitcoin back in December 2024.
“The decision to scale our investment from our initial $1 million bitcoin position to this substantial $30 million Solana commitment reflects our growing conviction in digital assets as a legitimate asset class,” says Siu Wing Fung Alfred, Founder, Chairman, and CEO of NewGen.
Despite this announcement and collaboration, the Solana price posts mild gains in the short term, trading at around $160 on Tuesday. However, in the long term, this indicates a bullish outlook for the Solana price, as it suggests growing confidence in the SOL ecosystem and broader adoption.
Solana’s technical outlook shows weakness in momentum
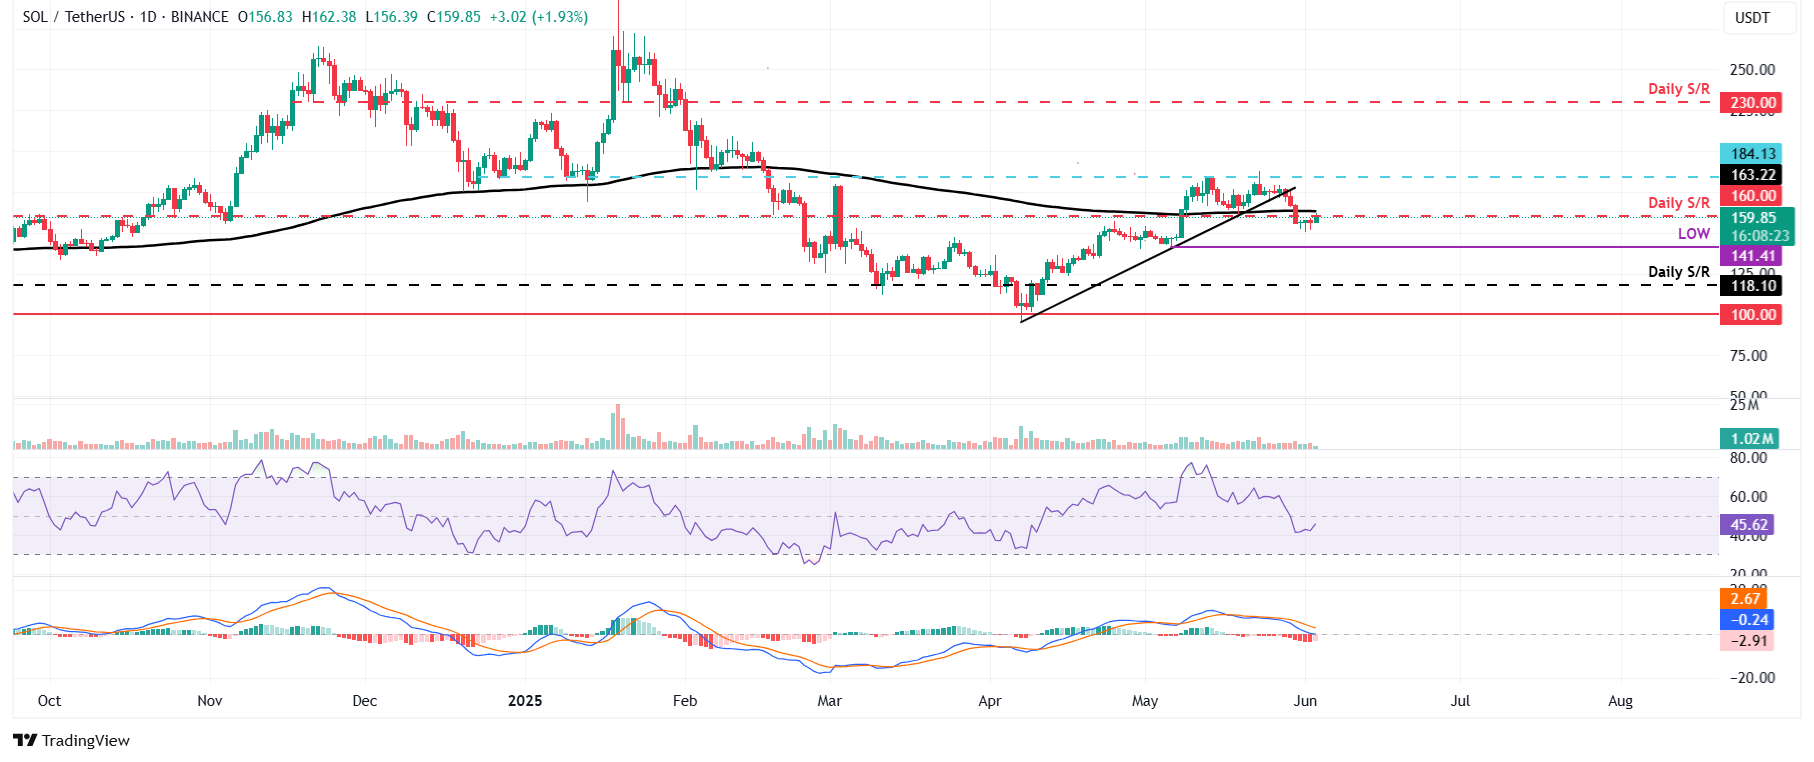
Solana’s price broke and closed below an ascending trendline (drawn by connecting multiple lows since early April) on May 28 and declined by 9.30% over the next two days. However, it stabilized at around $157 during the weekend. At the time of writing on Tuesday, it trades slightly higher, approaching the 200-day Exponential Moving Average (EMA) at $163.22.
If the 200-day EMA at $163.22 holds as resistance, SOL could extend the decline to retest its May 6 low of $141.41.
The Relative Strength Index (RSI) on the daily chart reads 45, below its neutral level of 50, indicating slight bearish momentum. The Moving Average Convergence Divergence (MACD) shows a bearish crossover. It also shows a red histogram bar below its neutral level, indicating the continuation of a downward trend.

SOL/USDT daily chart
However, if SOL breaks and closes above the 200-day EMA at $163.22, it could extend the recovery to retest its next daily resistance at $184.13.

