DOGE Smashes Resistance—Meme Coin Primed for Bull Run

Dogecoin just ripped through its short-term trading range like a hype-fueled rocket—technical signals now flashing green for a potential surge.
After weeks of sideways action, the meme coin’s breakout suggests traders are betting big on its ’fundamentals’ (read: Elon tweets and retail FOMO).
Will this finally be DOGE’s month to outperform actual utility tokens? Stay tuned—the charts don’t lie, but crypto narratives sure do.
Derivatives data back Dogecoin’s reversal chances
CoinGlass data shows the 24-hour Dogecoin volume rising by 21% to $3.44 billion while the Open Interest (OI) surges by 2.70%, reaching $2.09 billion. A boost in OI relates to rising fund inflow in the derivatives market, typically leading to increased buying interest. Notably, the 24-hour liquidation data shows that nearly double the bearish positions were wiped out, worth $2.64 million, compared to the long-sided positions worth $1.42 million.
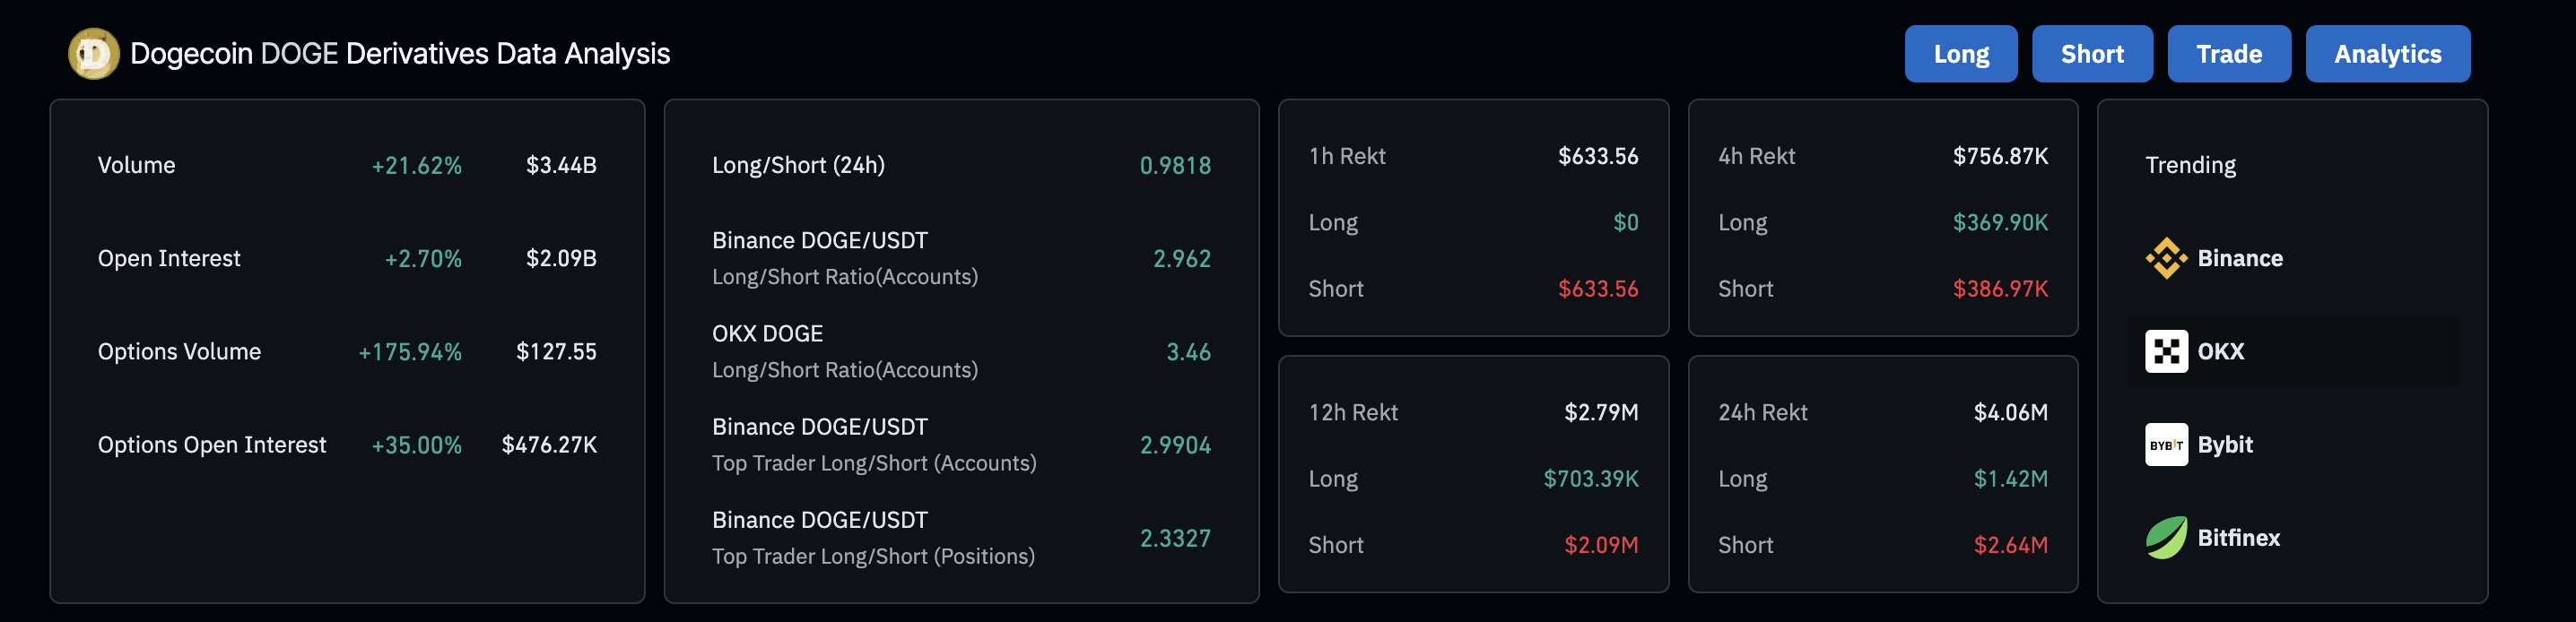
DOGE derivatives data. Source: Coinglass
Additionally, the OI-weighted funding rate of dogecoin at 0.0075% reflects an increase in buying activity. Positive funding rates help align rising derivatives prices with spot prices as leveraged-buying activity grows.
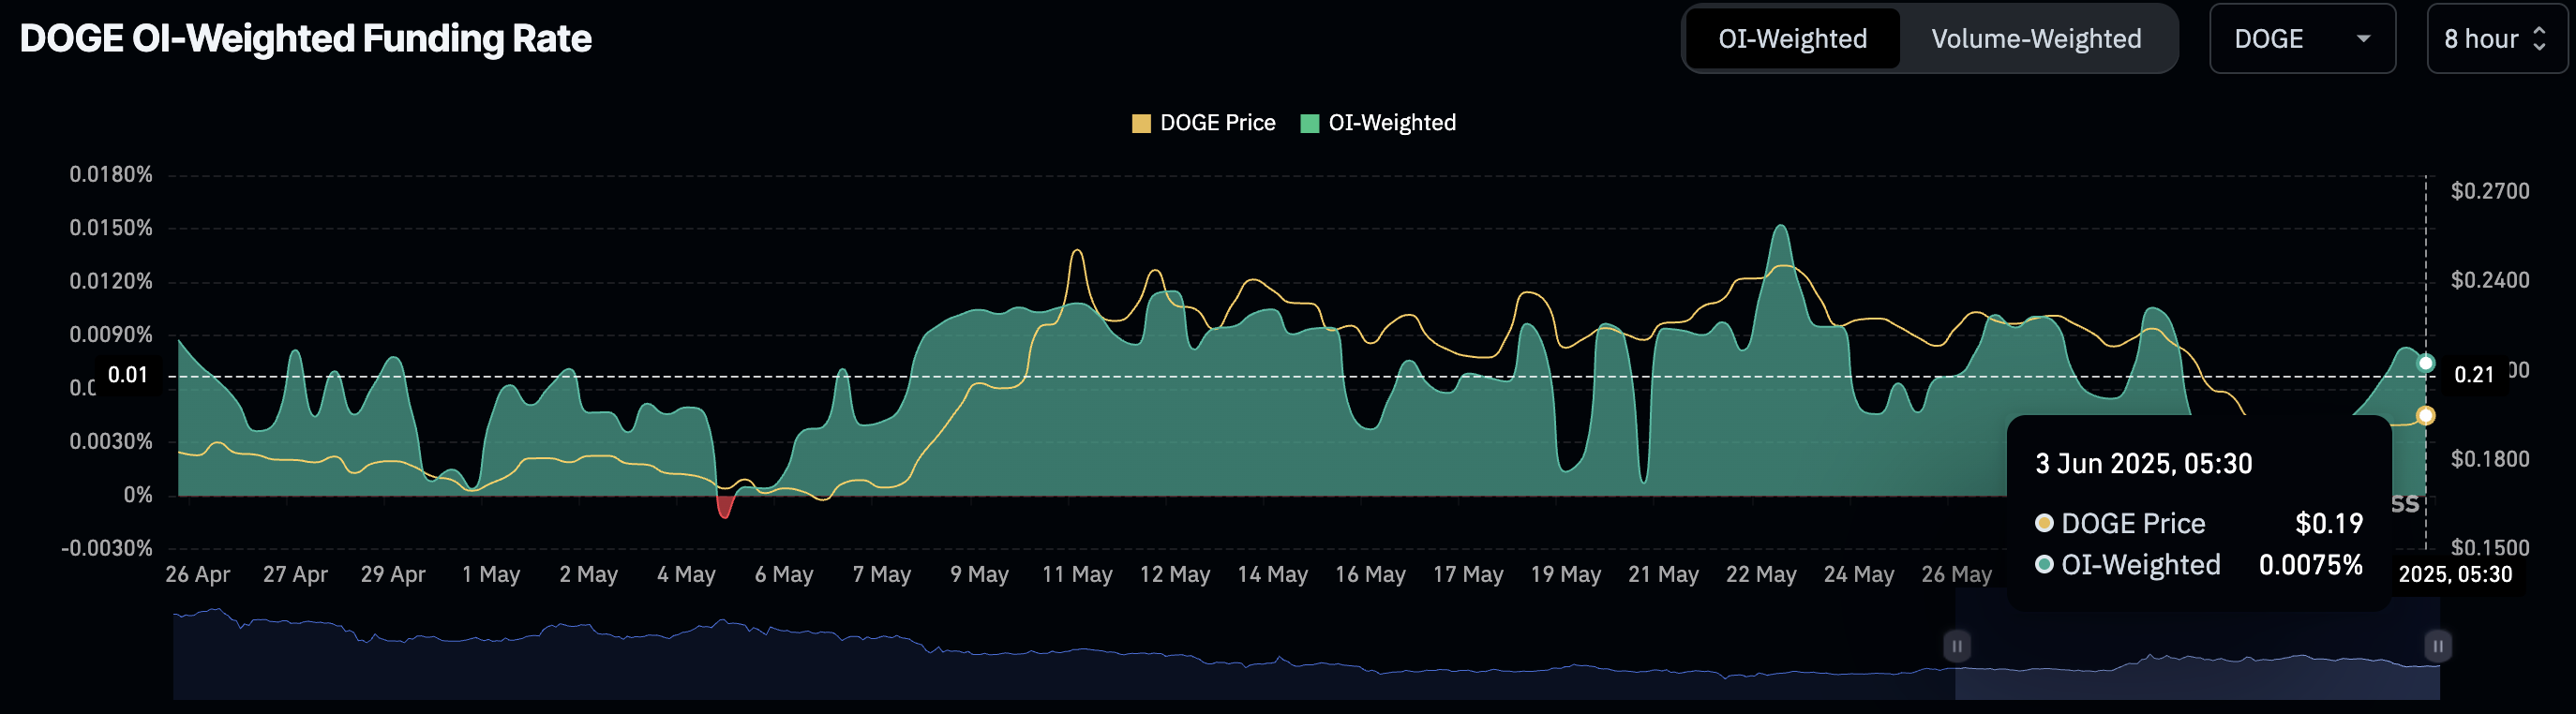
DOGE OI-Weighted Funding Rate. Source: Coinglass
Finally, the long/short ratio chart readings at 1.06 indicate an increased bullish sentiment, as more traders anticipate a price surge. The indicator is based on taker buy/sell volume, with the taker buy volume accounting for 51.53% in the last four hours.
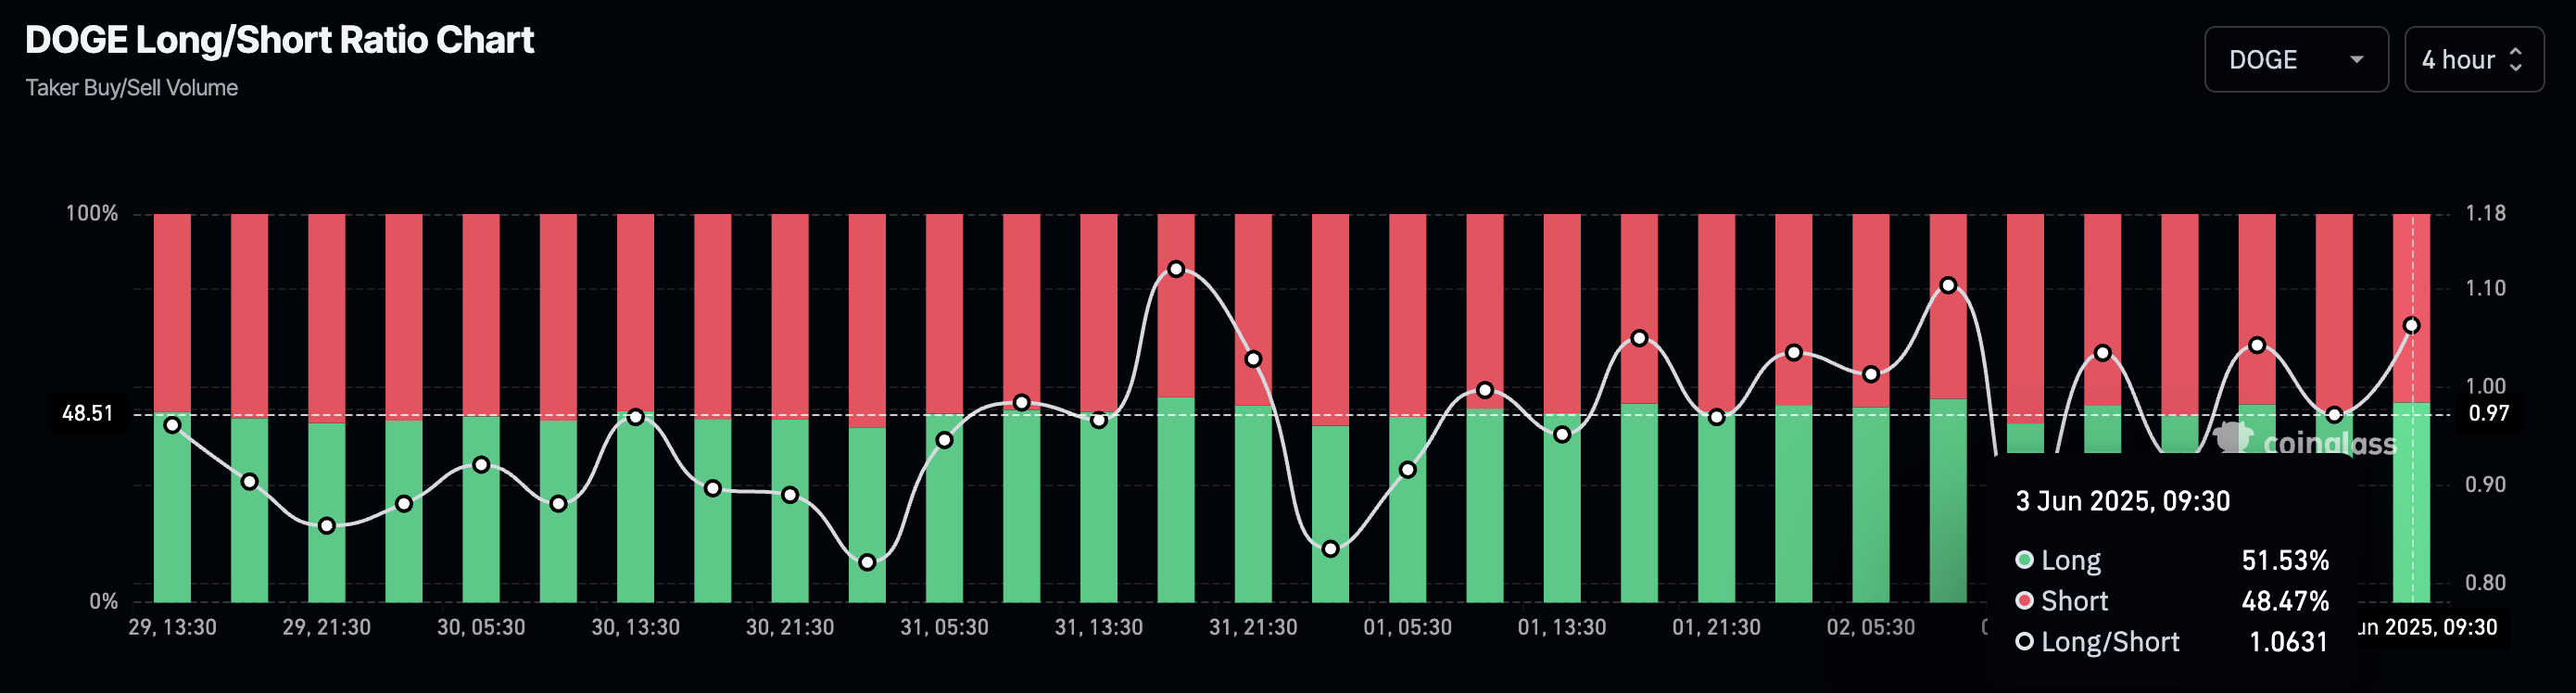
DOGE Long/Short Ratio Chart. Source: Coinglass
Dogecoin’s breakout faces multiple hurdles
Dogecoin trades at $0.1959 at press time on Tuesday, breaking above a short-term range formed between $0.1863 and $0.1950 after last week’s 14% fall. The meme coin records mild intraday gains and a candle closing above the range’s upper boundary.
With the bullish breakout, the technical indicators are heating up. The Moving Average Convergence/Divergence (MACD) indicator crosses above its signal line in the negative territory. The average lines rise towards the center line, reflecting a growth in bullish momentum.
Further up, the Relative Strength Index (RSI) at 47 shows a sharp recovery from the oversold zone, suggesting a significant decline in bearish momentum. As the RSI remains under the halfway level, it shows extended room for growth before reaching overbought conditions.
The range breakout signals a price surge to the next resistance level at $0.2145. However, the 200-period Exponential Moving Average (EMA) at $0.2074 acts as an intermediary hurdle.
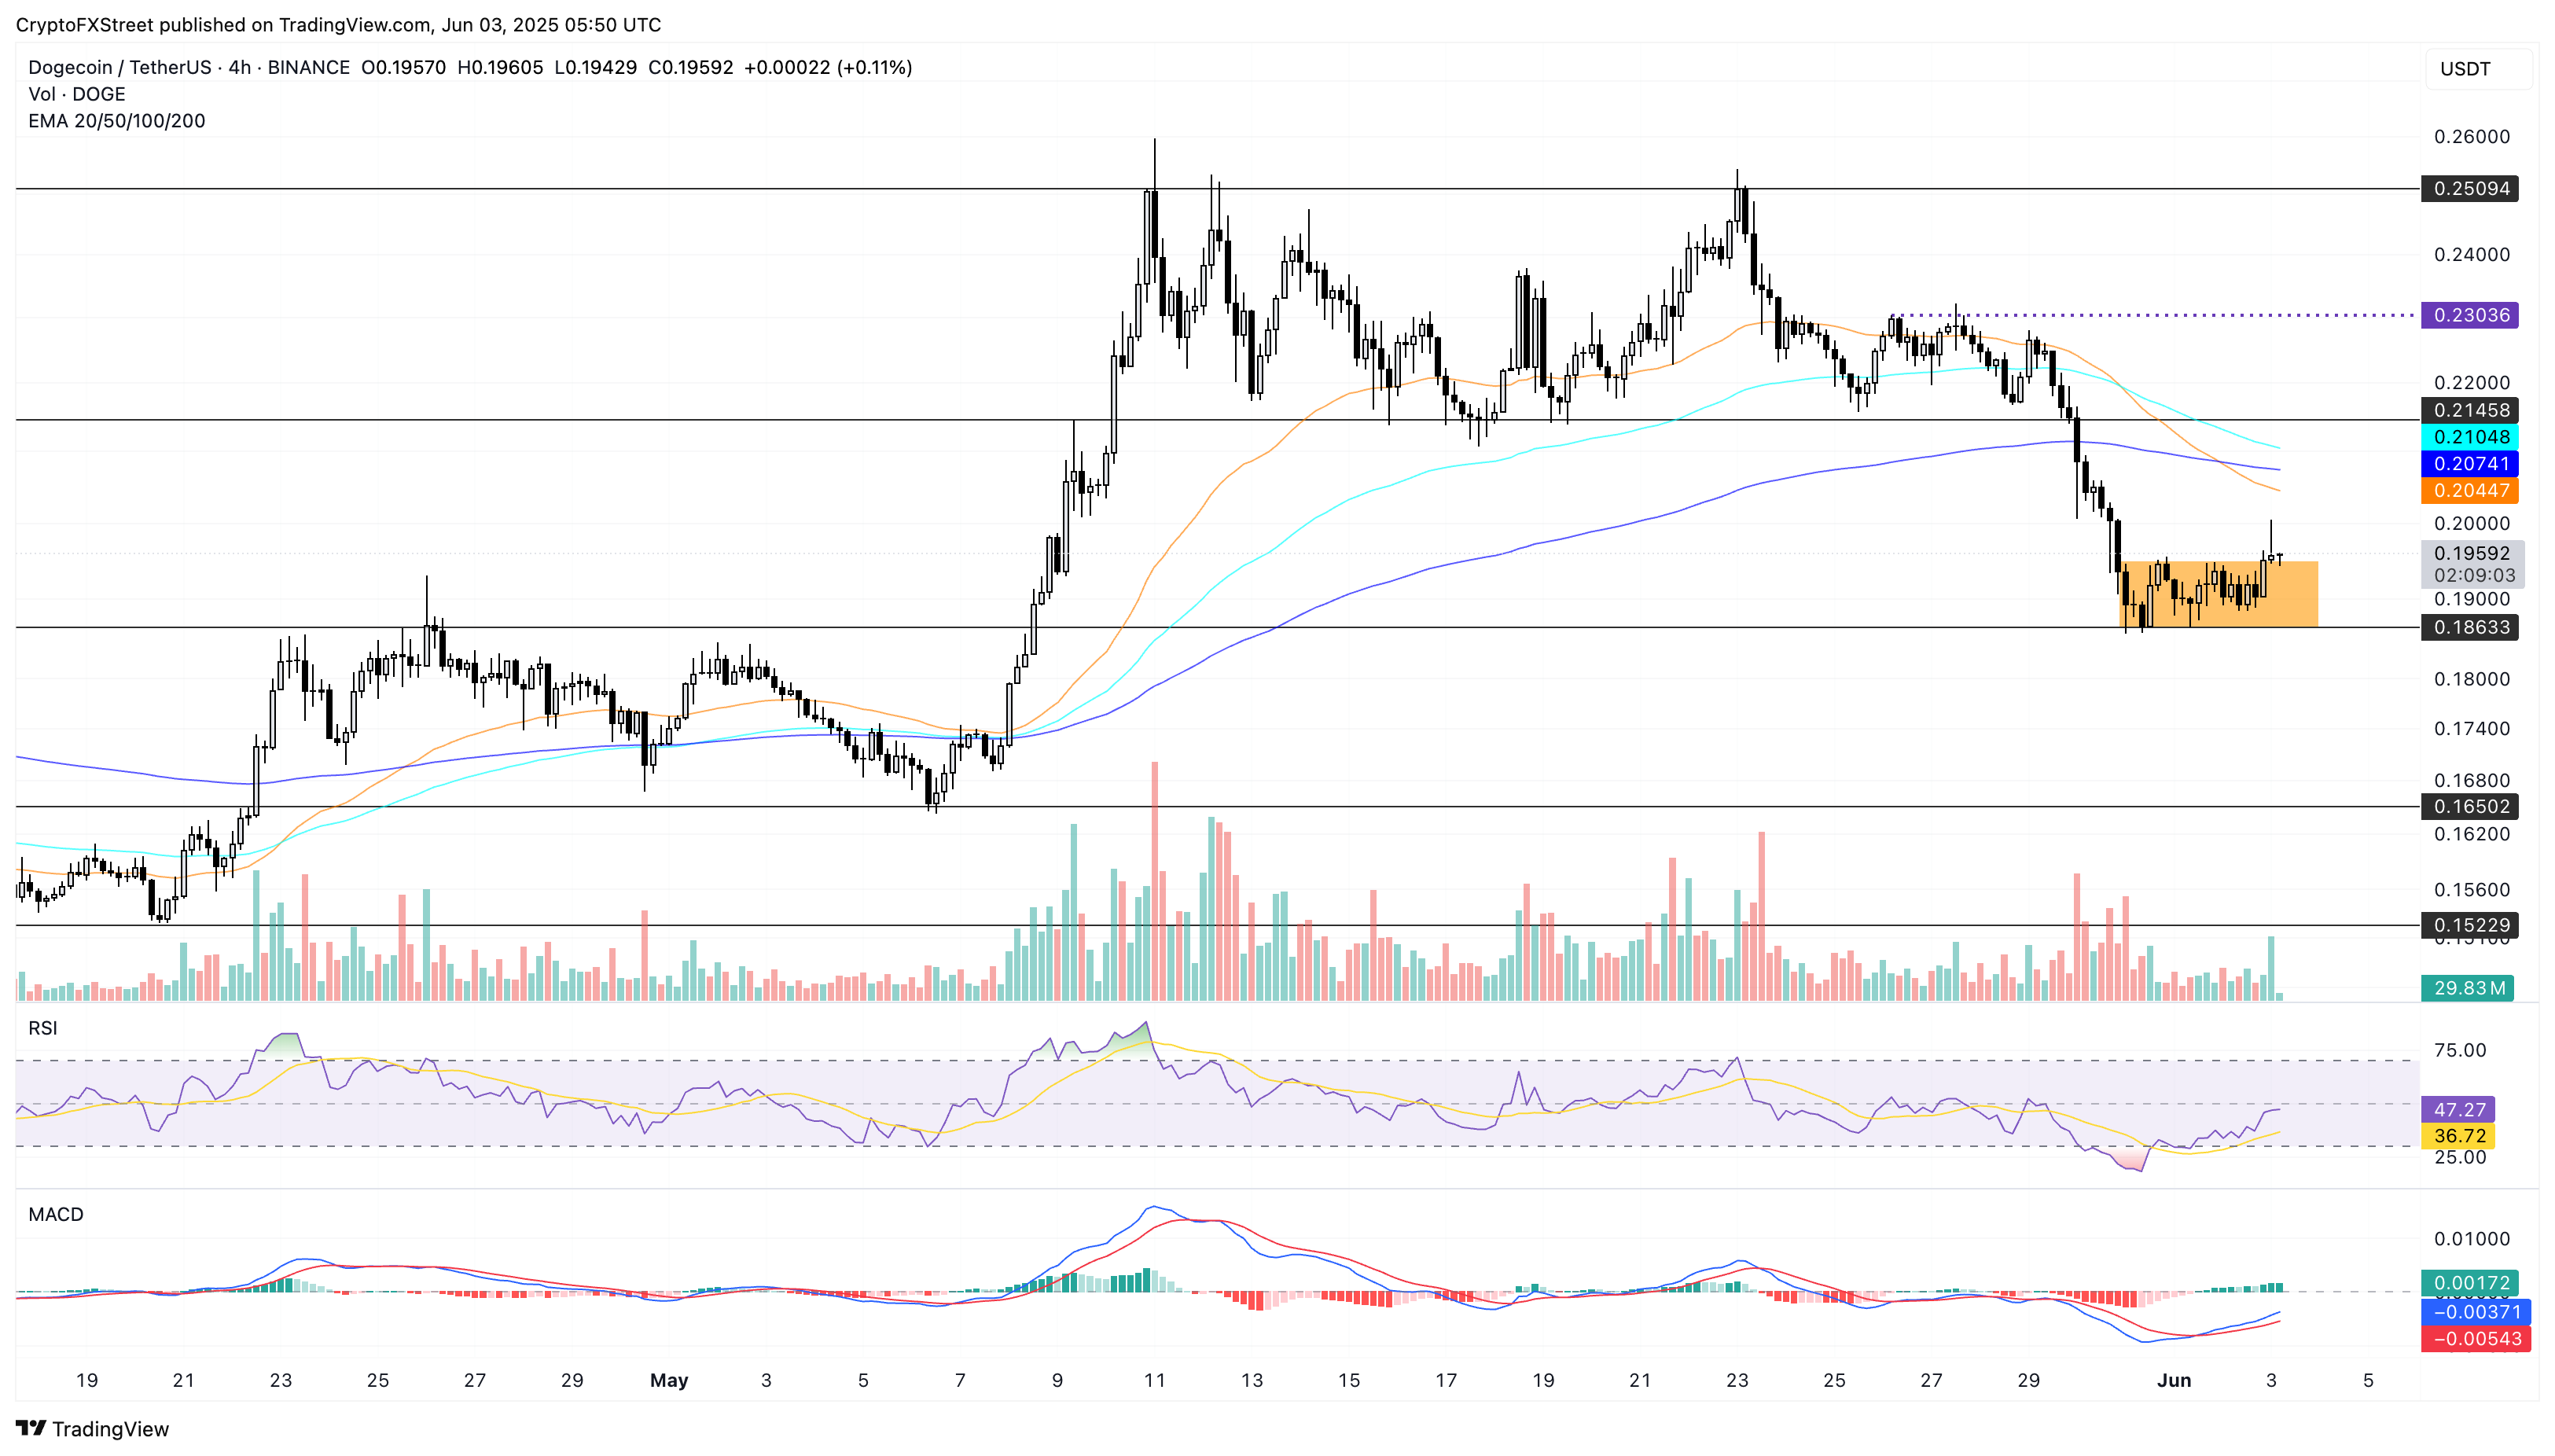
DOGE/USDT 4-hour price chart. Source: Tradingview
However, a reversal in DOGE could retest the $0.1863 support level. In such a case, traders could find shorting opportunities if it closes below the level, with the next support at $0.1650.
