DEXE, SPX, XAUt Defy Market Chaos as Altcoins Stumble Over US-China Trade Gridlock

While the rest of crypto wobbles like a freshman after last call, these three tokens are mooning against the tide. Trade deal drama? They don’t care.
Altcoins Faceplant on Macro Headlines
The usual suspects—Bitcoin, Ethereum, and every meme coin with a dog mascot—took a nosedive as US-China negotiations hit a wall. Classic ‘risk-off’ behavior. Meanwhile, DEXE’s governance play, SPX’s synthetic assets, and XAUt’s gold-backed stability are laughing all the way to the ledger.
Cynical Finance Jab
Wall Street’s still trying to short crypto between golf sessions. How’s that working out, guys?
DEXE shines bright green as the market turns red
The DEXE (DEXE) trades at $14.09 at press time after a 13.07% surge on Thursday, creating a bullish engulfing candle. The sudden surge comes amid the ongoing DeXe MemeMania, a meme coin contest that is set to conclude on May 30.
DEXE surge is close to flipping the Supertrend indicator line to green, reinstating a bullish trend. Additionally, the Moving Average Convergence/Divergence (MACD) and its signal line trigger a buy signal with the recent positive crossover and a fresh wave of green histogram bars.
The bullish engulfing candle exceeds a long-standing trendline starting from February 25, resulting in multiple lower highs. The breakout rally could face immediate resistance at the $15.46 peak (May 7), followed by $18.43 (April 1).
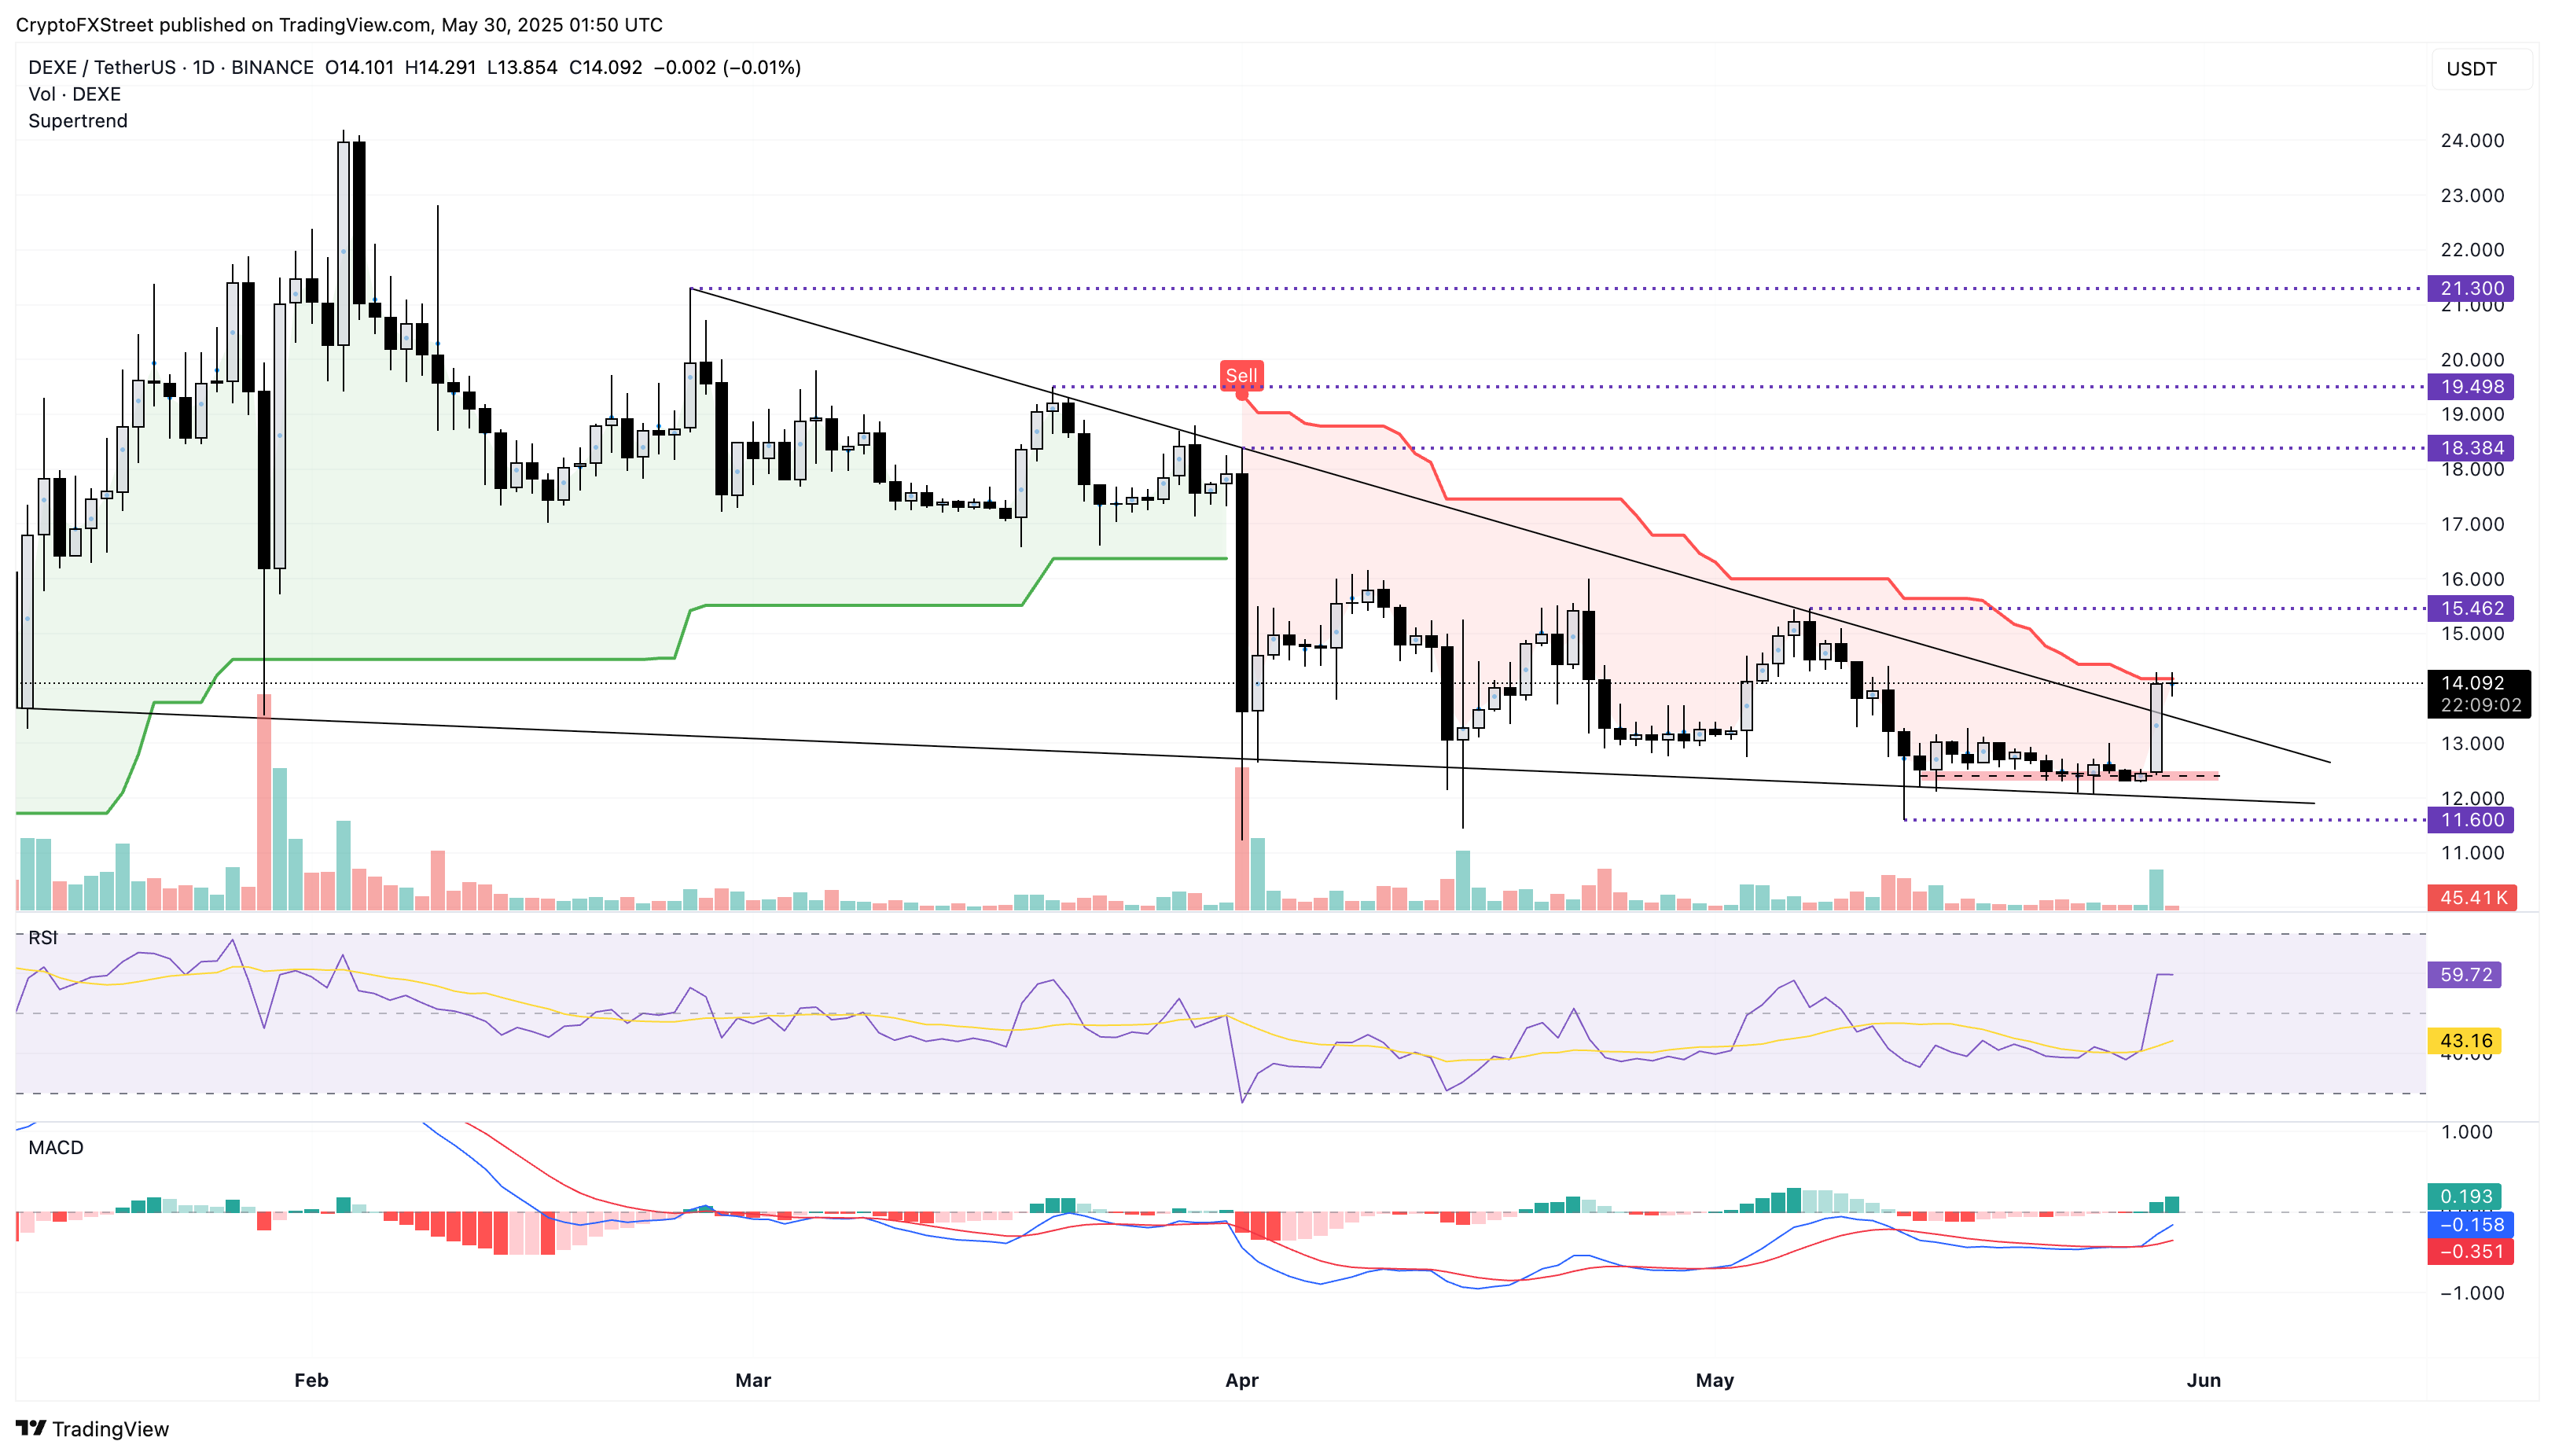
DEXE/USDT daily price chart. Source: Tradingview
On the flip side, a reversal from $14, failing to reinstate the uptrend, could retest the declining trendline NEAR $13.50, followed by a support zone at $12.51.
SPX meme coin nears key resistance
SPX6900 (SPX) holds the 23% weekly gains so far as it trades at $1.11 at press time. The SPX rally breaks above the $1 psychological resistance, the 50- and 200-day Exponential Moving Averages (EMAs) hint at a golden cross, a buy signal, as short-term trend gains momentum.
Based on the Fibonacci retracement extending between January 17 and March 11 from $1.53 to $0.29, the halfway level (50%) is at $0.91. As the uptrend scales towards the 78.6% Fibonacci level at $1.26, a profit booking drive could result in a pullback. A reversal in SPX could retest the 50% Fibonacci level at $0.91.
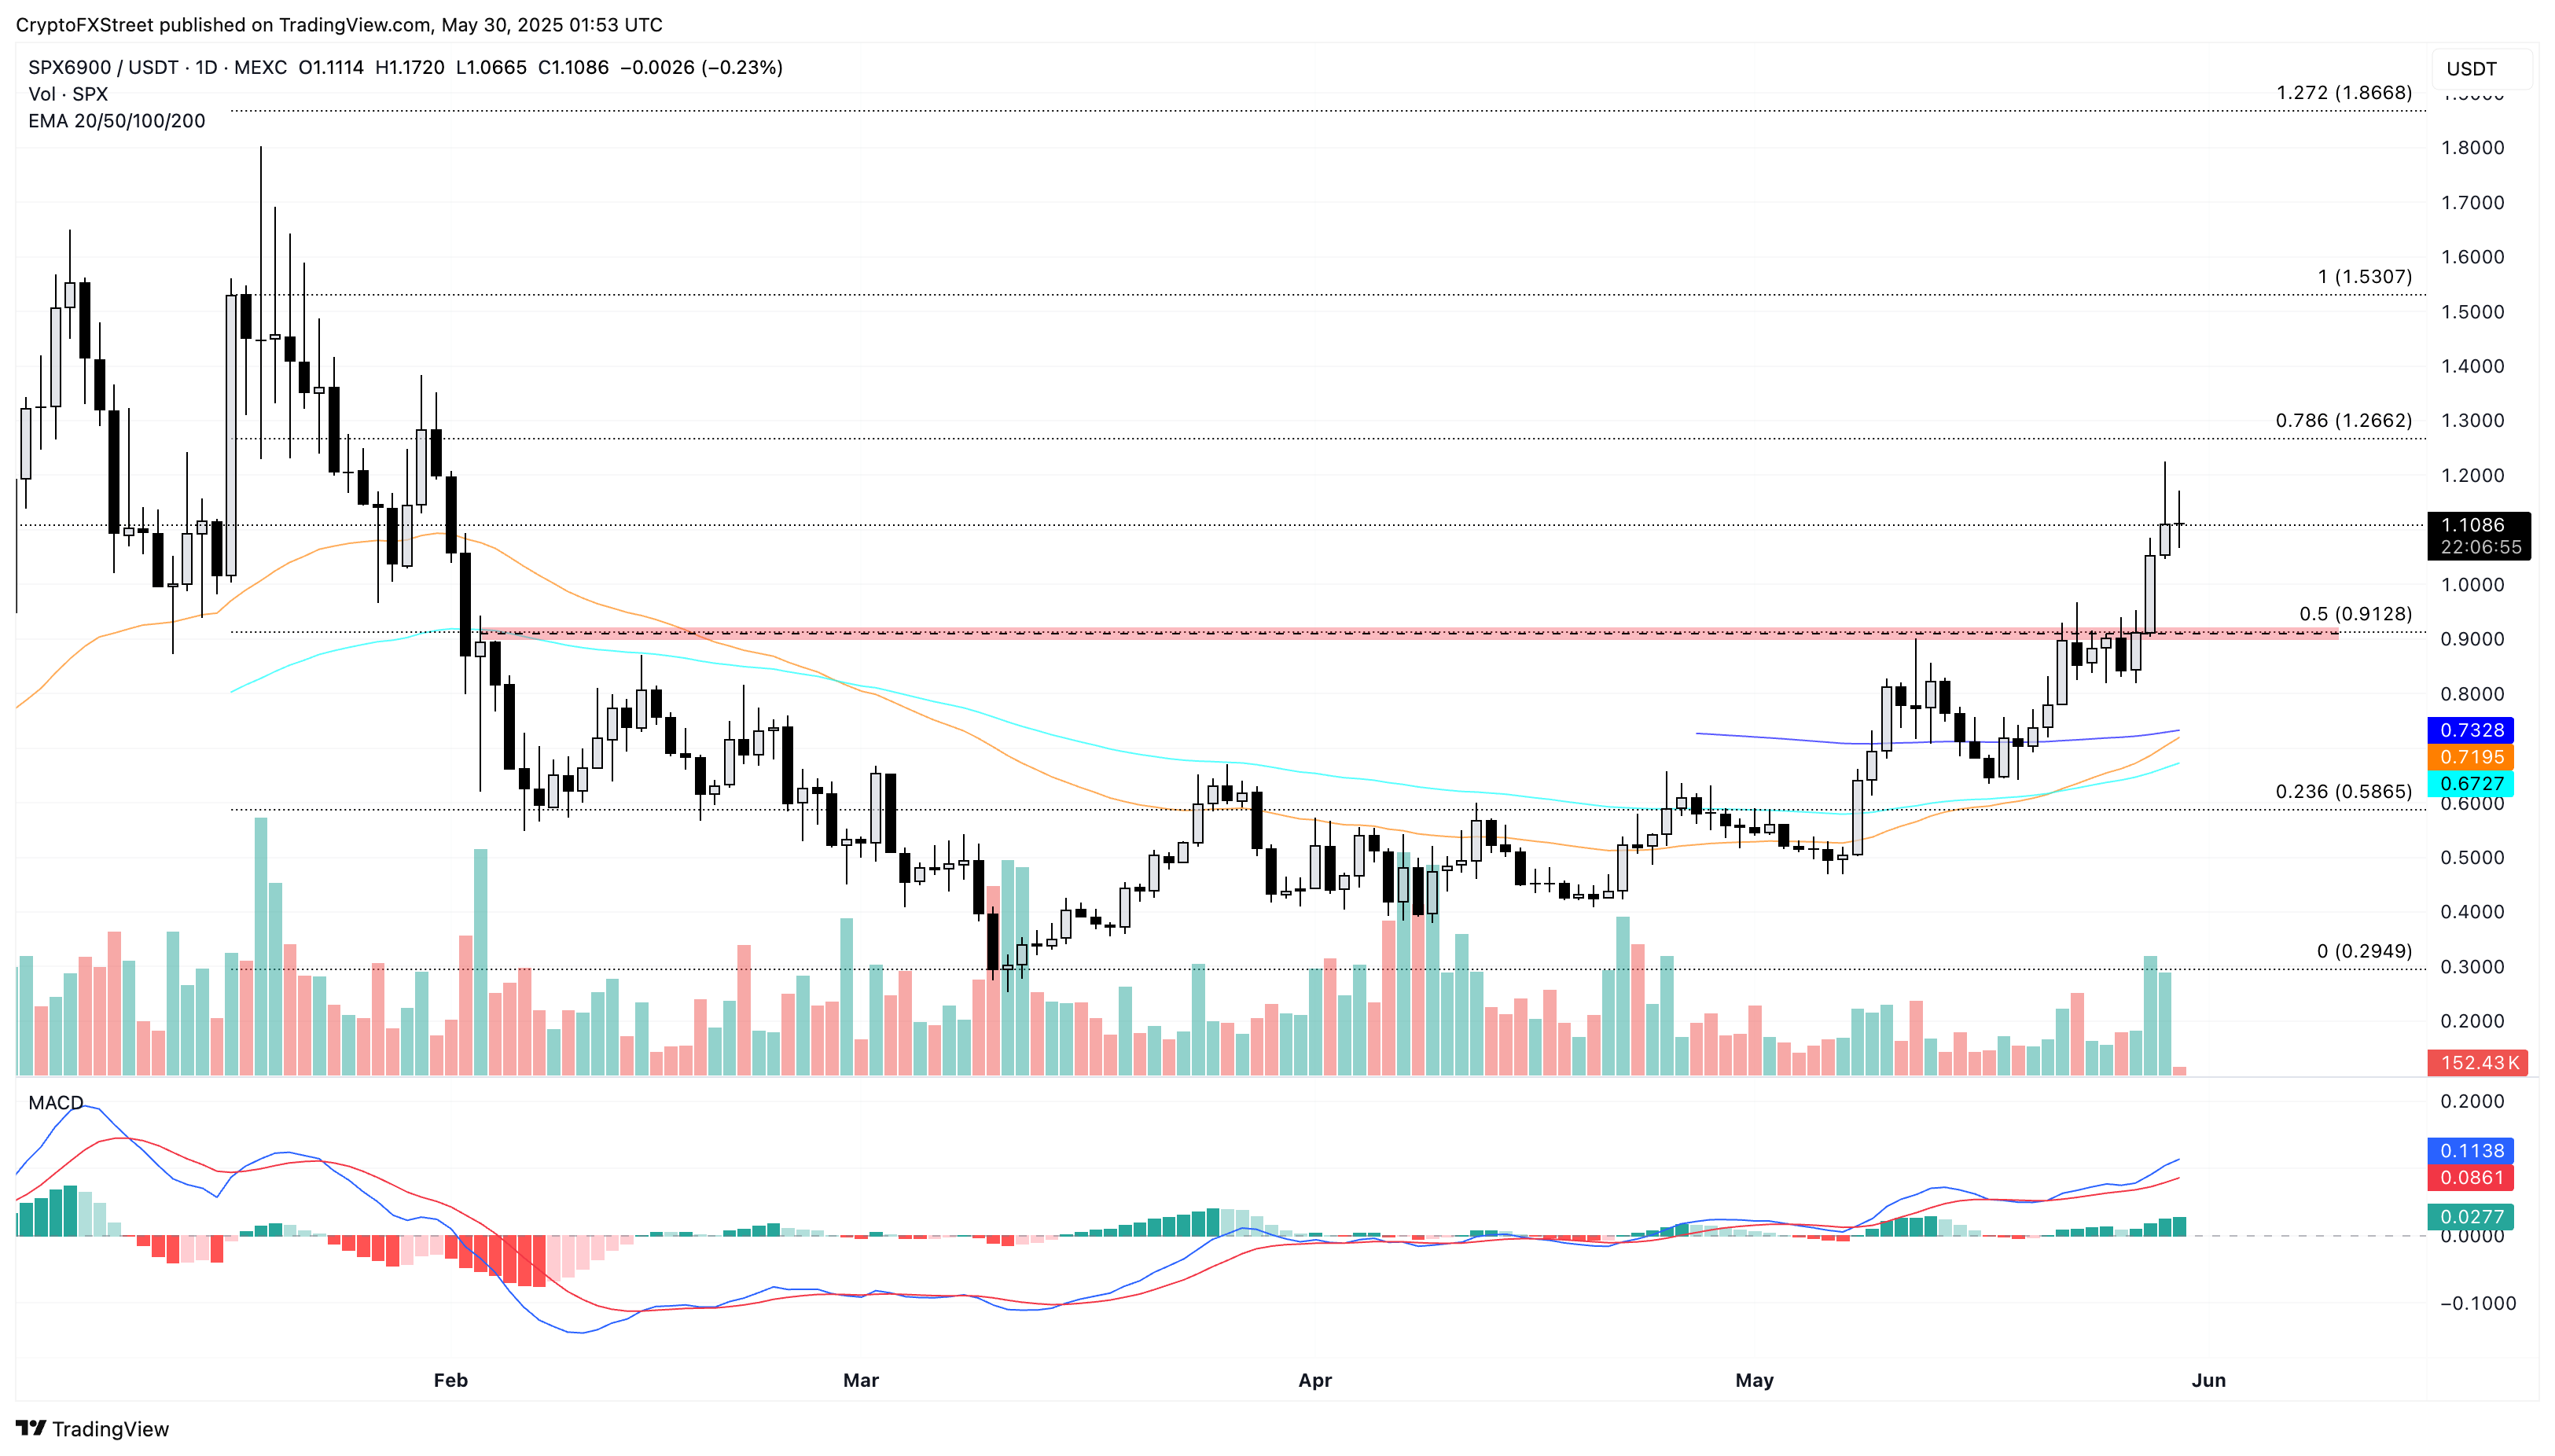
SPX/USDT daily price chart. Source: Tradingview
A breakout above $1.26 could test the January 17 peak at $1.53.
Tether gold rises amid uncertainty
Gold, a commodity historically known to surge amid global market instability, leads the crypto market gains in the form of Tether’s gold stablecoin, XAUt. It tracks the price of one troy ounce of gold on a 1:1 basis.
Amid tariff uncertainty, XAUt trades at $3,310 at press time after a 1.36% surge on Thursday. However, the stablecoin forms lower highs on April 22, May 7, and May 25, creating a local resistance trendline as it faces headwinds. The recent surge sprouts from a long-standing support trendline with bottoms on April 9, May 15, and May 29.
The converging trendlines FORM a triangle pattern on the daily chart shared below. XAUt is on the brink of a high momentum as the price action nears the triangle’s apex. A bullish breakout could test the April 21 peak at $3,462.
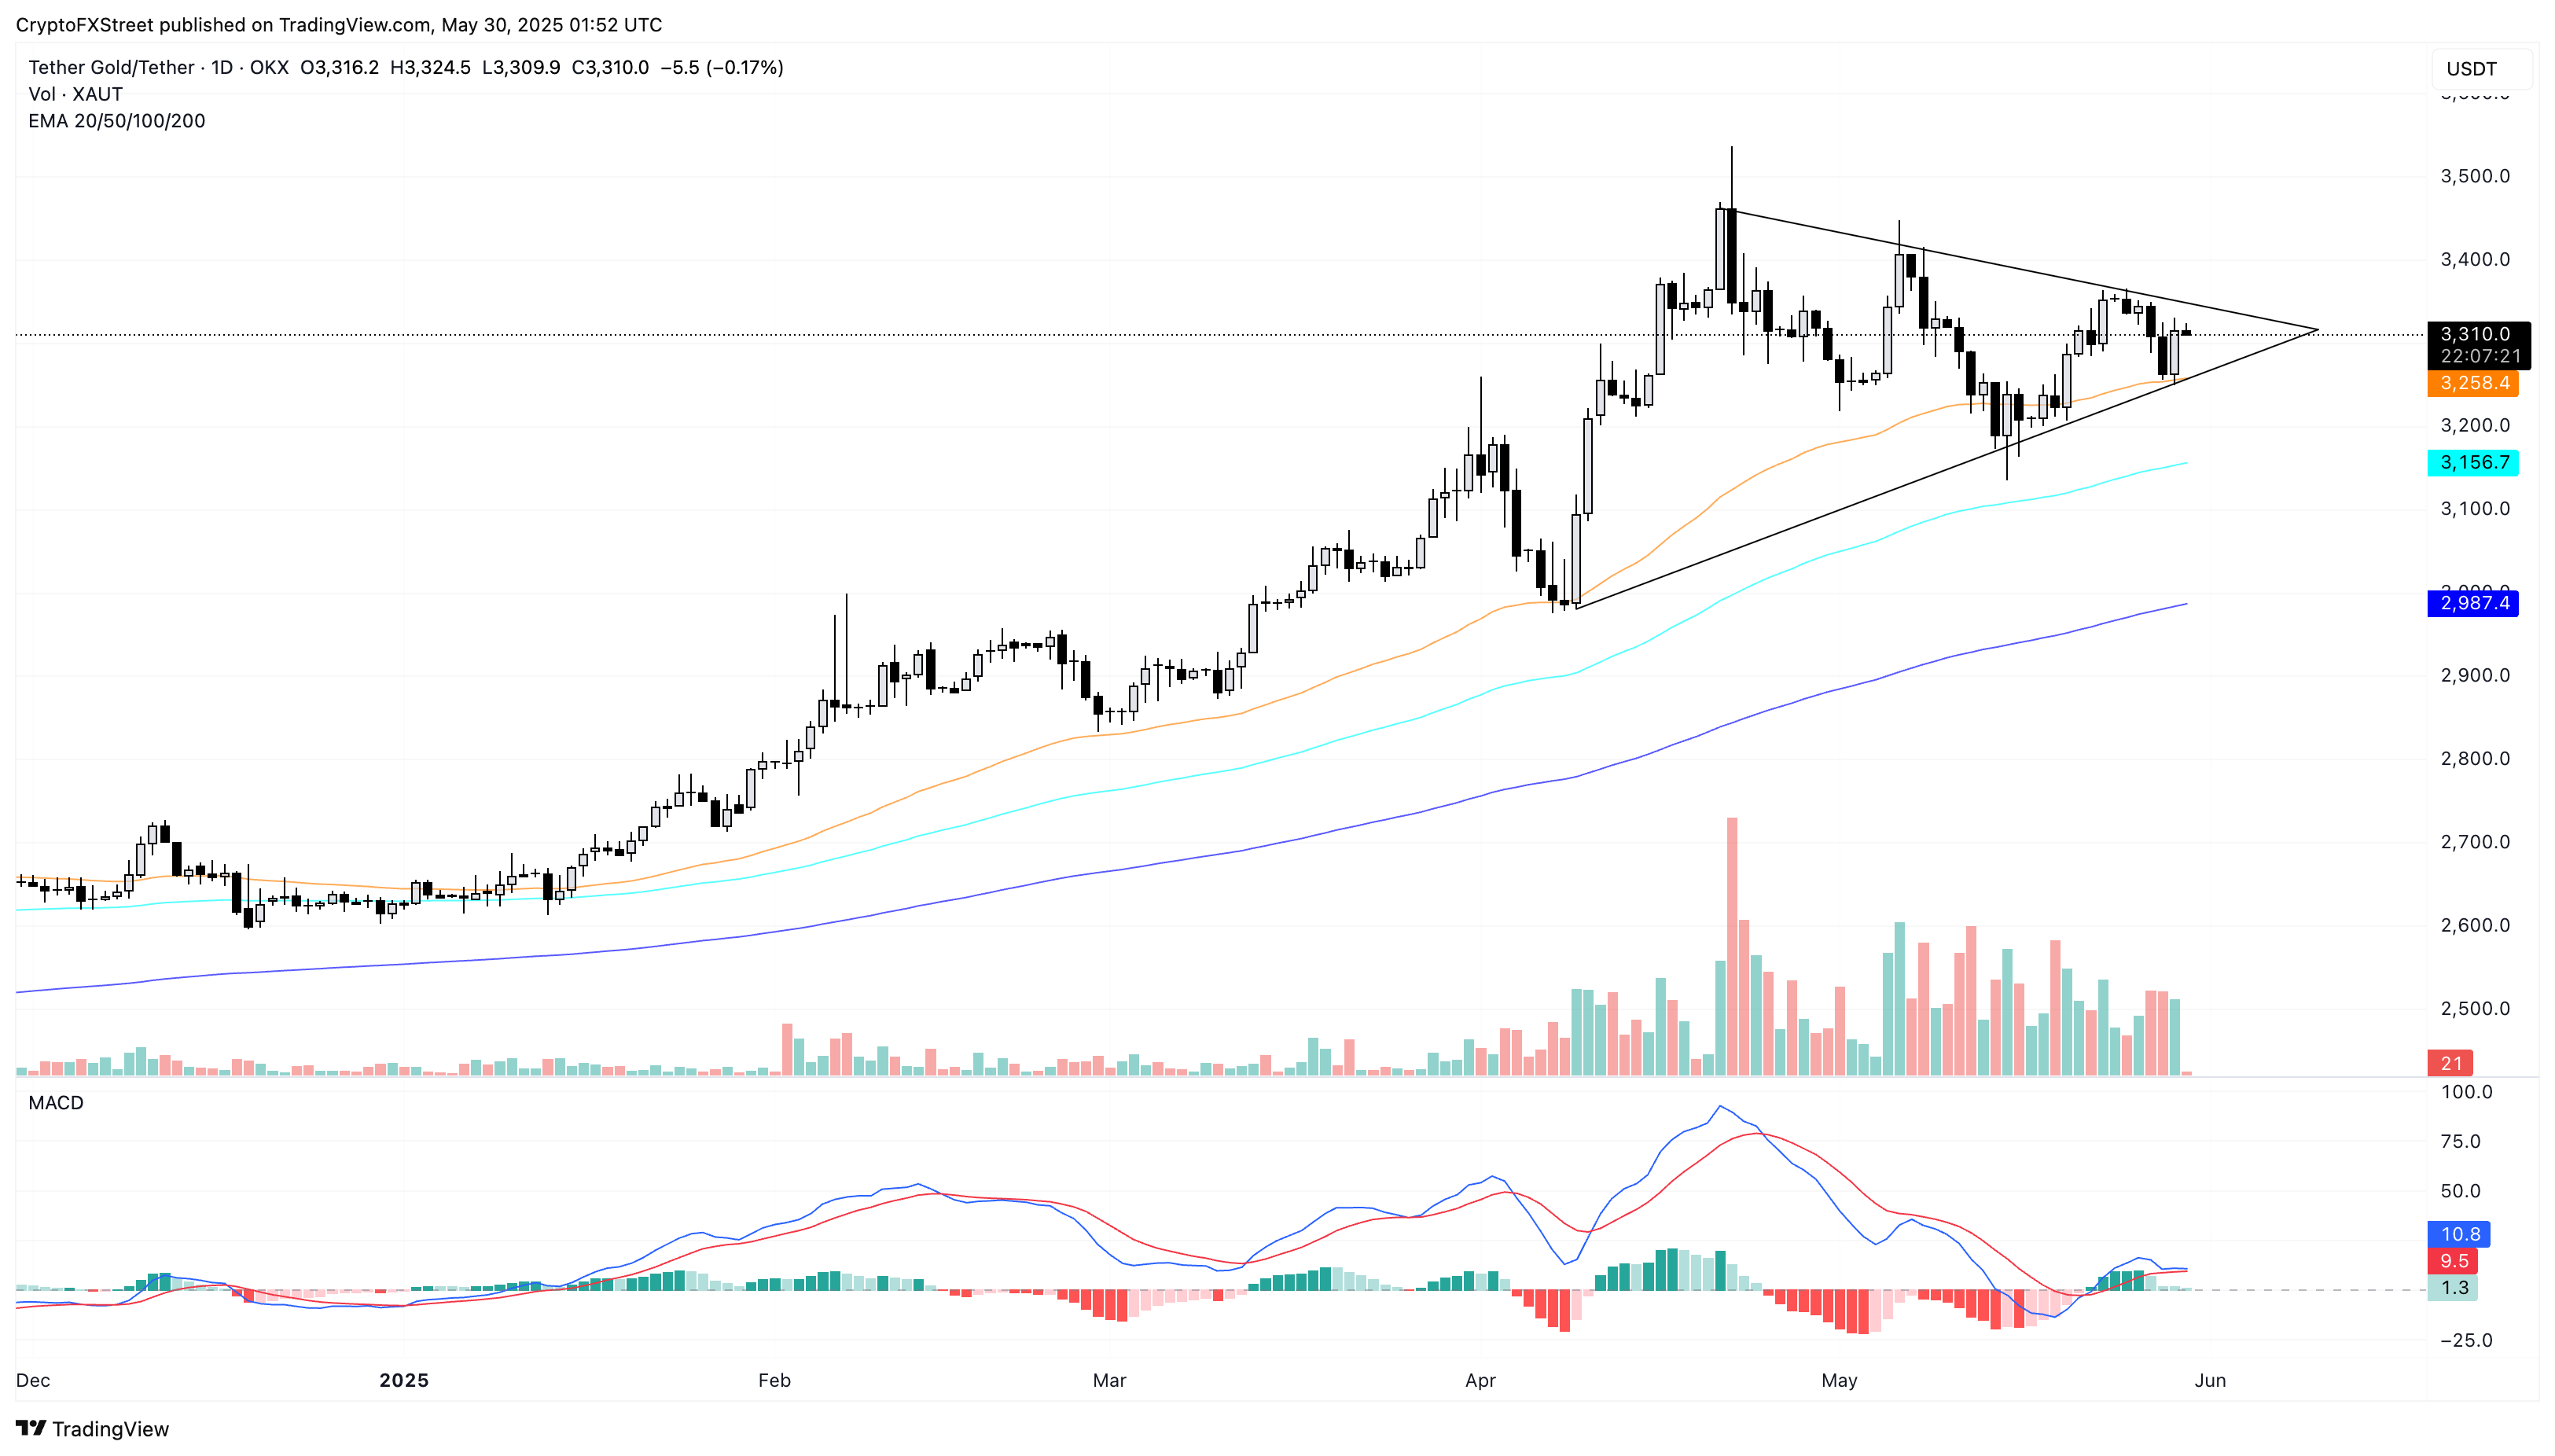
XAUt/USDT daily price chart. Source: Tradingview
On the flip side, the 50-day EMA near the support trendline at $3,258 is a crucial support. However, a breakdown of the triangle could cause the Tether Gold Price to decline to the May 15 opening price of $3,182.

Log in to Reply
Log in to comment your thoughtsComments
Related Articles
|Square
Get the BTCC app to start your crypto journey
Get started today Scan to join our 100M+ users