Cardano Teeters on Triangle Breakout as ADA ETF Decision Nears

Cardano’s price coils in a tightening pattern—technical traders brace for a volatility surge as the SEC’s ETF deadline looms. Will ADA break north or get crushed under regulatory déjà vu?
Symmetrical triangle patterns rarely age gracefully in crypto. With the ETF verdict days away, ADA bulls and bears are locked in a staring contest—one wrong move could trigger a 20%+ swing. Meanwhile, Wall Street’s ’innovation’ machine spins up another product it’ll abandon in 18 months.
Grayscale’s Cardano ETF approval deadline on Thursday
According to the last SEC release on March 11, the deadline for the Grayscale ADA ETF was extended by 45 days, shifting the deadline to May 29 from April 14. As the deadline approaches, ADA becomes increasingly volatile as anticipation builds.
However, the possibility of an extended deadline increases as the SEC recently delayed the Chicago Board Options Exchange (Cboe) request to list and trade Fidelity solana Fund shares by 45 days.
ADA risks triangle breakdown amid bearish pressure surge
Cardano is up over 9% in May, with a volatile price action forming a triangle pattern on the daily chart. Lower highs on March 3, May 12, and May 23 FORM a declining trendline alongside the lows on April 9, May 6, and May 25, creating a support trendline that completes the triangle pattern. The ADA approaches the apex of the pattern with growing consolidation, hinting at a quick conclusion.
The 50-, 100-, and 200-day Exponential Moving Averages (EMAs) trend NEAR the support trendline, increasing the chances of absorbing incoming supply spikes. Notably, a golden cross between the 50- and 200-day EMAs signals bullish reversal chances.
The Moving Average Convergence/Divergence (MACD) indicator maintains a declining trend with its signal line, approaching the center line, suggesting fading bullish momentum. The Relative Strength Index (RSI) is at 50, pointing downside and also suggesting a loss of bullish momentum, which supports the bearish conclusion chances.
For a conclusive breakdown, the price must close below the 200-day EMA at $0.72, which could extend the decline to $0.64, a support formed on May 6.
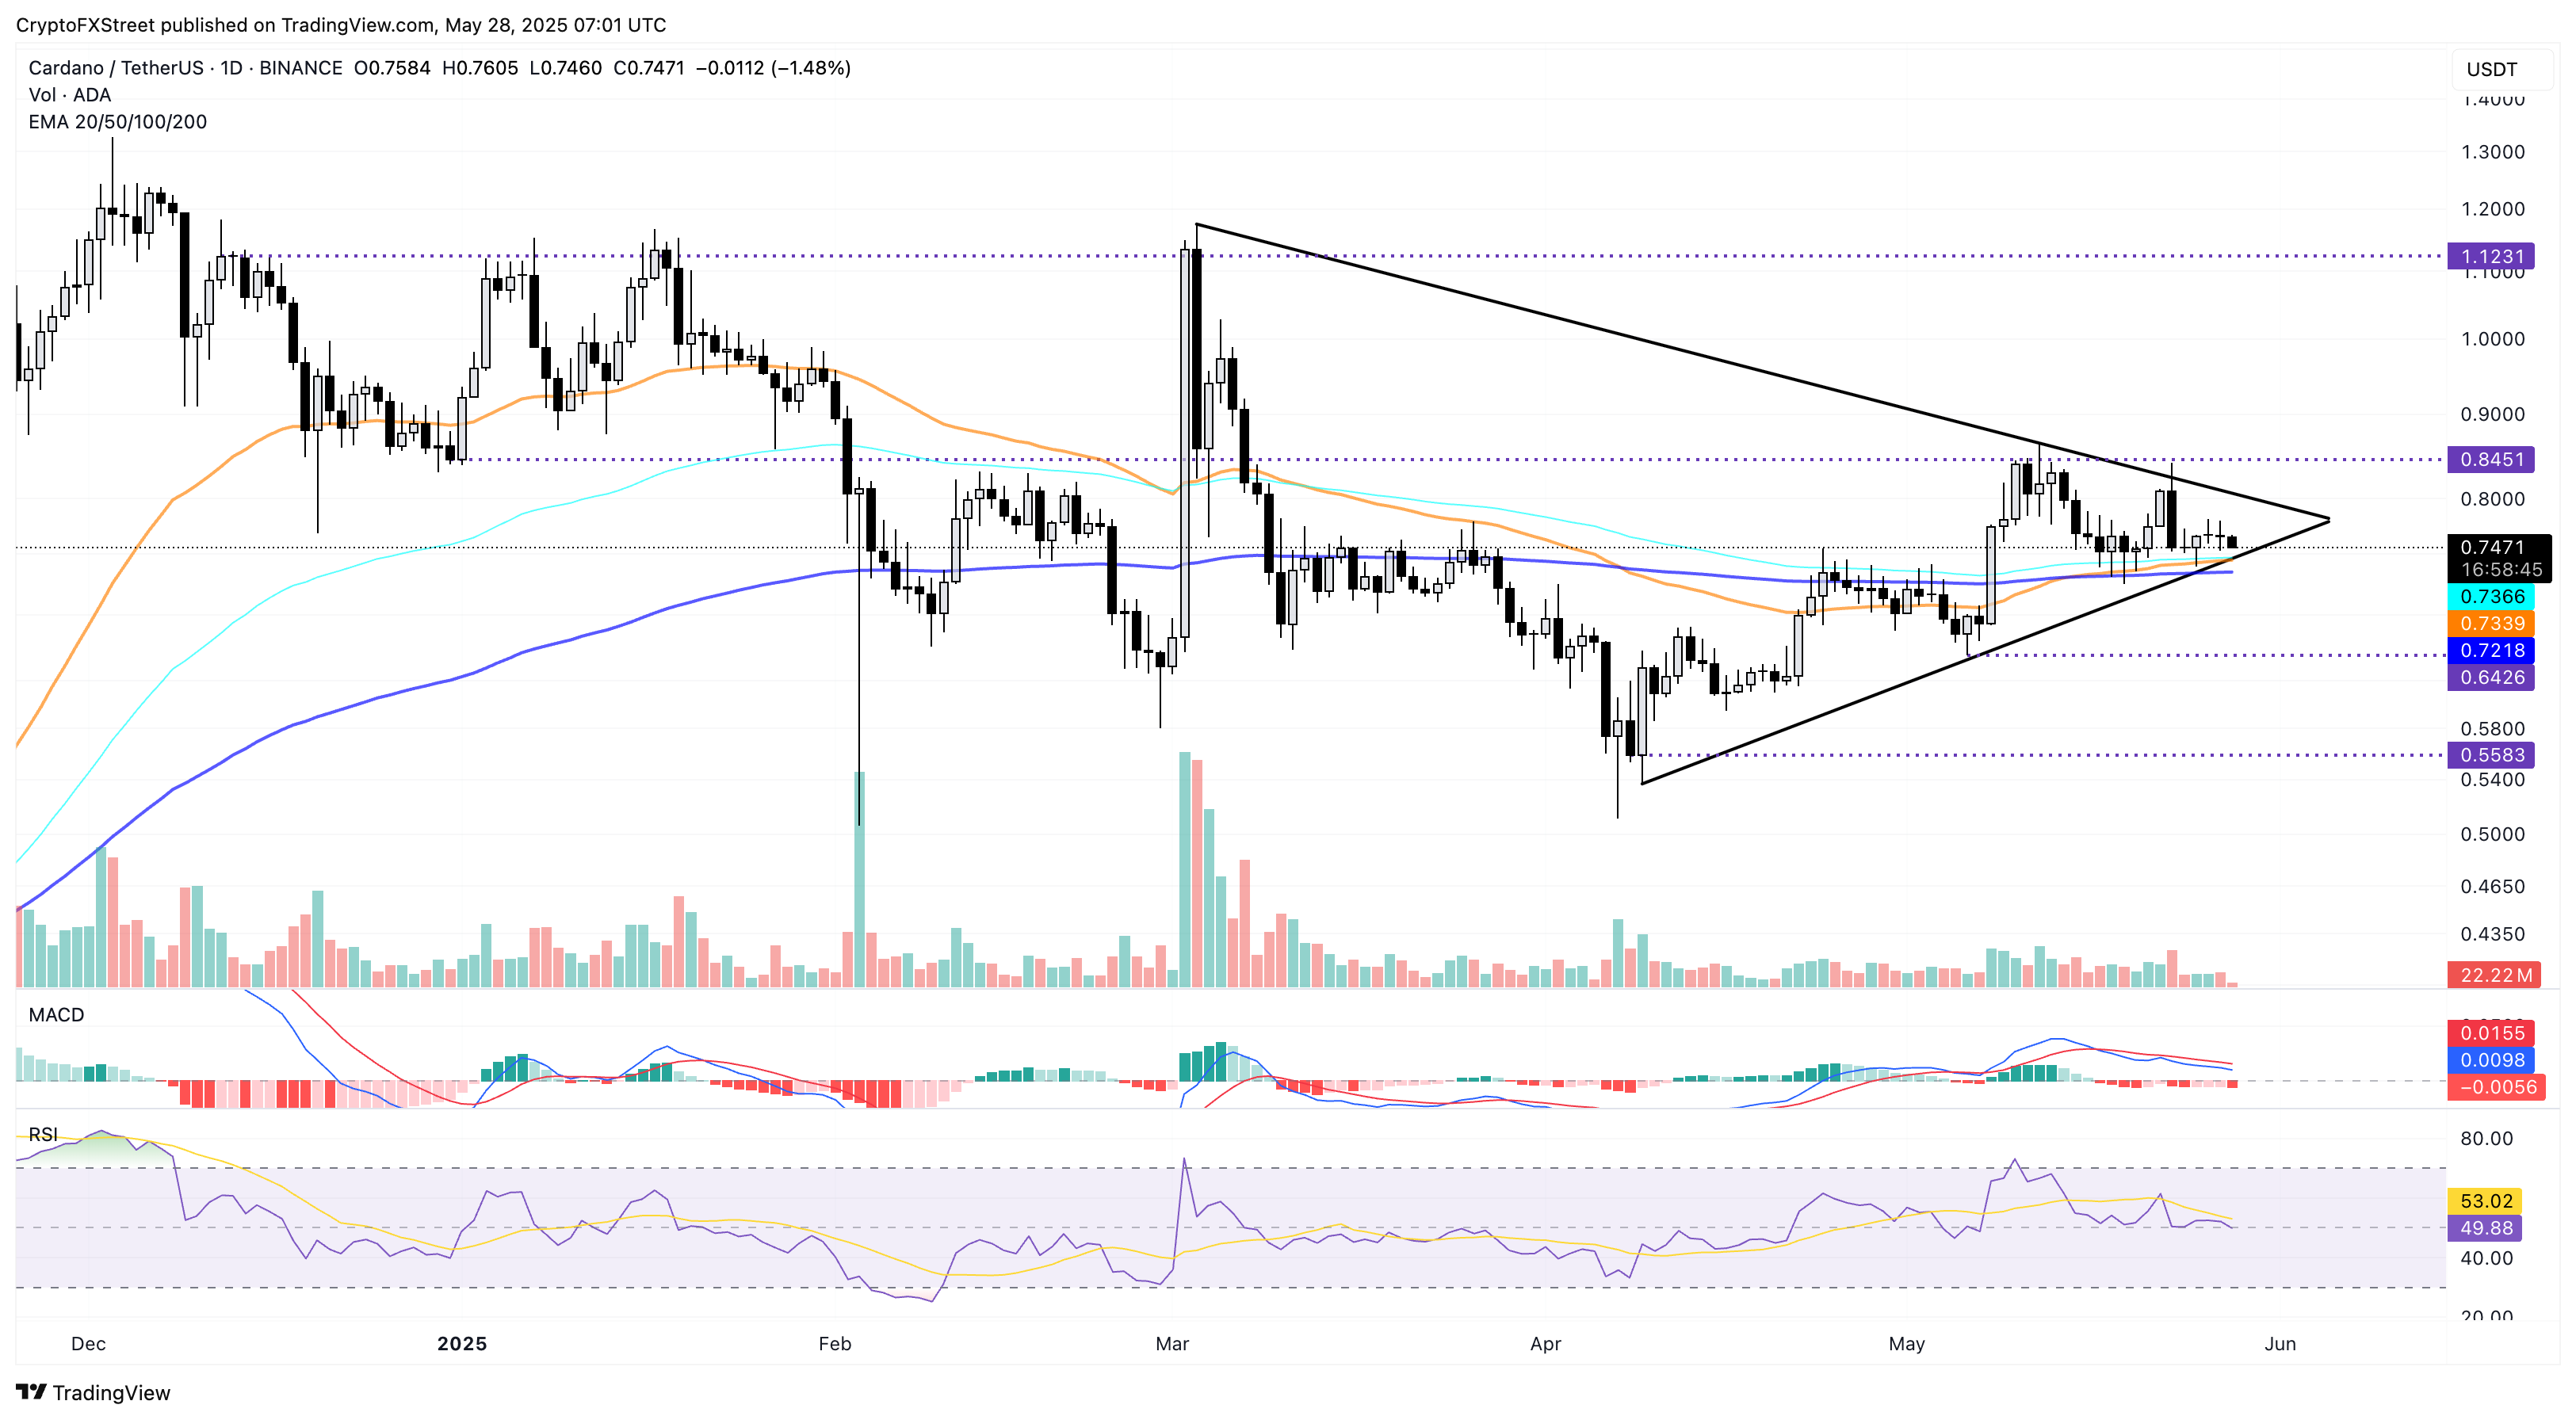
ADA/USDT daily price chart. Source: Tradingview
In case of a bullish conclusion with a closing above the $0.84 resistance level, ADA could hit $1.12, a long-standing resistance level since December 12.
ADA derivatives are low on optimism
As cardano hits a dire crossroads, ADA traders’ ambitions in the derivatives market face a huge impact. According to Coinglass, the ADA Open Interest (OI) has surged by over 4% to reach $945 million, indicating a capital inflow in Cardano derivatives.
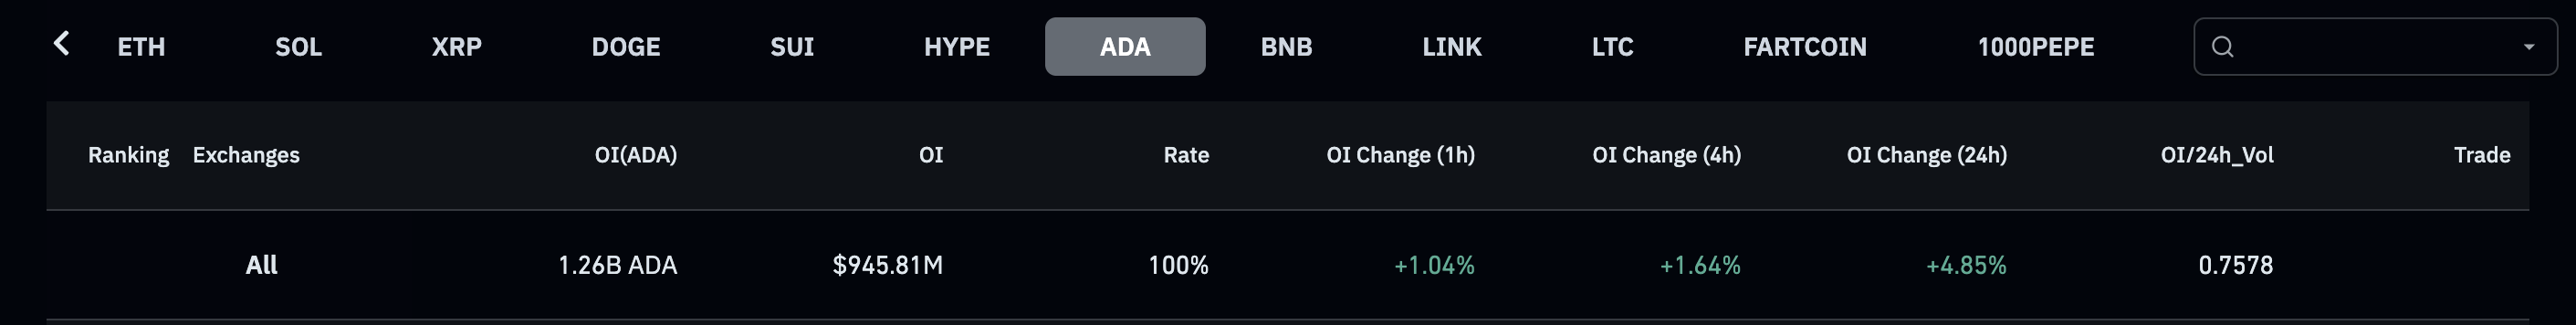
Cardano OI. Source: Coinglass
However, the OI-weighted funding rate diverges from the OI trend, falling to 0.0013% from 0.0081% in a single day. This reflects a significant decline in bullish trading activity as rates decrease, with less pressure to balance the contract price with the spot price, suggesting a loss in Optimism and an increased risk of triangle breakdown.
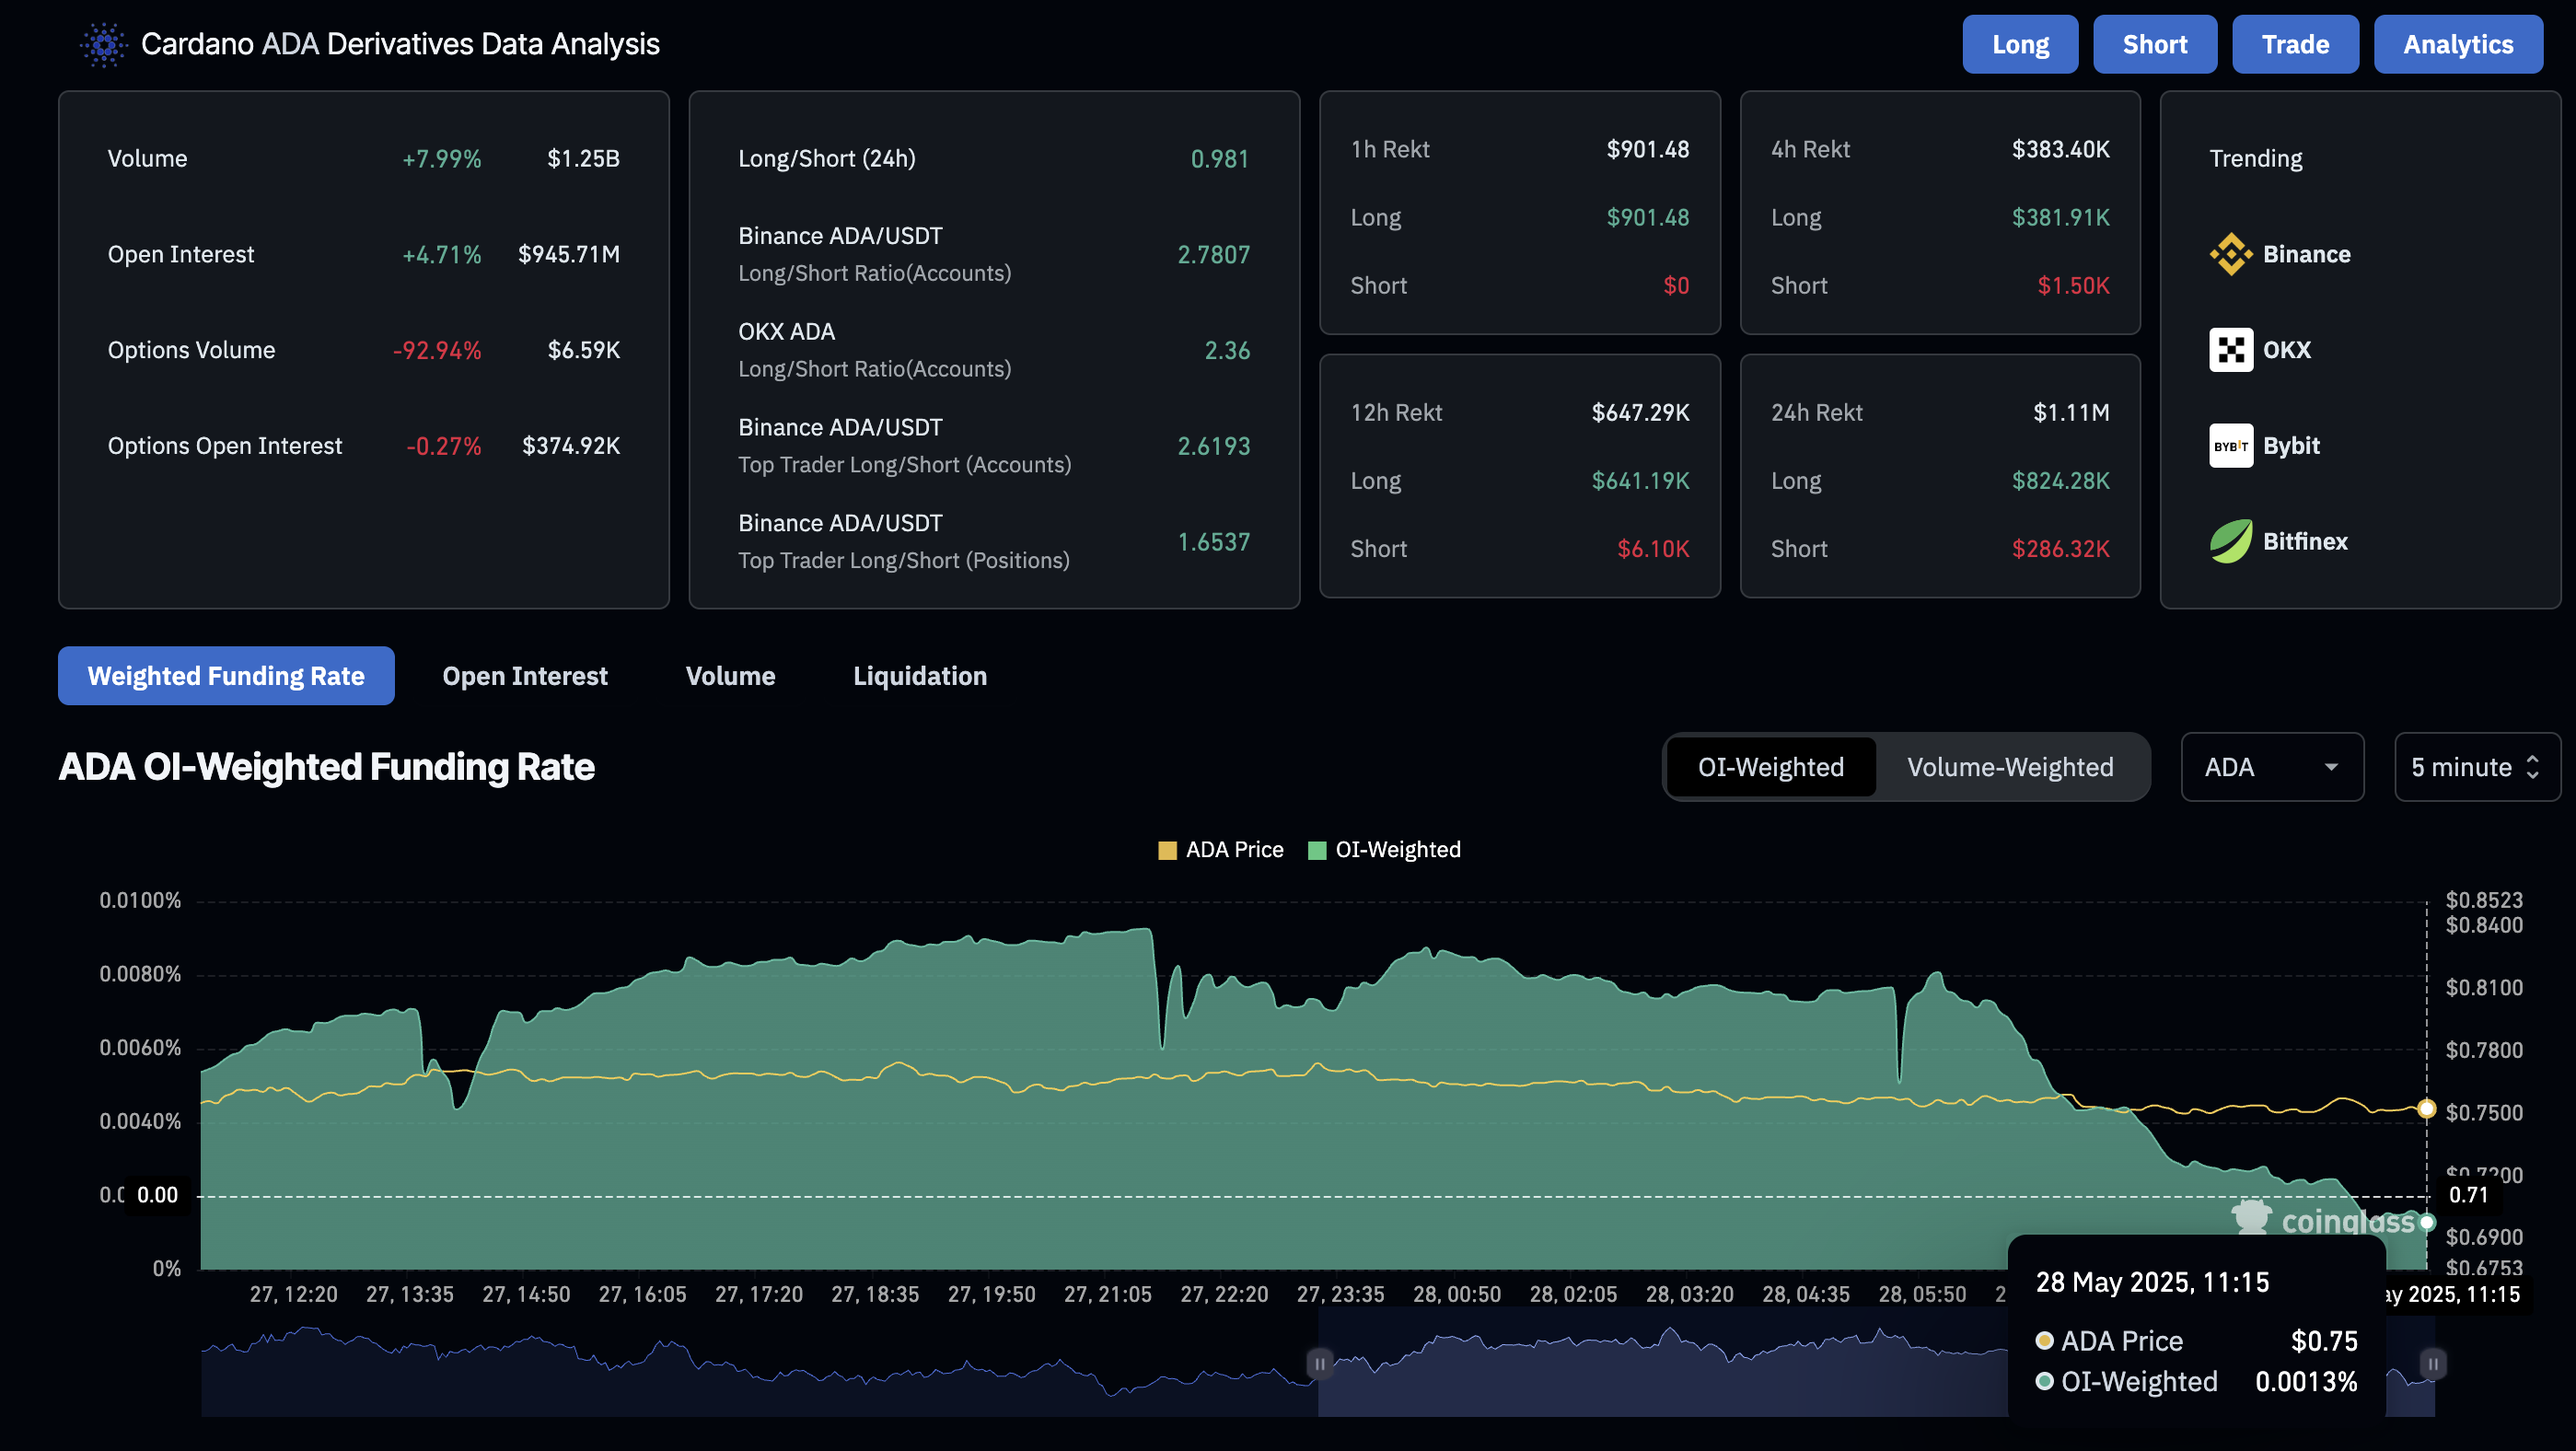
Cardano funding rate. Source: Coinglass
