Meme Coins on the Move: DOGE and SHIB Flash Bullish Signals

Dogecoin and Shiba Inu—the internet’s favorite joke-turned-juggernauts—are stirring again. Traders spot early breakout patterns as the meme duo shakes off crypto winter’s dust.
DOGE pumps its chest: The original meme coin shows strength, teasing a potential run. Meanwhile, SHIB’s chart prints a carbon copy of its 2021 breakout setup—back when ’to the moon’ wasn’t just a tired catchphrase.
Warning: Past performance guarantees exactly nothing in crypto-land. But hey, hope springs eternal between leveraged longs and bagholders.
*Cynical finance jab*: Nothing rallies like assets with zero institutional baggage—unless you count Elon’s tweets as institutional research.
Dog-based meme coins show a positive bias
According to Coinglass’s OI-Weighted Funding Rate data, the number of traders betting that the prices of Dogecoin and Shiba Inu meme coins will slide further is lower than that anticipating a price increase.
This index is based on the yields of futures contracts, which are weighted by their Open Interest (OI) rates. Generally, a positive rate (longs pay shorts) indicates bullish sentiment, while negative numbers (shorts pay longs) indicate bearishness.
The metric stands at 0.0094% and 0.0101% for DOGE and SHIB, respectively, reflecting a positive rate and indicating that longs are paying shorts. This scenario often signifies bullish sentiment in the market, suggesting potential upward pressure on DOGE and SHIB prices.
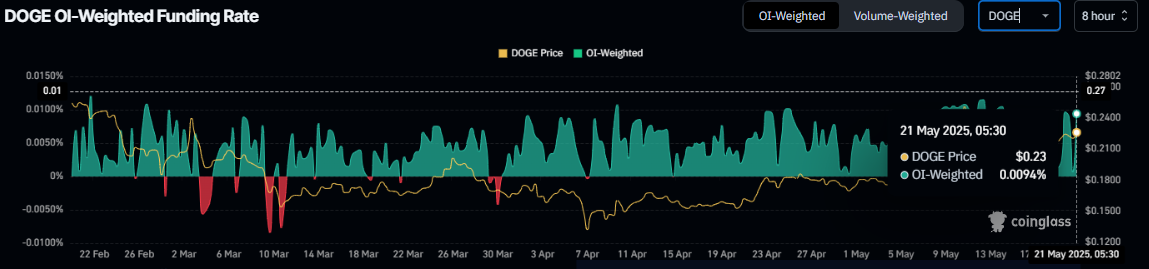
DOGE OI-Weighted Funding Rate chart. Source: Coinglass
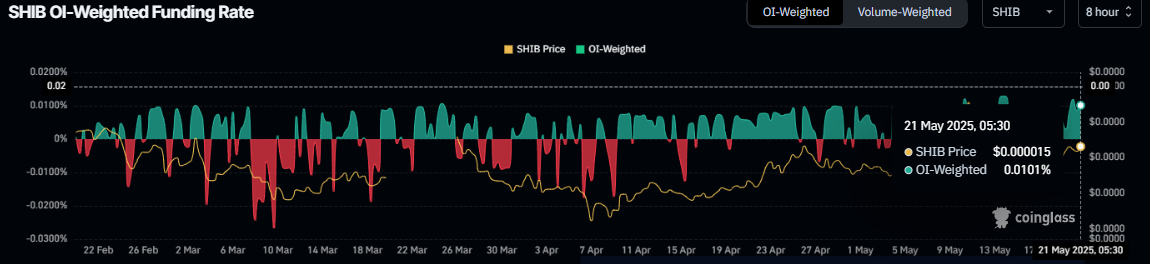
SHIB OI-Weighted Funding Rate chart. Source: Coinglass
On-chain data provider Santiment’s Age Consumed index projects a bullish outlook for these dog-themed memecoins. The spikes in this index suggest dormant tokens (tokens stored in wallets for a long time) are in motion, and it can be used to spot short-term local tops or bottoms.
In the case of Doge and SHIB, history shows that the spikes were followed by a rise in these memecoin prices as holders. The most recent uptick on Tuesday also forecasted that these dog-themed meme coins were ready for an uptrend.
%20%5B10-1747805764576.12.26,%2021%20May,%202025%5D.png)
DOGE Age Consumed chart. Source: Santiment
%20%5B10-1747805786086.07.27,%2021%20May,%202025%5D.png)
SHIB Age Consumed chart. Source: Santiment
Dogecoin Price Forecast: DOGE bulls aim for 20% gains
Dogecoin price has retested multiple times, and support has been found around its 200-day Exponential Moving Average (EMA) at $0.21 since last week. At the time of writing on Wednesday, it trades above this support level at around $0.23.
If the 200-day EMA remains strong, DOGE could extend the rally by 20% from its current trading levels to retest the 50% price retracement level (drawn from the August 2023 low of $0.05 to the December 2024 high of $0.48) at $0.27.
The Relative Strength Index (RSI) on the daily chart reads 61, above its neutral level of 50, indicating bullish momentum.
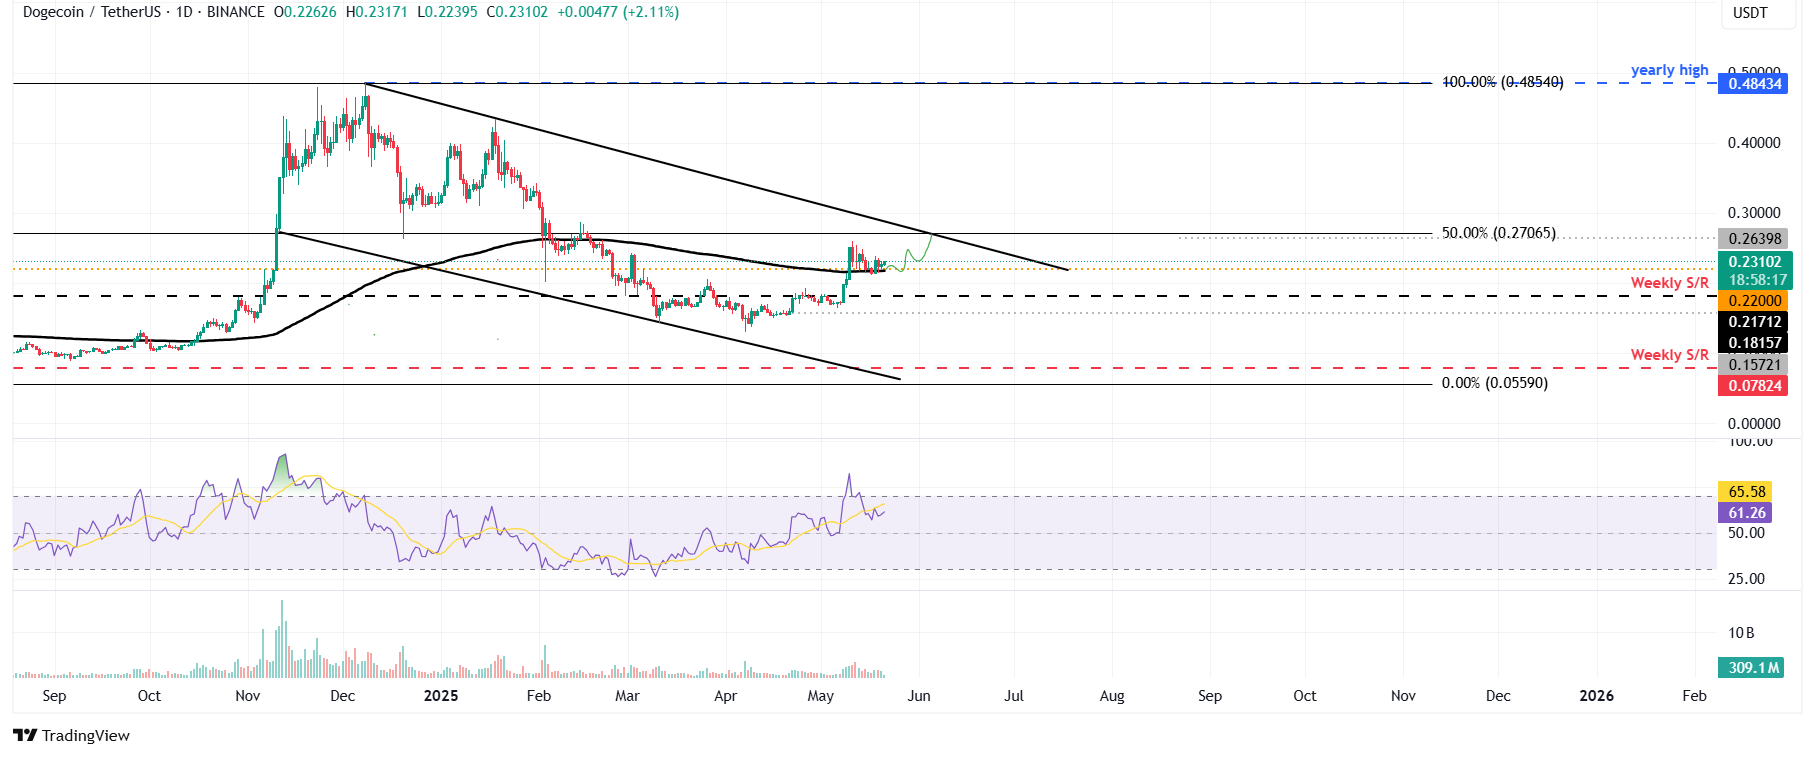
DOGE/USDT daily chart
However, if DOGE breaks and closes below the 200-day EMA at $0.21, it WOULD extend the correction to retest its next weekly support at $0.18.
Shiba Inu Price Forecast: SHIB aims for a 30% rally
Shiba Inu price has been retested, and support has been found around its 50-day EMA at $0.000013 since Saturday, hovering above it for the next three days. This level roughly coincides with the previously broken descending trendline (drawn by connecting multiple highs since mid-December) at $0.000014, making it a key support zone. At the time of writing on Wednesday, it trades at around $0.000014.
If the 50-day EMA remains strong, SHIB could extend the rally by 30% from its current level to retest its next daily resistance at $0.000019.
The RSI on the daily chart reads 61, above its neutral level of 50, indicating bullish momentum.
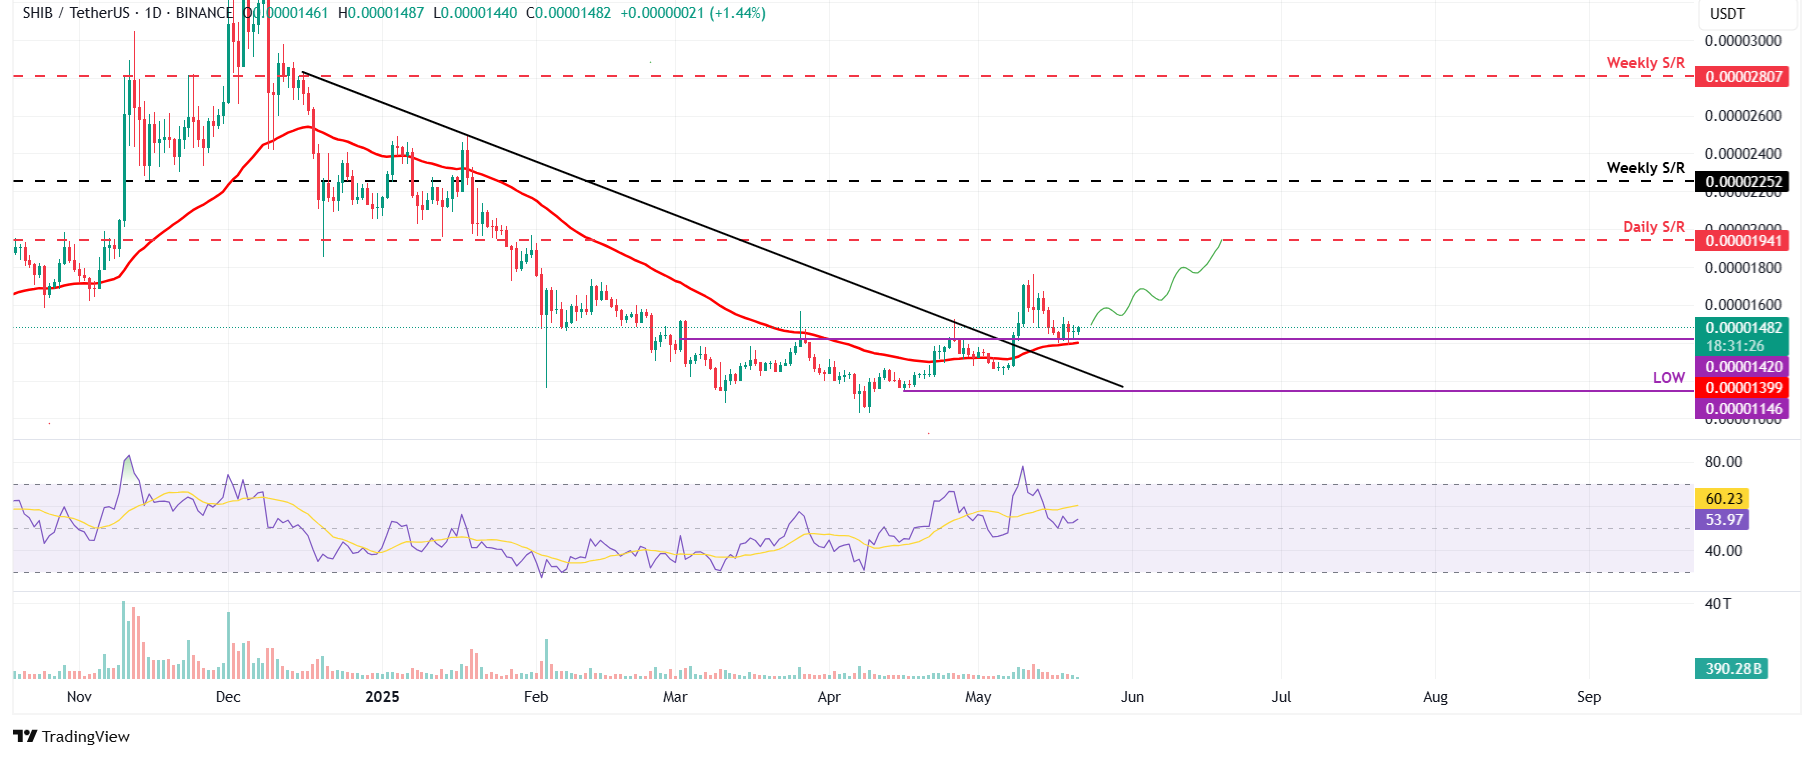
SHIB/USDT daily chart
However, if SHIB closes below $0.000013, it could extend the decline to retest its April 16 low of $0.000011.
