Virtuals Protocol (VIRTUAL) Nosedives as Triple Top Pattern Signals More Pain Ahead

Technical traders are hitting the sell button—Virtuals Protocol’s chart just printed a textbook triple top formation. This classic reversal pattern suggests VIRTUAL’s recent rally just ran out of steam.
Bulls who bought the dip now face a brutal reality check. The protocol’s token has already shed 18% this week, and historical data shows these formations typically precede 30%+ drops. Remember when ’this time was different’ during the last bear market? Yeah, neither do we.
With resistance now firmly established at the $4.20 level (nice try, meme traders), the path of least resistance points straight down. Next support? Try the $2.80 zone—if it holds. Another crypto ’fundamental breakthrough’ meets cold, hard TA.
VIRTUAL holders book profits as bearish bets rise
Virtuals Protocol’s on-chain metrics show that VIRTUAL holders are booking some profits, according to Santiment’s Network Realized Profit/Loss (NPL), which computes a daily network-level Return On Investment (ROI) based on the coin’s on-chain transaction volume. Strong spikes in a coin’s NPL indicate that its holders are, on average, selling their bags at a significant profit. On the other hand, strong dips imply that the coin’s holders are, on average, realizing losses.
The chart below shows that the metric showed a strong spike on May 8 and May 9, the highest spike since December 16. Historically, when this spike occurred, prices fell nearly 20% to 30% due to increased selling pressure.
%20%5B14-1747643858765.07.24,%2019%20May,%202025%5D.png)
VIRTUAL NPL chart. Source: Santiment
Another bearish sign is Coinglass’s VIRTUAL long-to-short ratio, which reads 0.87, the lowest level in over a month. A ratio below one reflects bearish sentiment in the markets as more traders are betting on the asset price to fall.
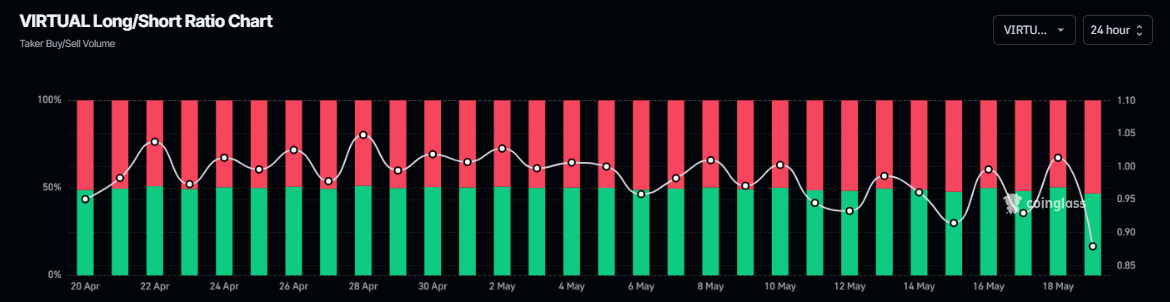
VIRTUAL long-to-short ratio chart. Source: Coinglass
VIRTUAL Price Forecast: Triple top price formation
Virtuals Protocol’s price action on the 4-hour chart has faced resistance around the $2.08 level since May 9, getting rejected multiple times. Meanwhile, the token has consistently found support NEAR the neckline area around $1.66 and rebounded after revisiting it over the weekend. Another failed attempt to break above $2.08 on Sunday shows the formation of a potential triple top pattern, which often signals a shift in momentum from bulls to bears. At the time of writing on Monday, the coin trades down over 10%, approaching its neckline at $1.66.
If VIRTUAL breaks and decisively closes below $1.66, it WOULD extend the fall to retest its technical target at $1.23. The target is obtained by extrapolating lower the distance from the top to the neckline.
The Relative Strength Index (RSI) on the 4-hour chart reads 48, below its neutral level of 50 and points downward, indicating increasing bearish momentum.
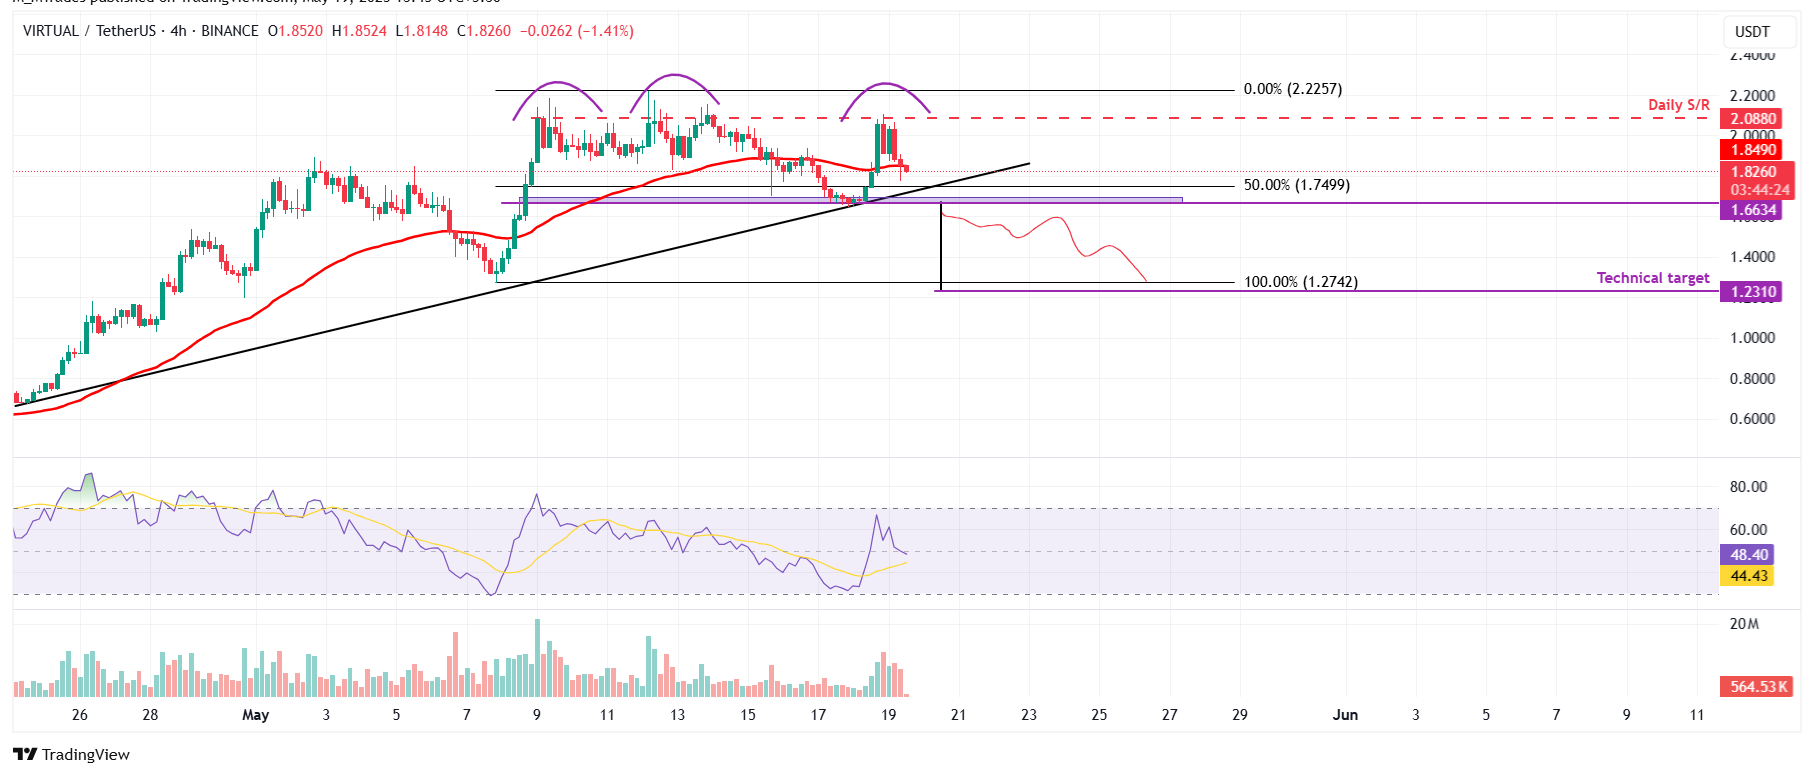
VIRTUAL/USDT 4-hr chart
However, if VIRTUAL recovers, it could extend its recovery to retest its daily resistance level at $2.08.
