MOG, HYPE, BGB Defy Crypto Flatline—Memecoin and Exchange Tokens Pump While BTC Stagnates

While Bitcoin dawdles below $65K, three tokens are printing double-digit gains—proving once again that ’utility’ is optional when hype cycles kick in.
Mog Coin (MOG): The memecoin that refuses to die surges 28% as degenerate traders rotate profits from cat coins to dog coins—and back again.
Hyperliquid (HYPE): Perpetuals protocol token spikes 19% after whispering ’institutional adoption’ to leverage-hungry degens. Spoiler: The institutions are still watching from the sidelines.
Bitget Token (BGB): CEX token pumps 15% because nothing fuels crypto like traders chasing the next exchange airdrop—bonus points for opaque tokenomics!
Meanwhile, traditional investors wait patiently for the ’blockchain revolution’ to look less like a casino and more like, say, a slightly less fraudulent version of Wall Street.
Mog Coin bulls defend critical support
Mog Coin price was rejected from $0.0000013, the highest level since early February, after more than tripling its value following a breakout above a longstanding descending trendline around $0.0000003.
However, before bears exerted full force to trim gains, traders bought the dip, absorbing the selling pressure and igniting an immediate rebound above the 200-day Exponential Moving Average (EMA), currently holding at $0.000001.
MOG hovers at $0.0000011 at the time of writing, up over 6% on the day. A daily close above the 200-day EMA WOULD reinforce the bullish grip, encouraging traders to seek exposure betting that gains could edge higher above the most recent peak of $0.0000013.
The Moving Average Convergence Divergence (MACD) indicator supports the bullish outlook above the centre line. At the same time, the MACD line’s (blue) gap above the signal line (red) upholds the buy signal flashed on May 8.
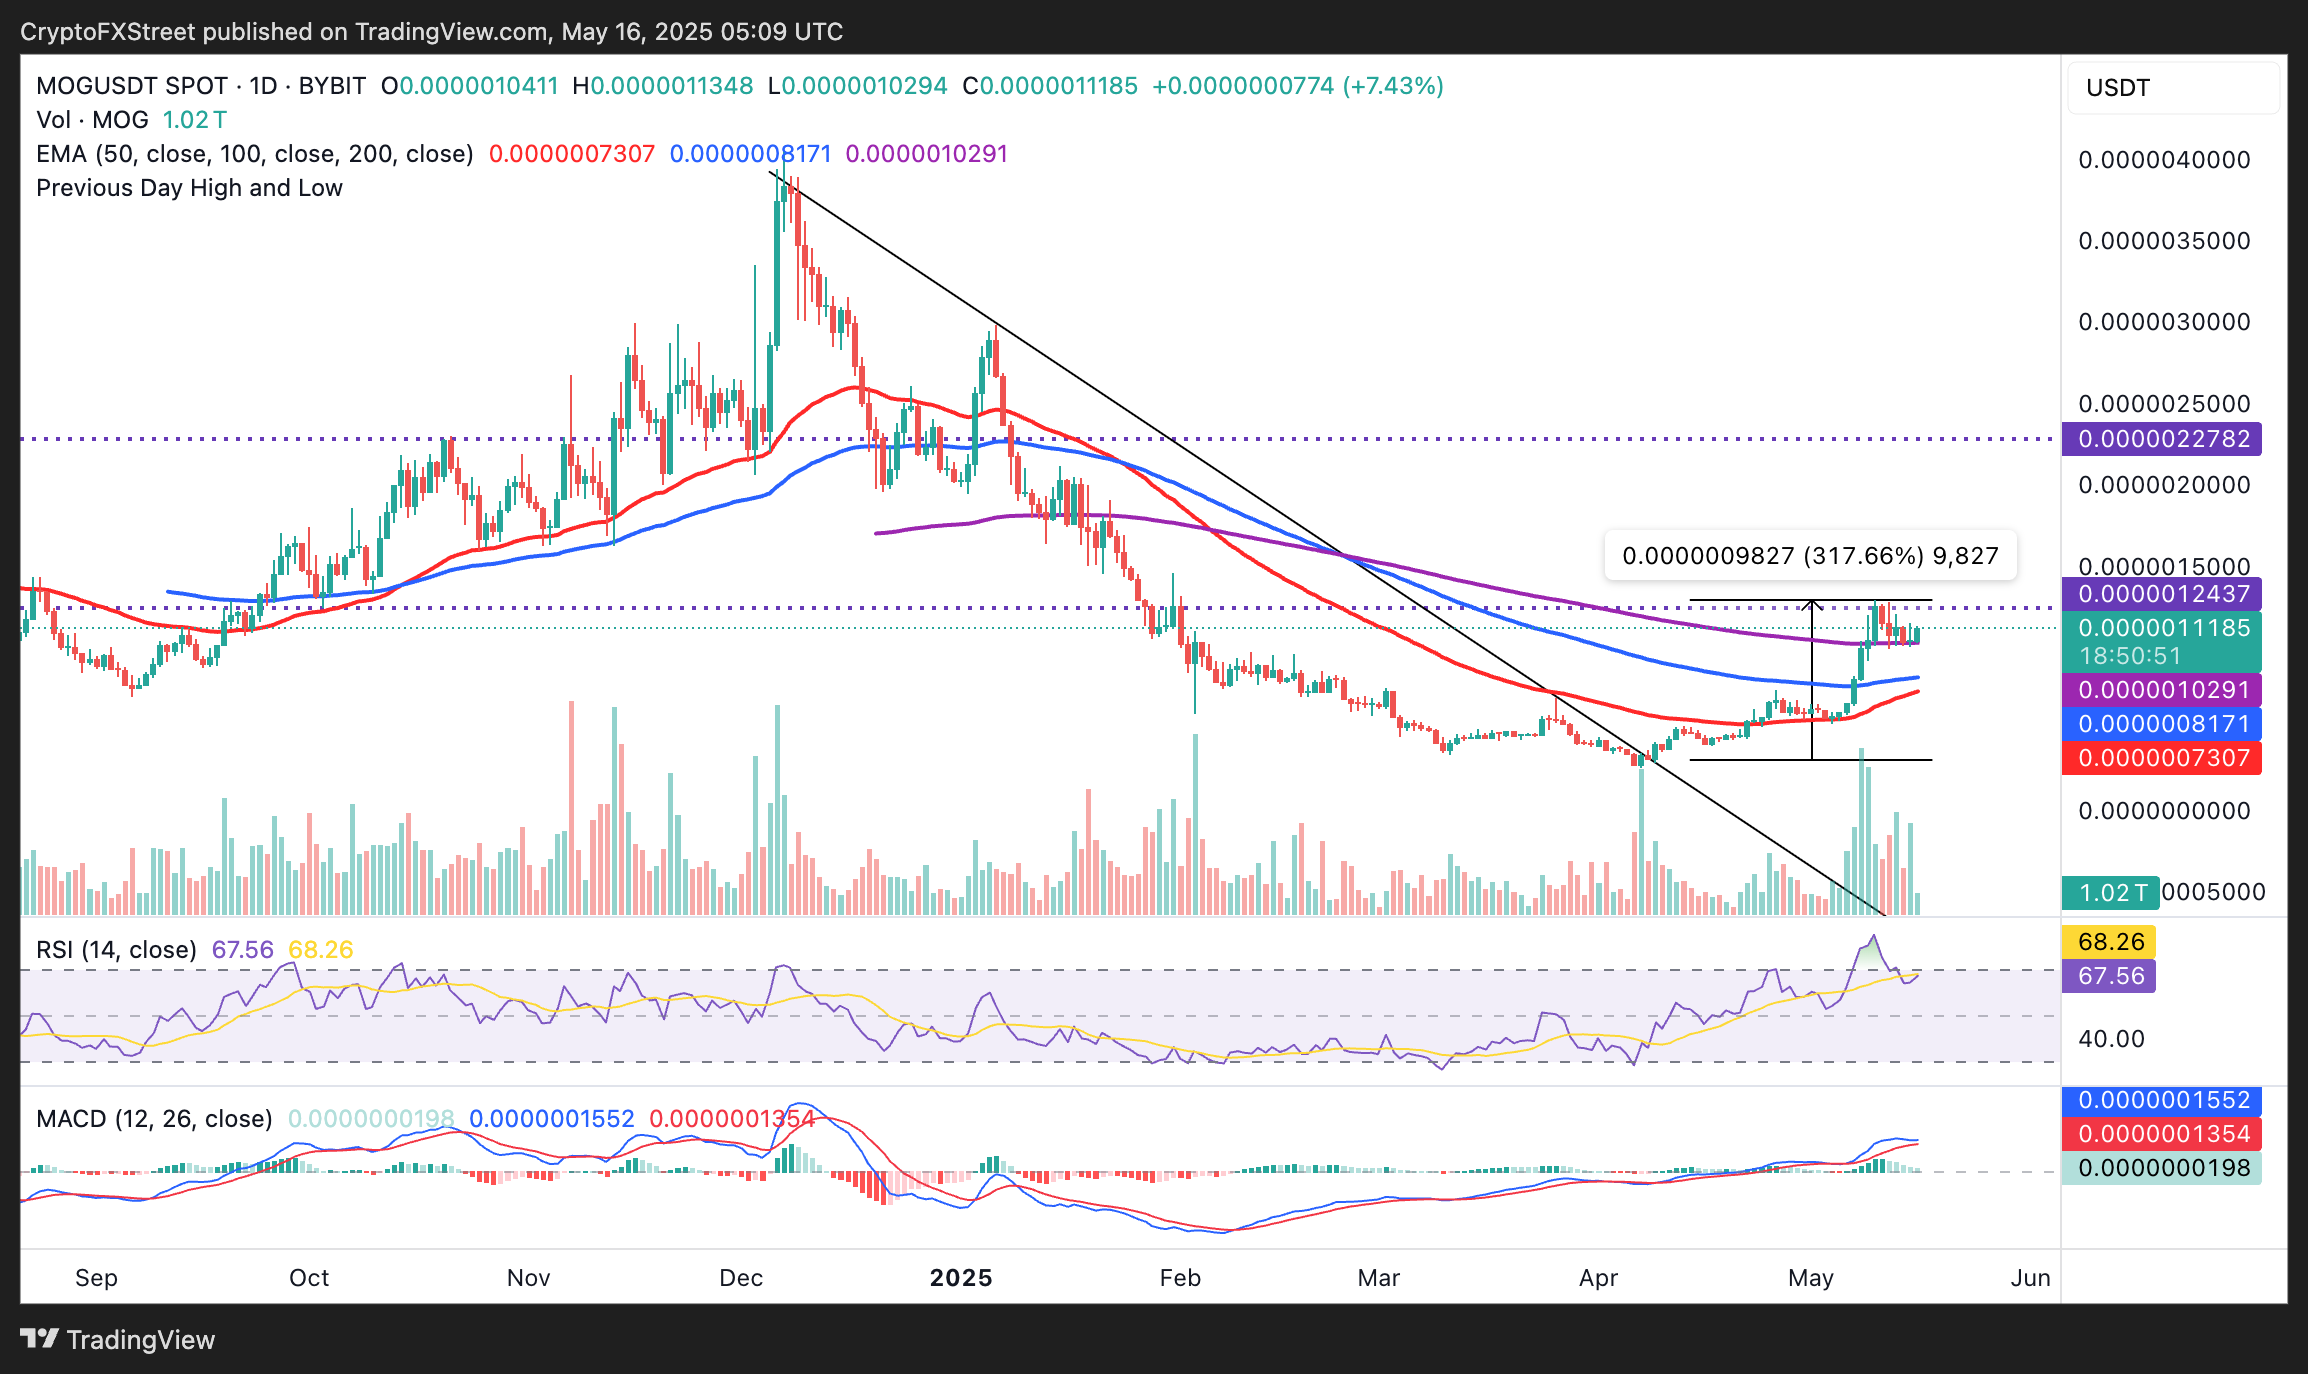
MOG/USDT chart
Following the recovery from the short-term support at $0.000001, the Relative Strength Index (RSI) at 67.44 shows signs of a reversal into the overbought territory above 70. Such a MOVE would mean a strong uptrend but highlight potential risks due to overbought conditions, often a precursor to pullbacks. Therefore, traders should stay alert and prepare for a potential drawdown likely to target the 100-day EMA at $0.0000008 and the 50-day EMA at $0.0000007.
Hyperliquid is on the verge of breaking key resistance
Hyperliquid’s surge from the tariff-triggered crash on April 7 is still intact as it exchanges hands at $26.68 after breaching several crucial supply zones, including the five months descending trendline resistance, the former 50-day Exponential Moving Average (EMA) hurdle around $16.00 (marked red on the chart) and the seller congestion at $20.00.
The tailwind on HYPE appears to be holding up, with the MACD indicator lifting higher above the mean line, while sustaining a buy signal validated on April 9. A buy signal occurs when the MACD line (blue) crosses above the signal line (red).
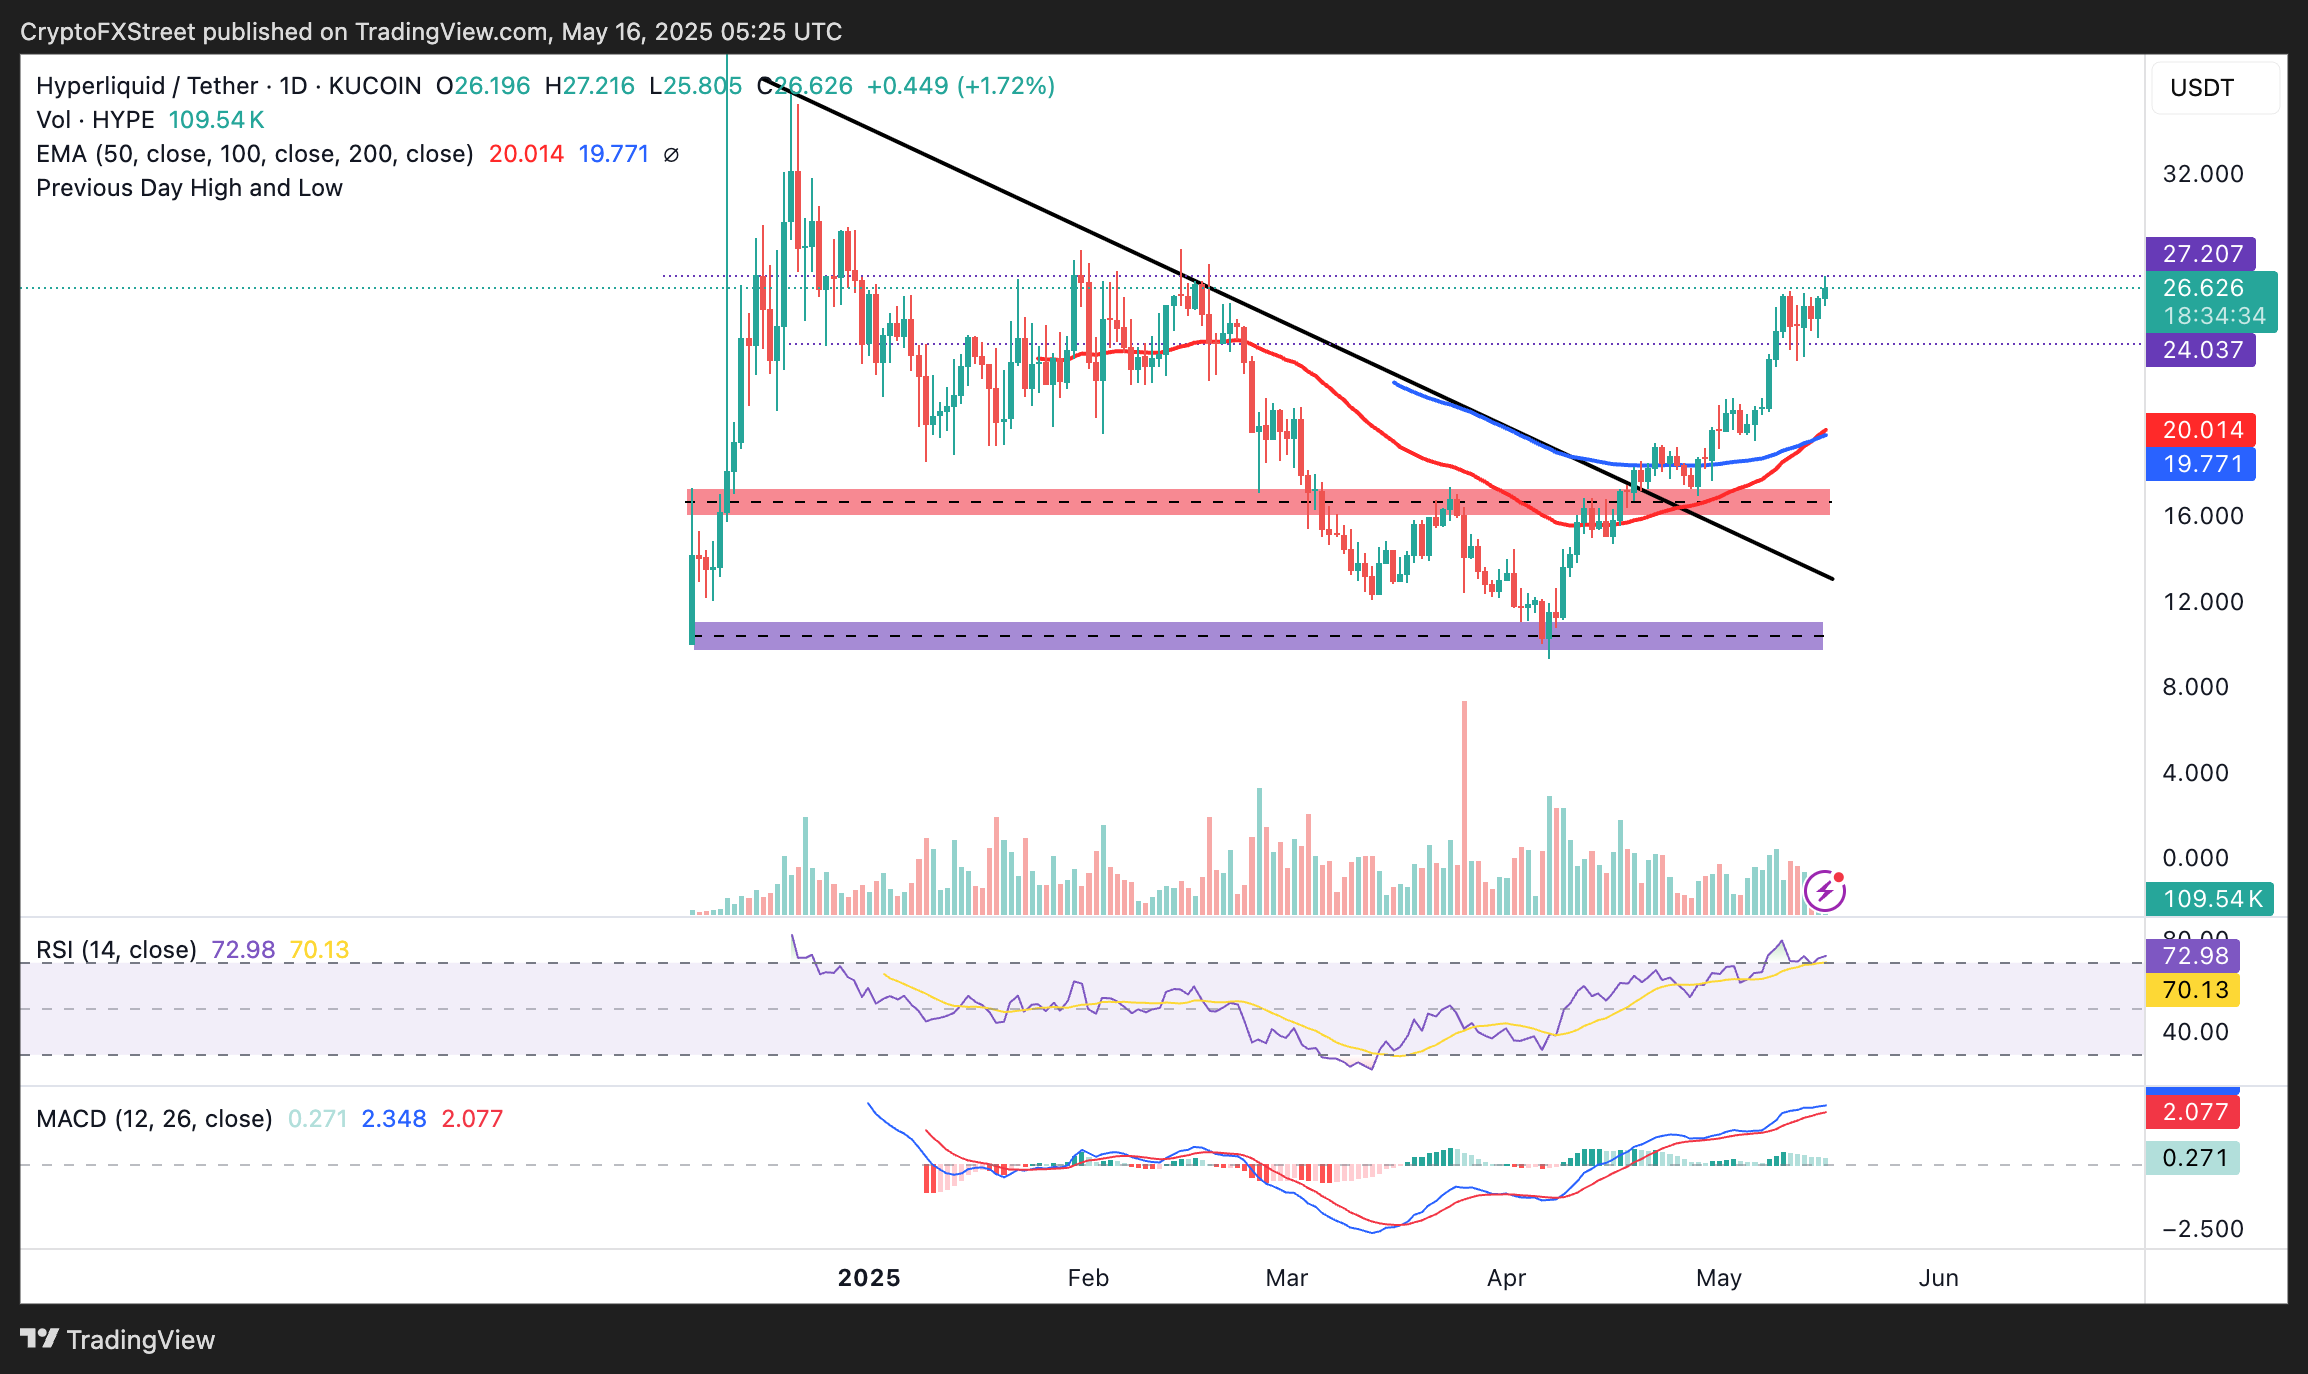
HYPE/USDT daily chart
Despite the RSI indicator being overbought at 72.99, its rebound after retracing from a peak around 80 on May 10 signals a strong rally in play. While its upward movement supports the uptrend, it also signals potential risks, with extremely overbought conditions likely to lead to a sudden trend reversal.
Therefore, it might be prudent for traders to watch HYPE’s price behaviour around short-term resistance to ascertain the uptrend’s strength towards $30.00 and prepare for the possibility of a sudden pullback.
Technical indicators back Bitget Token’s upside potential
Bitget Token’s price is gaining bullish momentum on Friday, climbing nearly 3% to hover around $5.00 at the time of writing.
BGB sits above the key moving averages, including a confluence of support at approximately $4.58, established by the 50-day and 100-day EMAs.
Based on the bullish structure and from the perspective of the MACD and RSI indicators, the path with the least resistance remains upward. The MACD indicator flaunts a buy signal and green histograms, positioned above the mean line shown on the daily chart.
On the other hand, the RSI indicator is approaching the overbought territory after reversing the trend at 58.29, implying that buyers have the upper hand, and a breakout above the descending trendline seems imminent in the short term.
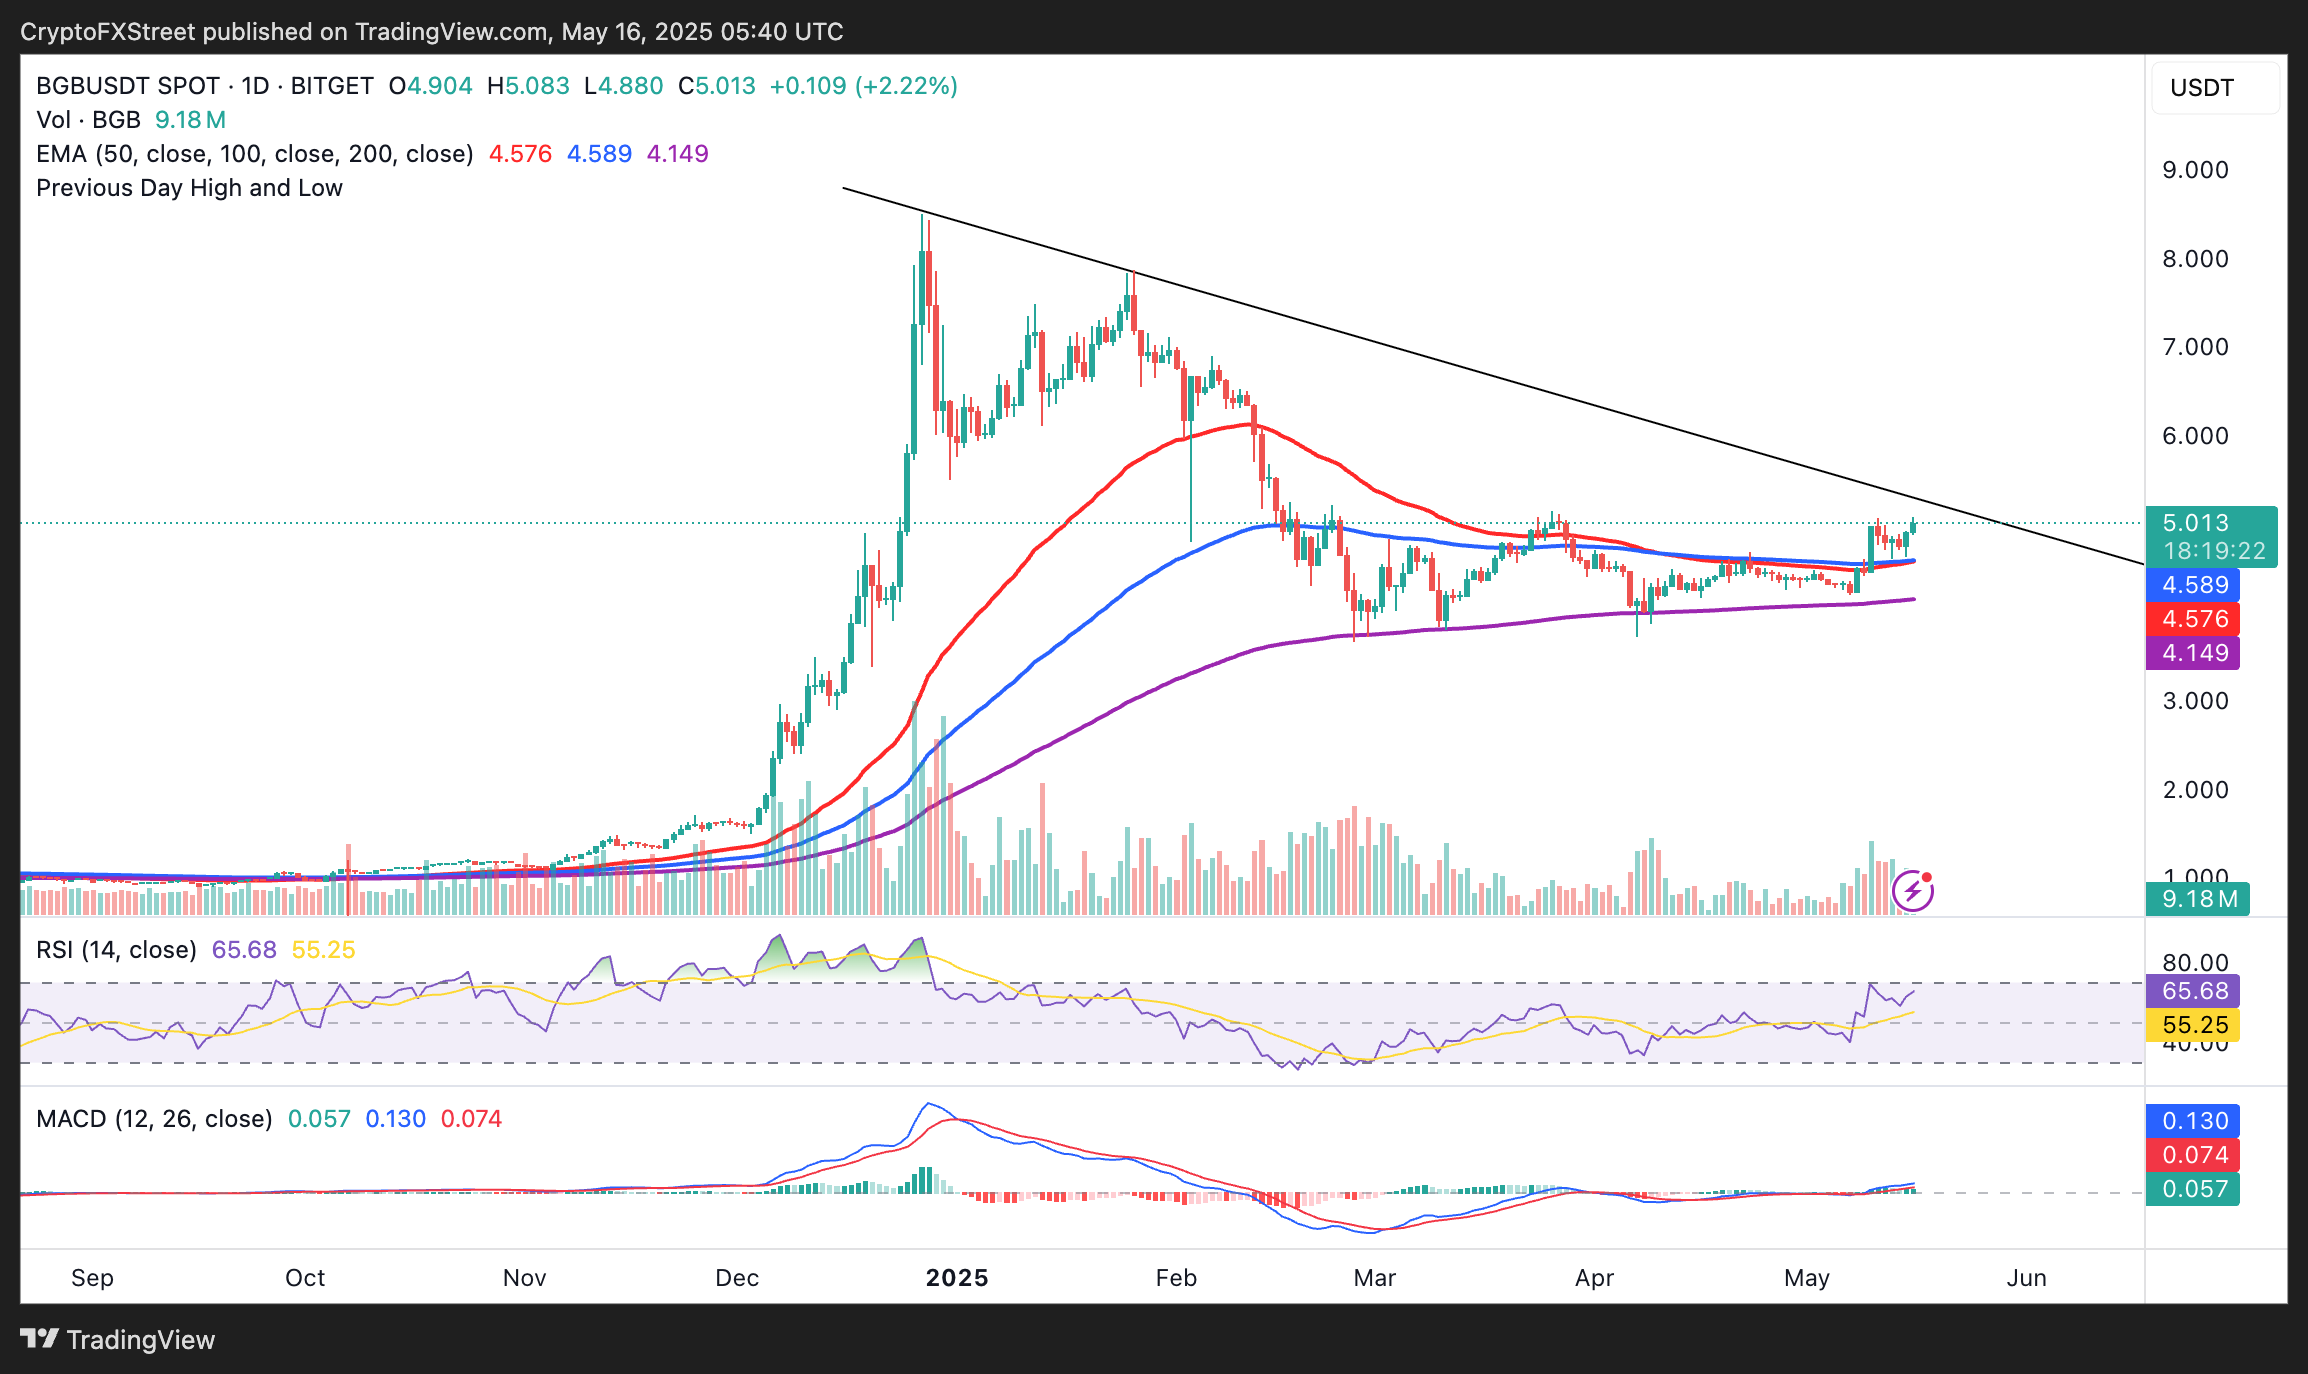
BGB/USDT daily chart
As traders seek exposure to BGB, they must also prepare for a potential trend reversal, especially if the token fails to break above the trendline resistance. Key levels to monitor on the downside include the confluence support at $4.58 and the 200-day EMA at $4.14.
Cryptocurrency prices FAQs
How do new token launches or listings affect cryptocurrency prices?
Token launches influence demand and adoption among market participants. Listings on crypto exchanges deepen the liquidity for an asset and add new participants to an asset’s network. This is typically bullish for a digital asset.
How do hacks affect cryptocurrency prices?
A hack is an event in which an attacker captures a large volume of the asset from a DeFi bridge or hot wallet of an exchange or any other crypto platform via exploits, bugs or other methods. The exploiter then transfers these tokens out of the exchange platforms to ultimately sell or swap the assets for other cryptocurrencies or stablecoins. Such events often involve an en masse panic triggering a sell-off in the affected assets.
How do macroeconomic releases and events affect cryptocurrency prices?
Macroeconomic events like the US Federal Reserve’s decision on interest rates influence crypto assets mainly through the direct impact they have on the US Dollar. An increase in interest rate typically negatively influences Bitcoin and altcoin prices, and vice versa. If the US Dollar index declines, risk assets and associated leverage for trading gets cheaper, in turn driving crypto prices higher.
How do major crypto upgrades like halvings, hard forks affect cryptocurrency prices?
Halvings are typically considered bullish events as they slash the block reward in half for miners, constricting the supply of the asset. At consistent demand if the supply reduces, the asset’s price climbs.

Log in to Reply
Log in to comment your thoughtsComments
Related Articles
|Square
Get the BTCC app to start your crypto journey
Get started today Scan to join our 100M+ users