Avalanche (AVAX) Bulls Charge Toward $30 as Metrics Flash Green

Avalanche’s native token AVAX is gathering steam—technical indicators and on-chain data suggest a breakout toward $30 could be imminent. Here’s why traders are stacking positions.
The bullish case: Rising trading volumes, key resistance breaks, and a surge in active addresses paint a classic accumulation pattern. Even the ’smart money’ wallets—those holding 10K+ AVAX—are expanding.
Watch the macros: Crypto’s latest rally feels suspiciously timed with traditional markets wobbling—because nothing solves inflation like speculative digital assets, right?
Bottom line: AVAX needs to hold above $25 to confirm the uptrend. If it does, the path to $30 looks wide open. Just don’t blame us when the whales take profits.
Avalanche bulls take control of the momentum
CryptoQuant data, as shown in The Graph below, highlights buying pressure on AVAX. The Taker CVD (Cumulative Volume Delta) for AVAX has been positive and has increased since early May. This indicator measures the cumulative difference between market buy and sell volumes over 3 months. When 90-day CVD is positive and increasing, it suggests the Taker Buy Dominant Phase, while a negative and decreasing value indicates the Taker Sell Dominant Phase.
-1747200869233.png)
AVAX Spot Taker CVD chart. Source: CryptoQuant
CoinGlass’ data shows that the futures’ Open Interest (OI) in AVAX at exchanges rose from $488.25 million on Friday to $622.54 million on Wednesday, levels not seen since early February. An increasing OI represents new or additional money entering the market and new buying, which could fuel the current AVAX price rally.
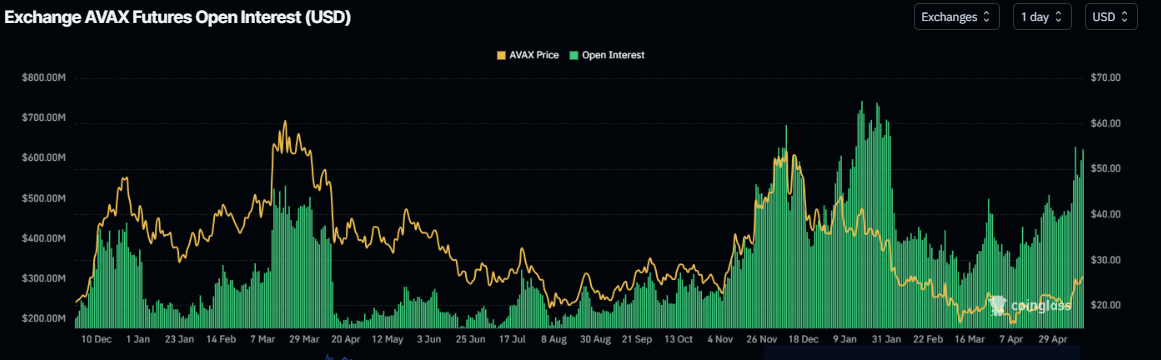
AVAX open interest chart. Source: Coinglass
Avalanche bulls could hit $30 if it closes above its key resistance
Avalanche price has faced resistance around its 200-day Exponential Moving Average at $26.07 since Sunday. However, earlier this week, it retested and found support around its 100-day EMA at $23.21. At the time of writing on Wednesday, it approaches its key resistance at $26.07.
If AVAX breaks and closes above its 200-day EMA at $26.07 on a daily basis, it could extend the rally to retest its psychological barrier at $30.
The Relative Strength Index (RSI) on the daily chart reads 69, pointing upward toward its overbought levels of 70, indicating strong bullish momentum. However, traders should be cautious as the chances of a pullback are high due to the overbought condition. Another possibility is that the RSI remains above the overbought level of 70 and continues its upward trend.
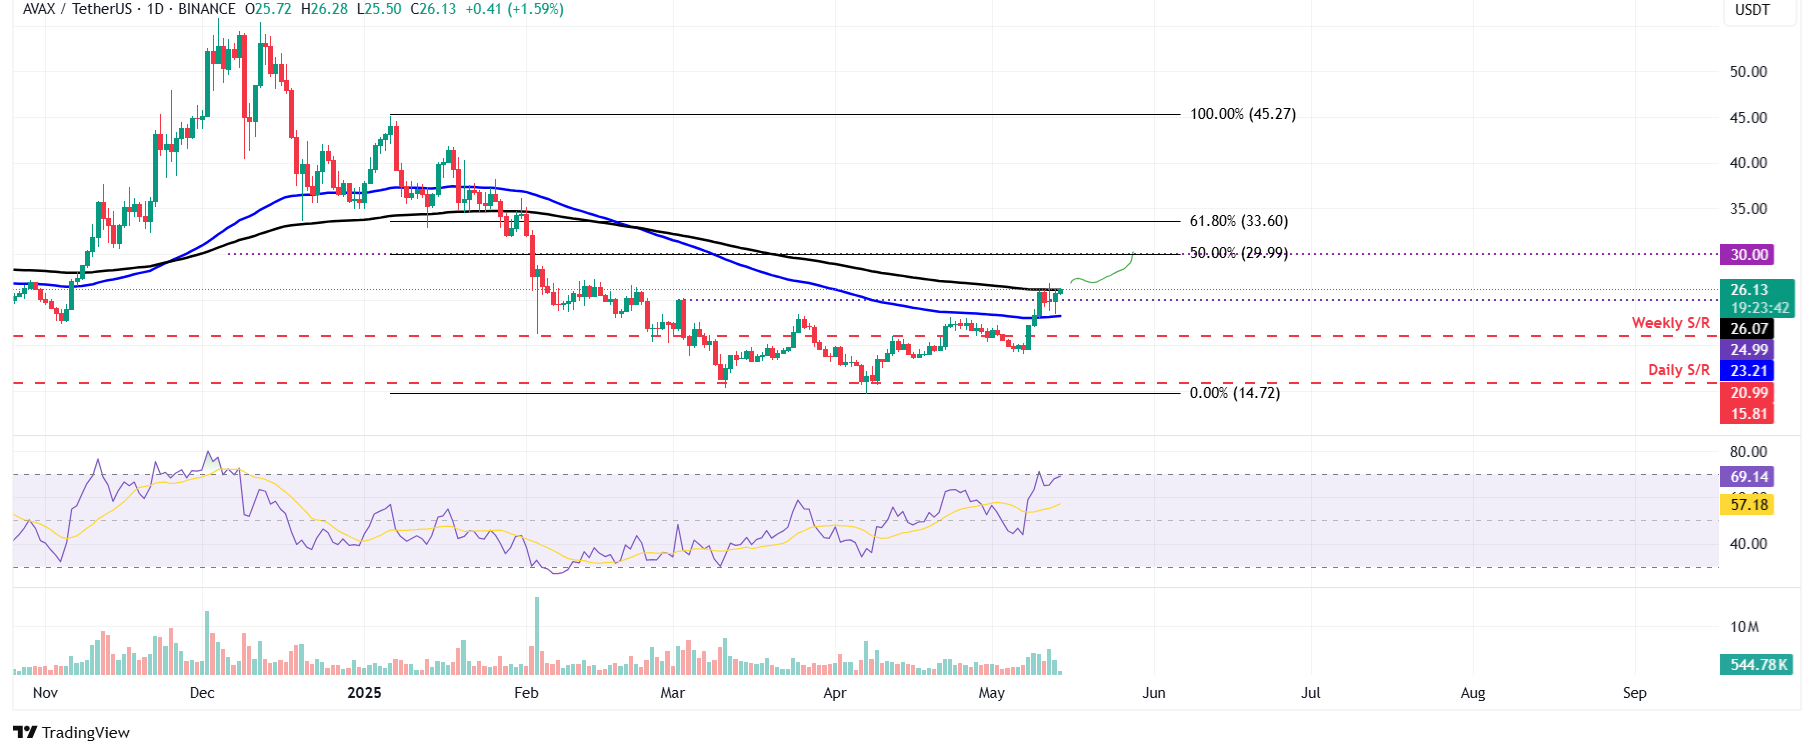
AVAX/USDT daily chart
However, if AVAX faces a correction, it could extend the decline to test its 100-day EMA level at $23.21.
