Ethereum Bounces Back—Is $6K the Next Stop?

After a brutal correction, ETH bulls are back in charge. The rebound defies skeptics—and Wall Street’s usual ’wait-and-see’ paralysis.
Key drivers: Institutional inflows, Layer 2 adoption, and that old crypto standby—sheer FOMO. Even TradFi analysts grudgingly admit the network’s deflationary mechanics are working (though they’ll still call it ’speculative’).
What’s next? A retest of all-time highs looks inevitable unless macro tanks the party. Watch for leverage liquidations if price approaches $5,800—because nothing screams ’healthy market’ like a cascade of margin calls.
Figure 1. Our preferred long-term EW count for Ethereum
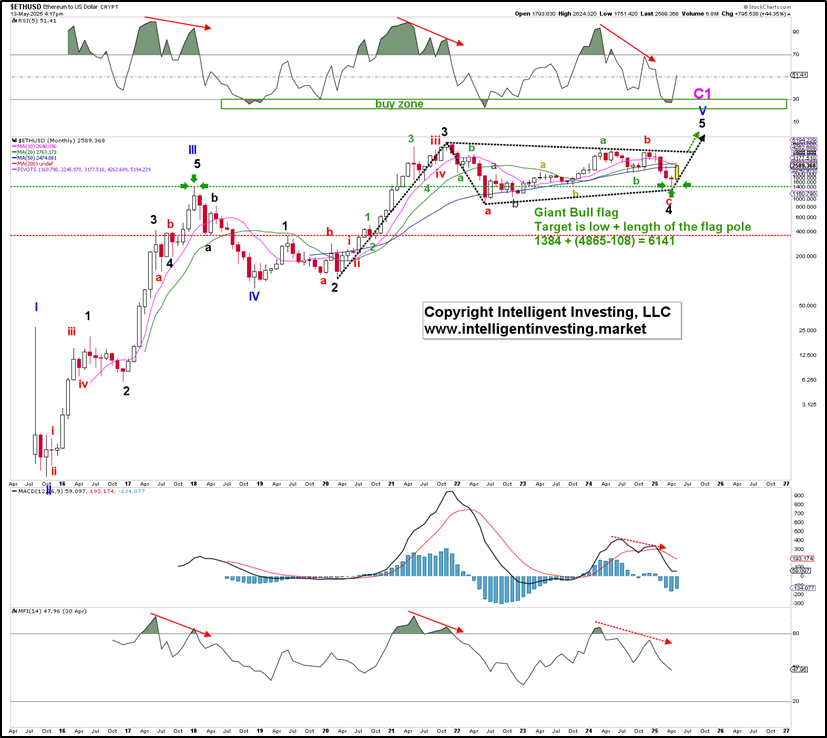
Zooming in on the path since the December 2023 high, we were tracking a final wave lower for the completion of the red W-c to ideally around $1085, where the green W-5 WOULD equal the length of the green W-1, measured from the green W-4 high: green dotted arrow. Moreover, that level was the 2.618x extension of W-1 measured from W-2. However, the bears could not push the price of Ether lower, and we were left with a failed 5th wave. This is why we stated,
“However, if ETH moves above at least the 50-d SMAs, the DT line, and $2093 without making a lower low first, we must consider the four-month-long downtrend complete and look towards the low $6000s over the next several months. As such, there’s an increasingly favorable risk/reward setup in the making for those who would like to have exposure to Ethereum, contingent on holding above its 2019 high at $356.”
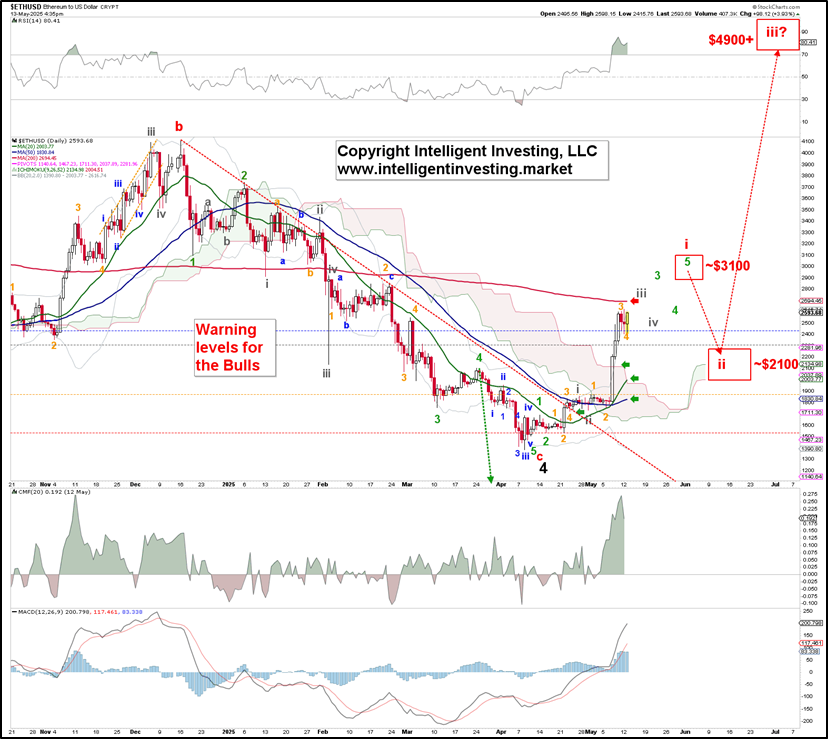
Figure 2. Our detailed, short-term EWP count for Ethereum
Yes, we don’t sweat the small stuff as it prevents one from seeing the forest for the trees. Knowing that a larger correction is completing, and will be followed by a >400% gain, is much more important than focusing on the last few percentage points lower.
In our last update, ETH was in a strong downtrend. What a difference a month makes, as it is now in an uptrend:
- above the downtrend (DT) line, which has held all upside in check since the December high
- above its ascending red 20-day simple moving average, which is above the (blue) 50-d SMA.
- above the now-increasing Ichimoku Cloud
The only obstacle in its way is the (red) 200-d SMA. However, based on our preferred short- and long-term EW counts and the rally’s current strength, we view it as a temporary roadblock.
Thus, Ethereum failed to reach the ideal downside target of $1085, but the price levels we set out to watch gave us ample warning that the downtrend had ended. Besides, the risk/reward was heavily skewed towards reward. Moreover, the daily chart has flipped from bearish to bullish. ETH has therefore most likely wrapped up the more significant (black) 4th wave and is ready to embark on a multi-month five-wave move to at least $6100+.
