BNB Price Forecast: BNB Holds Firm Near $1,000, Primed for Next Bullish Surge

BNB defies market volatility—holding steady at the $1,000 threshold as traders eye explosive upside potential.
Technical Breakout Imminent
The cryptocurrency consolidates near psychological resistance levels, showing remarkable stability while traditional assets wobble. Trading volumes suggest institutional accumulation beneath the surface.
Ecosystem Momentum Builds
Binance Smart Chain activity continues driving fundamental value—deployments surge while transaction metrics outperform legacy financial networks. The token demonstrates utility beyond speculative trading.
Market Psychology at Play
Traders watch for decisive break above $1,050—a move that could trigger algorithmic buying cascades. Support remains robust at $950, creating compressed energy for upward movement.
Meanwhile, traditional finance executives still debate whether crypto is 'a phase'—right before their quarterly earnings miss projections again.
BNB’s institutional demand gains traction
Nasdaq-listed CEA Industries (BNC) CEO David Namdar released a letter to Shareholders on Sunday, stating that the firm has filed an S-3 to raise $500 million in common equity via a PIPE and up to $750 million in warrant transactions to expand its BNB holdings.
Namdar compared the firm’s BNB strategy to Strategy (MSTR), formally known as MicroStrategy’s early Bitcoin play, positioning BNC as a premier public vehicle for BNB exposure.
On Monday, BNC announced that its Board of Directors had authorized a stock repurchase program of up to $250 million of the Company’s common stock.
“This buyback program reflects our confidence in the long-term value of CEA Industries and our conviction in BNB, which is trading NEAR all-time highs,” said Namdar.
These news announcements suggest a bullish outlook for the BNB token in the long term, as they increase exposure, growth, liquidity, and wider adoption.
BNB’s derivatives data show bullish bias
On the derivatives side, BNB shows signs of a bullish outlook. Coinglass’s OI-Weighted Funding Rate data shows that the number of traders betting that the price of BNB will slide further is lower than those anticipating a price increase.
The metric flipped to a positive rate on Monday and reads 0.0062% on Tuesday, indicating that longs are paying shorts. Historically, as shown in the chart below, when the funding rates have flipped from negative to positive, BNB has rallied sharply.
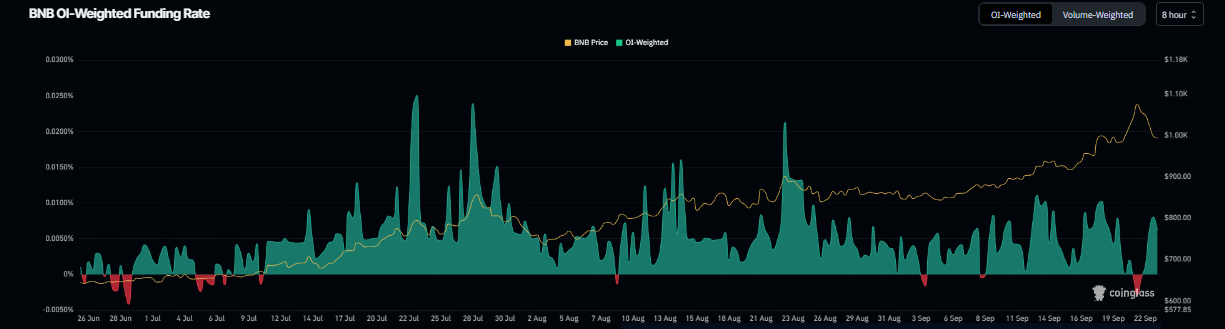
BNB funding rate chart. Source: Coinglass
Additionally, CoinGlass’ data show that the futures’ Open Interest (OI) in BNB at exchanges reached a new all-time high of $2.40 billion on Sunday and remained steady around $1.97 billion on Tuesday. An increasing OI represents new or additional money entering the market and new buying, which could fuel the current BNB price rally.
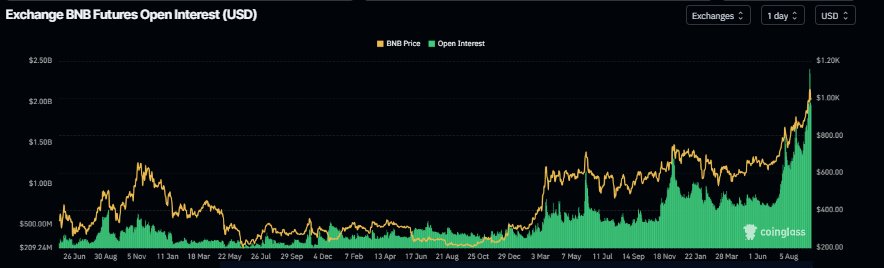
BNB open interest chart. Source: Coinglass
BNB Price Forecast: Will BNB set a new all-time high?
BNB price reached a new all-time high (ATH) of $1,083.47 on Sunday but failed to maintain the upward trend, declining 5.2% the next day. At the time of writing on Tuesday, it steadies at around $1,000.
Sideline investors looking to accumulate BNB could do so between $900.71 (daily support level) and $948.45, the 61.8% Fibonacci retracement level (drawn from the August 3 low of $730.01 to the ATH of $1,083.47).
If BNB continues its upward momentum, it could extend the rally toward its ATH of $1,083. A successful close above this level could extend the gains to test the 141.4% Fibonacci extension level at $1,229.80.
The Relative Strength Index (RSI) on the daily chart reads 65, pointing upward, toward its overbought conditions, indicating strong bullish momentum. Additionally, the Moving Average Convergence Divergence (MACD) showed a bullish crossover on September 10, which remains in effect, supporting the bullish thesis.
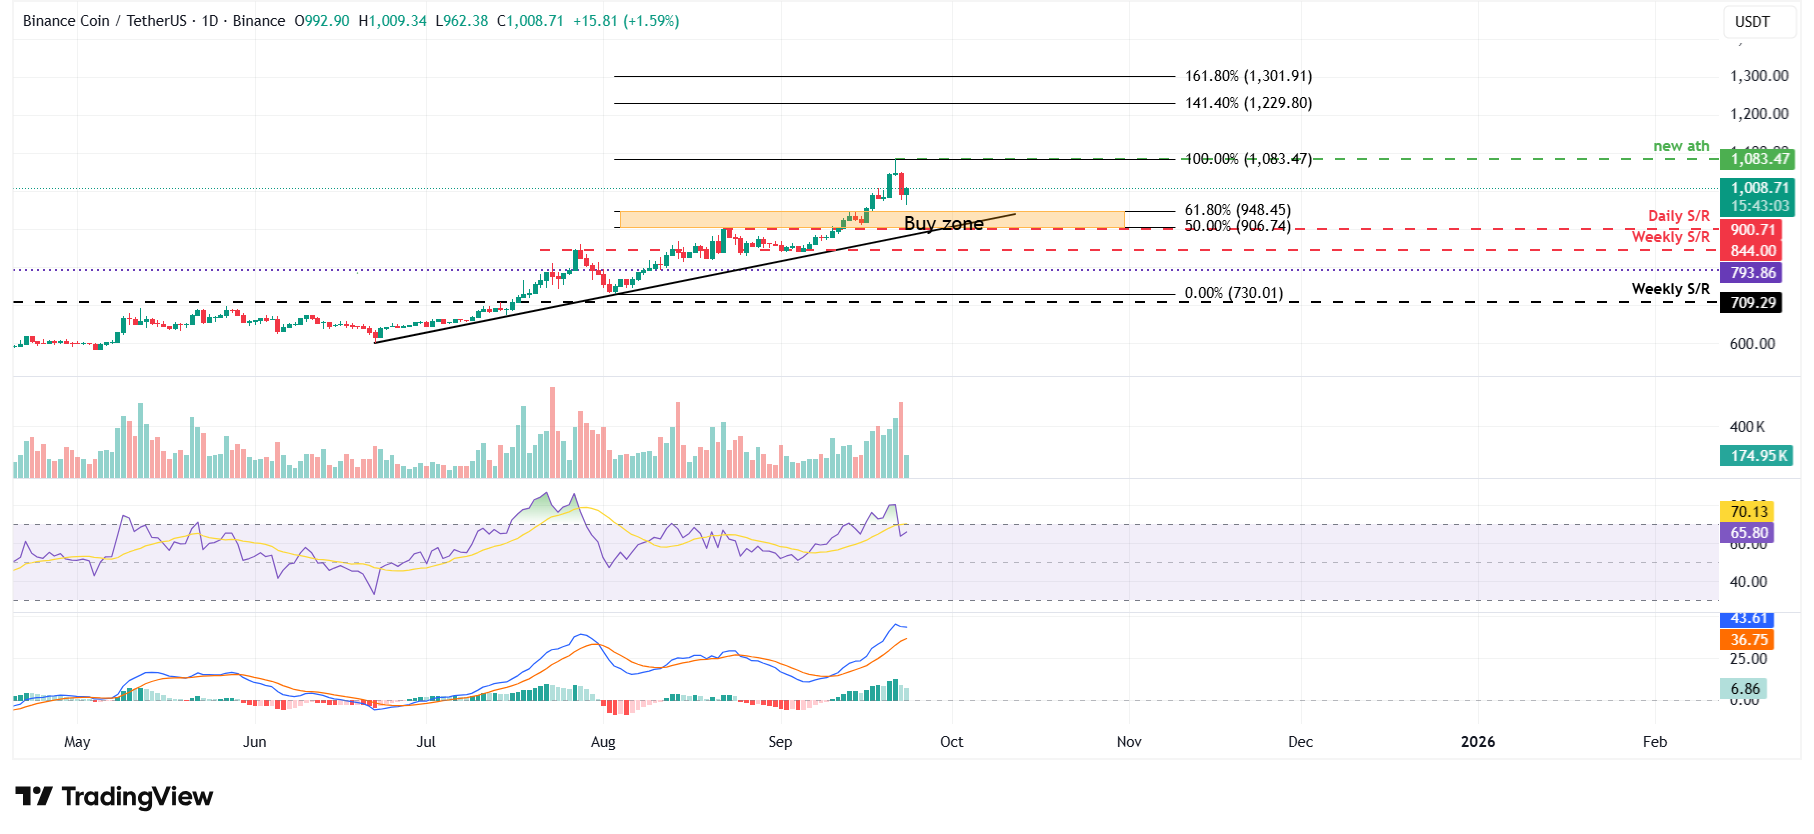
BNB/USDT daily chart
However, if BNB closes below the daily support at $900.71, it could extend the decline toward the weekly support at $844.
