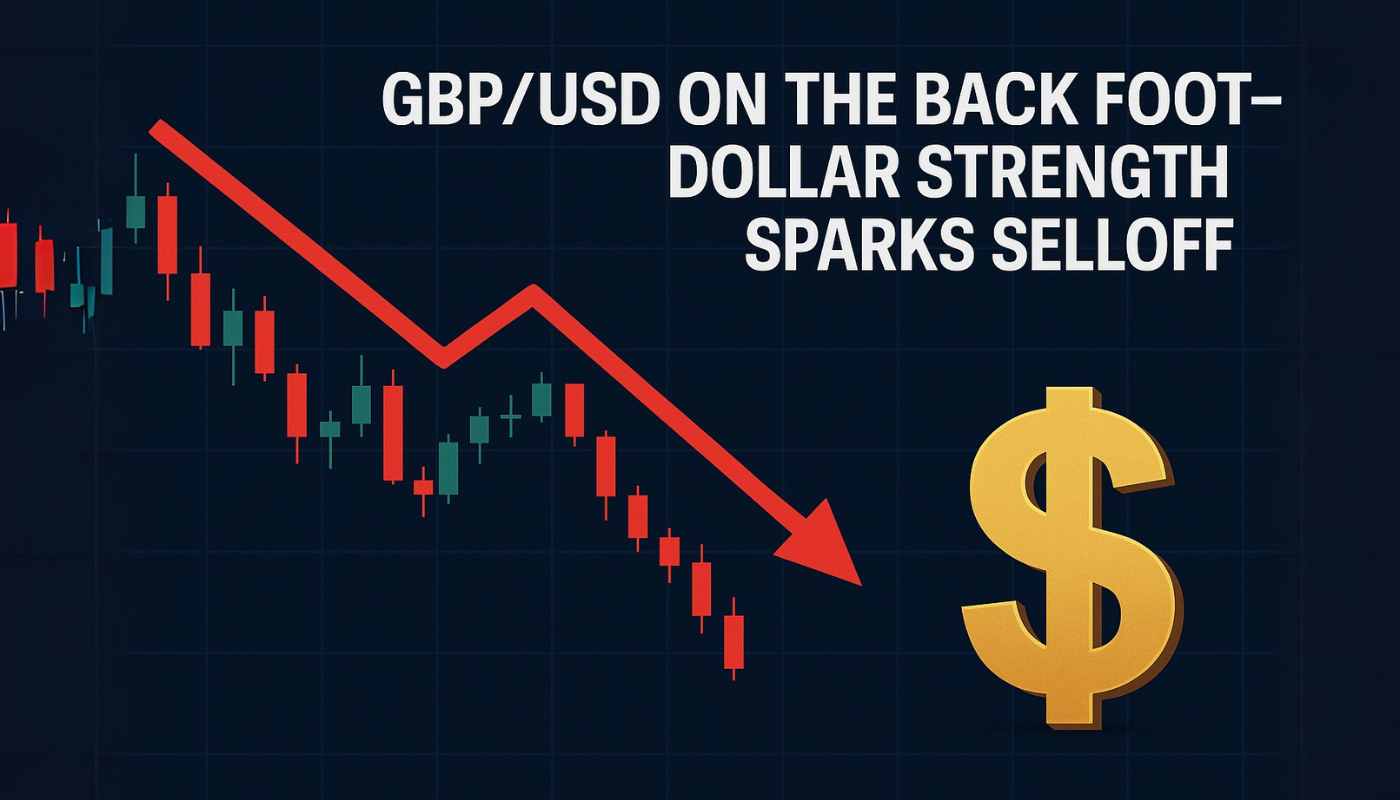
GBP/USD Tanks as Dollar Flexes Muscle—Traders Rush for Exits

The pound takes a beating against the greenback as USD strength triggers a cascade of sell orders. Another day, another fiat currency getting wrecked by macro winds—but hey, at least crypto never sleeps.
Why it matters: Sterling’s slump highlights the dollar’s relentless dominance. Forex markets tremble while Bitcoin hodlers shrug.
The bottom line: When traditional currencies play musical chairs, someone always ends up standing. This time it’s GBP holders left holding the bag.
Technical Analysis: GBP/USD Faces Key Support Levels
Technically the GBP/USD is under pressure and struggling to hold above $1.3212 after falling from $1.3298. The 50 day EMA at $1.3293 is now acting as resistance and the recent break below this level suggests the downtrend will continue. The MACD is confirming the selling pressure as the histogram turns red.
USD/JPY Price Chart – Source: TradingviewImmediate Resistance: $1.3212
Next Resistance: $1.3298
Immediate Support: $1.3123
Next Support: $1.3051
50 EMA: $1.3293 (Bearish, acting as resistance)
MACD: Bearish crossover, momentum building
RSI: Approaching oversold, potential for short term bounce
GBP/USD Outlook – May 2025
Watch out for economic data this week, UK labor market and US inflation numbers. A break below $1.3123 will confirm the downside to $1.3051, above $1.3212 will be a short term bounce. But as long as below the 50 day EMA the trend is bearish.

