XRP Price Teeters on Edge of Major Sell-Off as Bearish Pattern Emerges

XRP faces mounting pressure as technical indicators flash warning signs—traders brace for potential downside momentum.
Pattern Recognition Signals Trouble
A classic bearish formation takes shape on the charts, threatening to trigger cascading sell orders across exchanges. The setup suggests weakened bullish conviction and growing institutional skepticism.
Market Psychology Shifts
Fear replaces greed as holders monitor key support levels. Previous buying enthusiasm evaporates—replaced by cautious hedging and stop-loss positioning.
Liquidity Test Looms
Critical price zones now act as make-or-break thresholds. A breakdown could accelerate selling pressure as algorithmic traders pile on short positions.
Because nothing says 'sound investment' like watching your portfolio mimic a crypto winter documentary—in real time.
Chart Patterns Point to More Downsides
The chart via tradingview shows that XRP has been forming a descending triangle pattern since its rally to multi-year highs at $3.66. The structure is marked by a flat support level and a downward-sloping resistance line, usually a bearish sign.
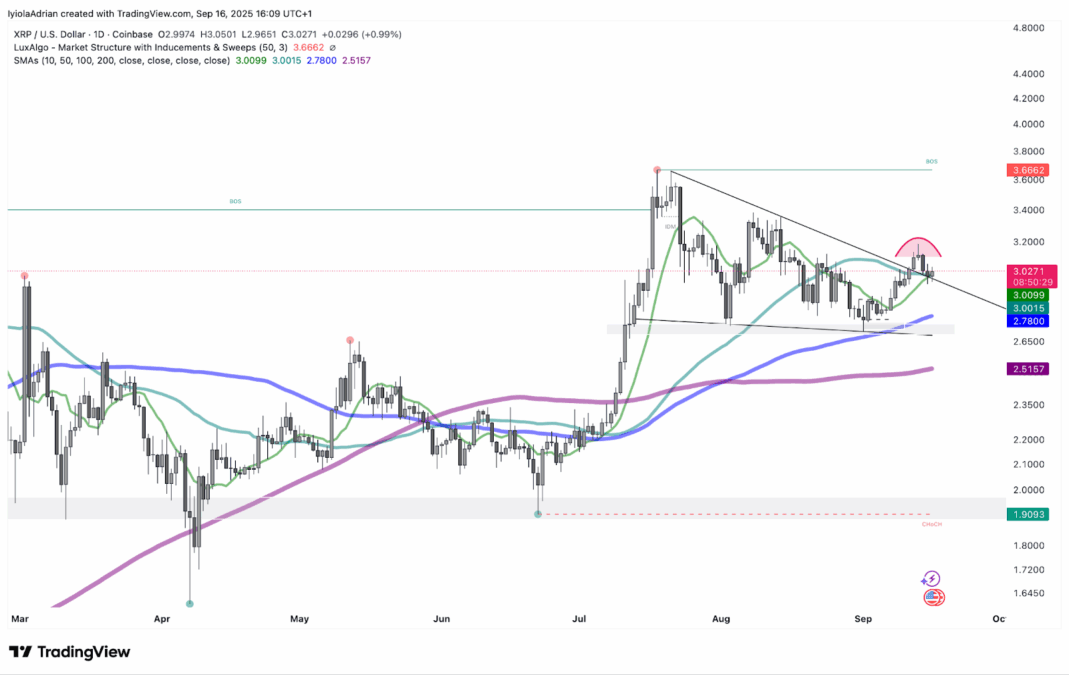
However, there was a recent breakout attempt above the triangle’s resistance which turned out to be a fakeout as buyers failed to hold momentum above the $3 mark.
Analysts warn that if XRP cannot reclaim $3, where its 50-day simple moving average sits, the price could slip to $2.70. If it could drop deeper, which may bring the 200-day simple moving average at $2.50 into pay, with further risk toward the triangle’s downside target NEAR $2.06, which is about 31% below current levels.
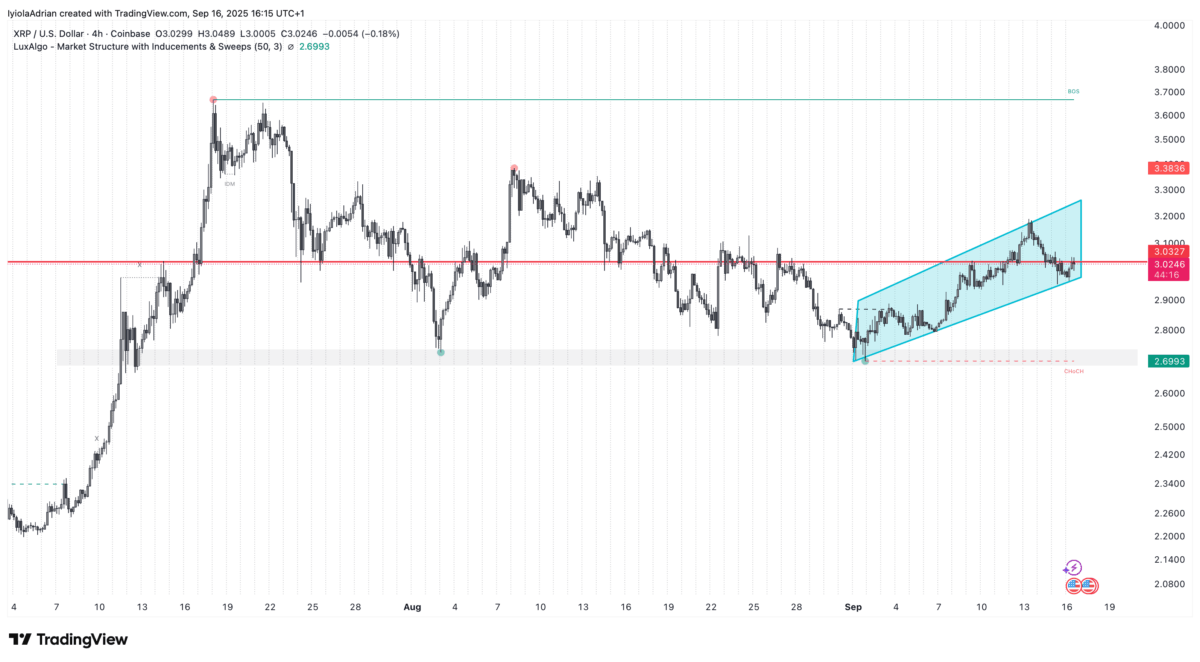
There’s another pattern, a bear flag on the 4 hour chart, which confirms that there might actually be a downside risk soon. If the price loses its support at $3, it could open the way for a slide down to $2.40. However, if the bulls can manage to push the price back to $3, a breakout over $3.20 could life XRP ot $3.40 and possibly retest $3.66
Whales are Cashing Out in Millions
Meanwhile, on-chain data shows that whales sold heavily as XRP briefly hit $3.10. According to data from Santiment, holders with between one million and ten million XRP dropped their balances sharply to 6.79 billion tokens, which is the lowest in the last six weeks. In the past 2 weeks, whales have sold over 160 million XRP, worth nearly $476 million at current prices.
Data from Glassnode also highlighted an increase in exchange reserves, with balances surging by 665 million tokens since late August to reach 3.94 billion. Whenever there’s a large supply on exchanges, it usually means more coins are available for selling, which could add extra pressure on prices.
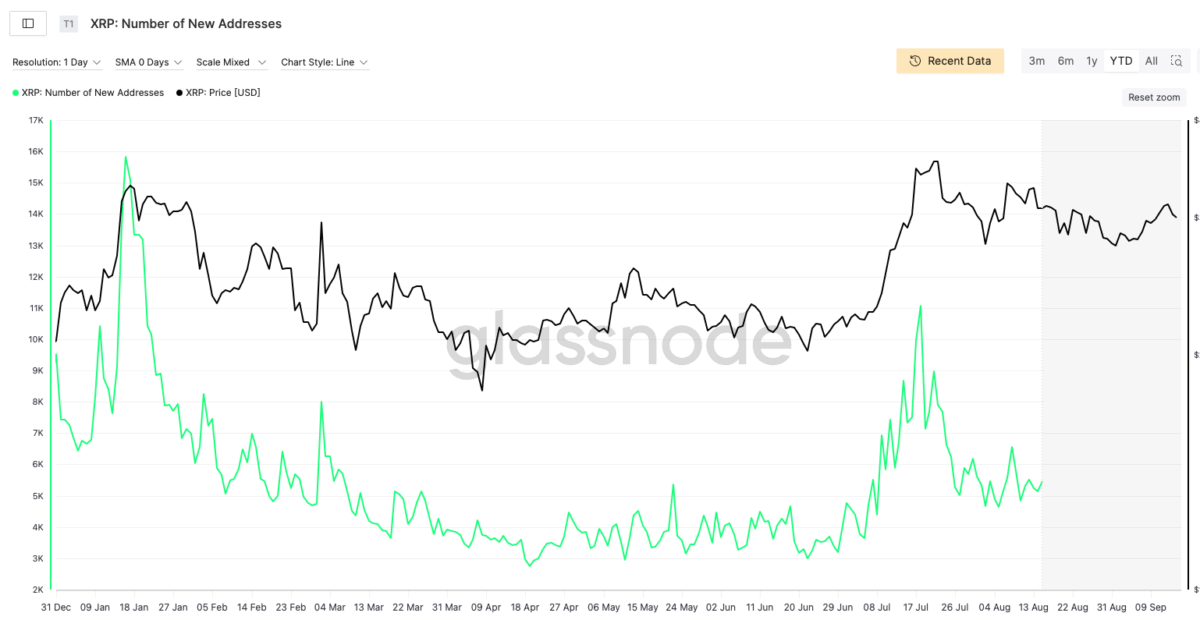
At the same time, the XRP Ledger has seen falling network activity. Daily active addresses have plunged from nearly 50,500 in July to about 21,000 now, according to CryptoQuant. New addresses also slipped from a high of 11,000 earlier this year to roughly 4,300.
Also Read: Pantera Capital Reveals $1.1 Billion Investment in Solana