Mantle Price Battles $1.40 Resistance as Rising Wedge Pattern Emerges - Key Breakdown Imminent?

Mantle's price action hits a critical inflection point—traders brace for volatility as technical patterns signal potential directional shifts.
Technical Tension Mounts
The $1.40 level morphs into a psychological battleground where bulls and wolves clash. Each rejection at this barrier fuels more aggressive positioning across derivatives markets. Market makers stack liquidity just beyond these key handles, waiting for the inevitable breakout—or breakdown.
Wedge Formation Dynamics
Rising wedge patterns typically foreshadow reversals, not continuations. The narrowing price range screams exhaustion—momentum divergences already flashing early warnings. Retail traders pile in while smart money quietly scales out positions near resistance. Classic setup, really.
Market Sentiment Shift
Funding rates tilt negative as leveraged longs get squeezed. Spot volumes decline while perpetual swap open interest spikes—the quiet before the storm. Whales reposition portfolios toward stablecoins, because nothing says 'confidence' like parking profits in digital dollars during uncertainty.
Regulatory Shadow Looms
Another week, another senator discovering cryptocurrencies exist and demanding 'investor protection' through legislation that would've prevented their own insider trading. The irony writes itself while markets ignore the noise and focus on pure price action.
Breakout or breakdown—this wedge resolves within 72 hours. Either way, volatility's coming to feast on overleveraged positions. Trade accordingly.
Mantle Forms Rising Wedge Pattern
The price action has formed a rising wedge pattern which typically indicates potential bearish reversal as buying momentum weakens despite higher highs.
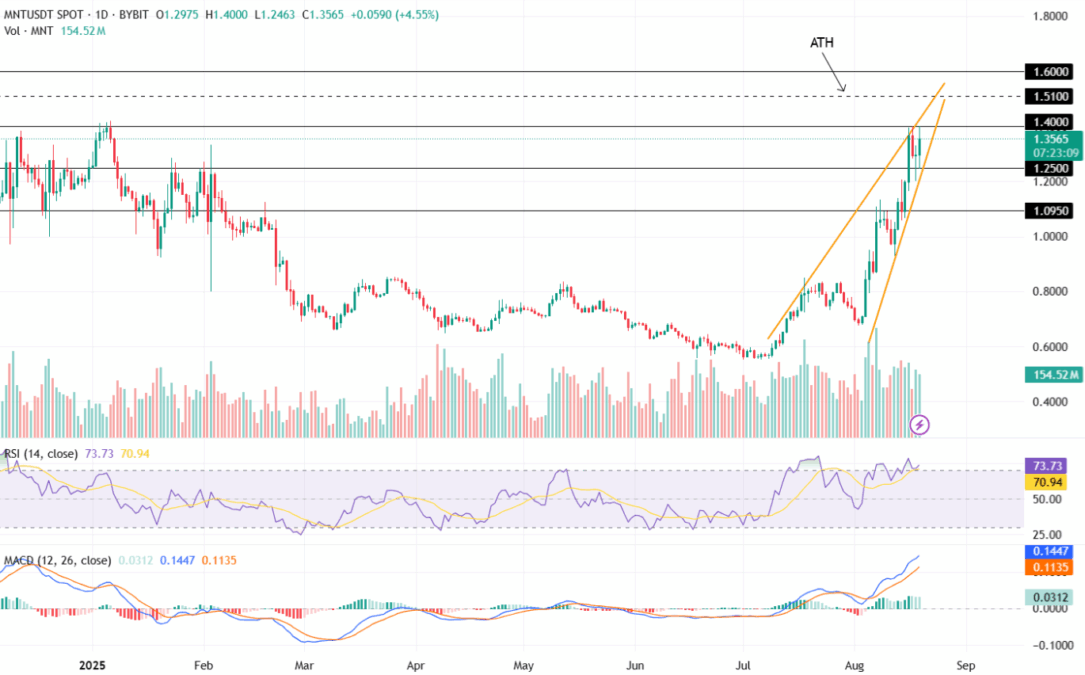
Since the beginning of August, there had been a sudden upward trend, with prices going from $0.06 to $1.4. The Relative Strength Index (RSI) stands at 73.73, indicating overbought conditions above the critical 70 threshold. Historical analysis shows RSI levels above 70 often precede short-term corrections as momentum reaches unsustainable levels.
The MACD indicator (Moving Average Convergence/Divergence) continues showing bullish momentum with the MACD line above the signal line and positive histogram bars, though traders should monitor for potential bearish divergence that could signal trend reversal.
Will MNT Price Break Its $1.40 Mark?
Suppose, bulls continue to drive the market, MNT could retest the crucial $1.40 resistance level, with a decisive break potentially targeting the previous all-time high of $1.51. Increased whale activity and investors participation at this point could push MNT towards these price levels.
On the negative side, any failure to sustain above $1.25 could trigger a pullback toward the $1.09 where a new buying interest may commence.
Layer 2 tokens have shown mixed performance recently amid broader market volatility, with investors focusing on technical levels rather than fundamental developments. Mantle’s ability to break through $1.40 resistance will likely depend on broader cryptocurrency market sentiment and volume confirmation.
The rising wedge pattern combined with overbought RSI conditions suggests traders should exercise caution despite recent gains. Volume analysis will be critical in determining whether any breakout above $1.40 represents genuine momentum or a false breakout prone to reversal.
Also Read: Bullish Raises $1.15B IPO Funds in Stablecoins
The crypto Times does not endorse or promote this digital asset in any manner. This article was created only for educational purposes. Make sure to “DYOR” as the market is highly volatile. New positions should be done by traders being careful and awaiting volume-backed breakouts.

