Conflux Skyrockets 200% – Bull Flag Signals More Gains Ahead in 2025

Conflux isn’t asking permission—it’s taking off. A 200% surge just formed a textbook bull flag, and traders are scrambling for the next move.
The Setup:
When a coin rips 200% and then coils into a tight pattern, it’s either reloading or exhausted. Conflux’s chart says reload.
Why This Matters:
Flags after parabolic moves often precede second legs—especially when liquidity’s flooding into altcoins (and let’s be honest, when isn’t it these days?).
The Punchline:
Break the flag’s upper trendline, and Conflux could mirror its initial rally. Fail? Well, even ‘sure things’ crash—just ask your local crypto hedge fund manager.
CFX Price Gains Momentum
The daily chart displays a sharp rally of Conflux at the beginning from July, which has been supported by the previously established price level of $0.0915. The CFX token has formed a bullish flag pattern and continues trading within it. This type of trend ideally suggests a strong long-term positive action for an asset. It suggests that the market is taking a breather and accumulating strength before potentially resuming its upward trajectory.
Moreover, there is increased volatility according to the Bollinger Bands (BB). At the moment, the price is at the upper band at $0.2508 which indicates that there is a possibility of the price being overextended. With this, the immediate support can be seen at $0.1962 that might serve as a key support.
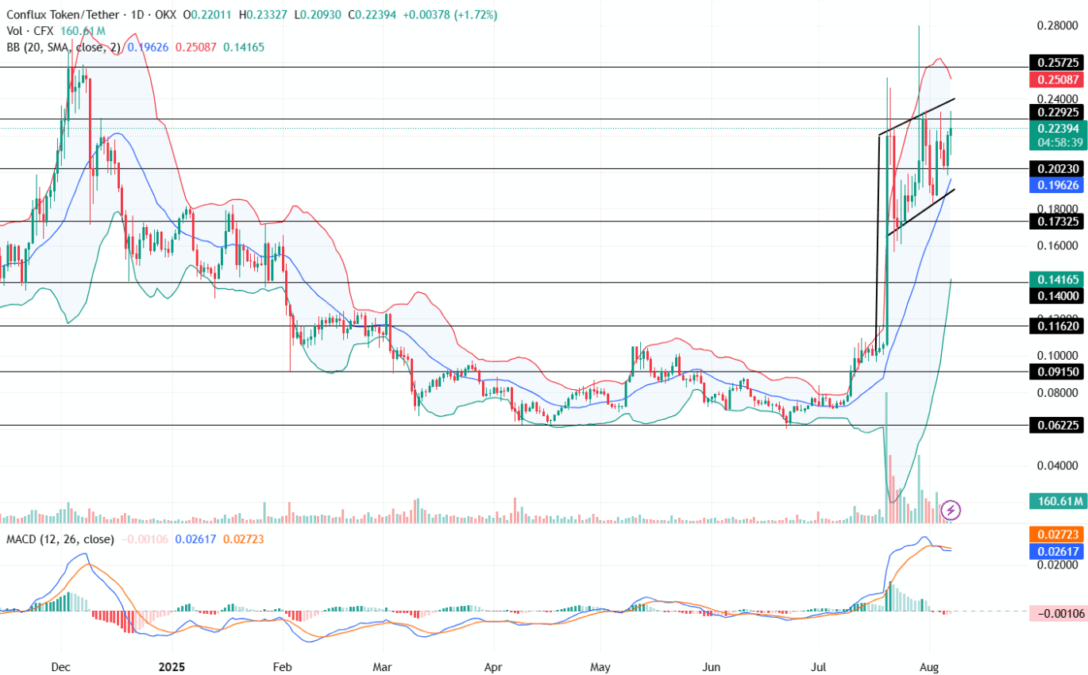
On the other hand, the Moving Average Convergence Divergence (MACD) indicator shows a decline in the red histogram, which means that its bullish trend is taking a downturn. With the signal line at 0.02617 and the MACD line at 0.02723. This can result in a short-term correction.
The volume indicator has also decreased gradually following the initial rise which suggests that the market volatility is on a constant rise. Furthermore, an increased volume push may help in keeping on the upward trend for the altcoin this month.
What’s Next for CFX?
Suppose the CFX price falls below the lower trendline, this could result in it retesting its support of $0.2023 or its lower support trend level of $0.1732. However, breaking through the flag pattern may drive CFX higher to the testing of the resistance at the level of $0.2572 and potentially the $0.28 area soon.
Although the set of a bullish breakout and the construction of the pattern may be considered the probable upside. The support area that traders have to watch is at the range of $0.1962 to $0.2023. A continued rally over the $0.2299 will confirm that bulls are still strong and this will position it to rise above to $0.26+.
Dogwifhat’s Iconic Pink Hat Goes to Auction for First Time Ever

