🚀 4 Memecoins Primed for 10X+ Gains Before July 2025 Ends

The memecoin casino is open for business—and these degenerate plays might just print life-changing money. Here's what's pumping (and what might actually survive the hype cycle).
### The Contenders: High-Risk, Higher-Reward Plays
Forget fundamentals—this is pure momentum trading. Network effects and meme magic are the only metrics that matter when hunting for the next PEPE-style moonshot.
### Liquidity = Life (And These Coins Have Pulse)
Thin order books need not apply. We're tracking tokens with enough trading volume to actually cash out those hypothetical gains—assuming you don't diamond-hand into oblivion.
### The Cynic's Corner
Let's be real—90% of these will crater faster than a crypto influencer's credibility. But that remaining 10%? They'll make the GME squeeze look like a savings bond.
BONK: Solid Breakout Above Key EMAs
BONK has shown a good bullish auction with a forceful breakout above its pivotal 200-day exponential moving average price of $0.00001855. The memecoin has been trading at an encouraging price of approximately $0.00002254.
This marks a big jump for the memecoin which has attracted attention of traders. As revealed in the price action, BONK has managed to reaffirm the 200-day EMA as the line of support after a long consolidation below the critical technical indicator.
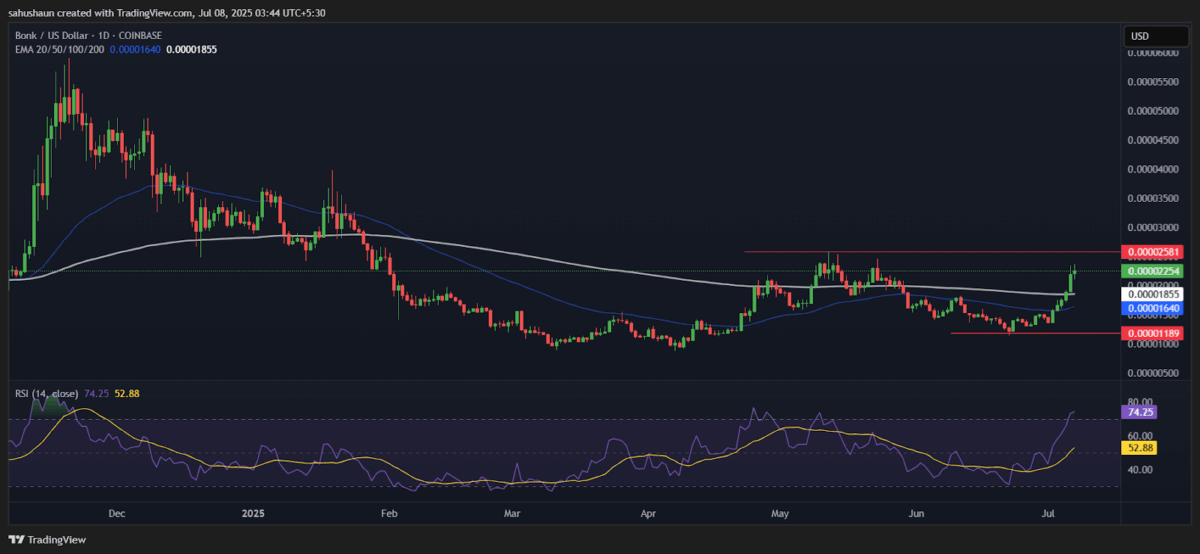
Additional support is being offered by the 50-day EMA at $0.00001641 forming a bullish arrangement between the two moving averages as the shorter one is below the longer one. This pattern is an indicator of a maintained bullish force.
The Relative Strength Index at 74 confirms the bullish signals as it is heading to the overbought level. This indicates there is strong buying power but no indication of a NEAR reversal.
The next major resistance is at the price of $0.00002581 as this is considered a level of key resistance in the context of further growth. A breakout above this point WOULD be the cause of another acceleration to higher objectives.
The 200-day EMA has now been recovered to a critical support level of $0.00001855 and any retracement to this point will provide relevant chances to buy the trend continuation. The larger technical trend is still bullish on BONK, with momentum signals and moving average pattern keeping the recent trend in an ascending direction.
PENGU: Dominating the Top Gainers
Pudgy Penguins (PENGU) is showing a good bullish momentum, and the price is trading at $0.01193 at the time of writing this and is trading the key moving averages. The memecoin has developed a strong uptrend pattern that has several technical indicators backing further positive price movement.
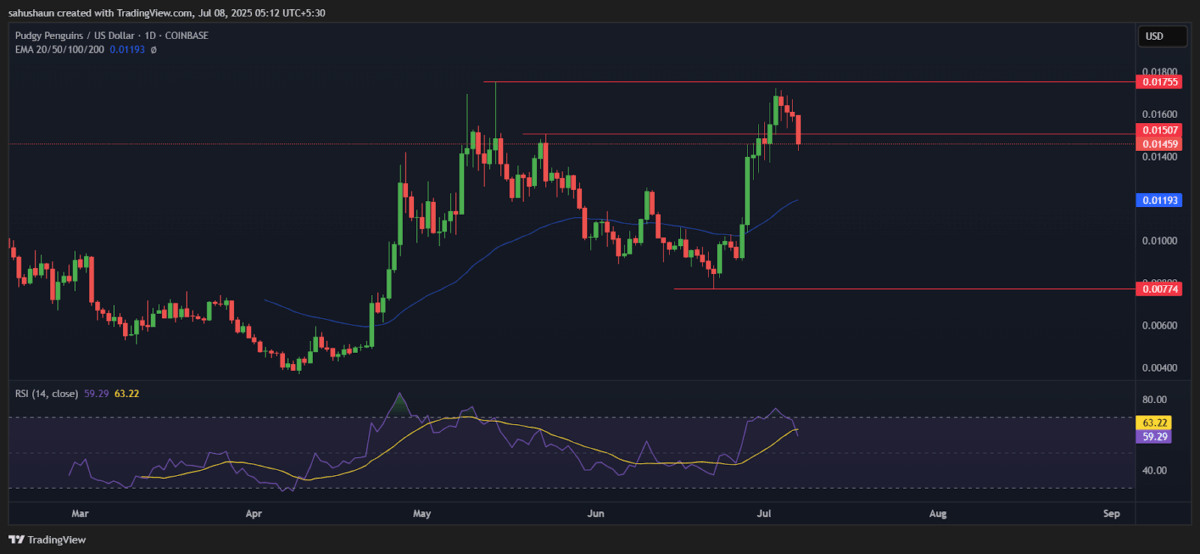
The price action indicates that PENGU is trading well above the 50-day EMA at 0.01193 which is a sign of a strong bullish sentiment at various timeframes. The large gap between the current price and the longer-term moving average indicates that this asset has been appreciating considerably and is still in good momentum.
The RSI indicator is at the level of 59, and it is in the neutral-to-bullish zone; it leaves space to MOVE upwards without going into the overbought area. This level indicates that the recent rally is sustainable and does not put too much speculative pressure.
The chart shows a clean retracement setup with the important levels marked within the recent price range in Fibonacci terms. The 38.20% Fibonacci level seems to be acting as the immediate support, and the higher retracement levels can be used as the possible resistance levels to any further upside.
The main resistance is marked at $0.0175 as a critical point that bulls should breach to proceed with further progress. The negative aspect is that support levels are set at $0.013 and $0.012 and this offers several potential buying zones in case of any corrective periods. Although a minor correction is possibly taking place, the general trend pattern is overwhelmingly bullish.
SPX6900: Ready to Explode
SPX6900 is showing good bullish momentum and is trading at $1.148 with an attractive technical setup. The memecoin has gained a strong base above both the critical moving averages, the 50-day EMA at $1.481 is acting as dynamic support above the longer-term 200-day EMA at $0.894. This golden cross pattern shows that the price movement is strong and has a good trend formation.
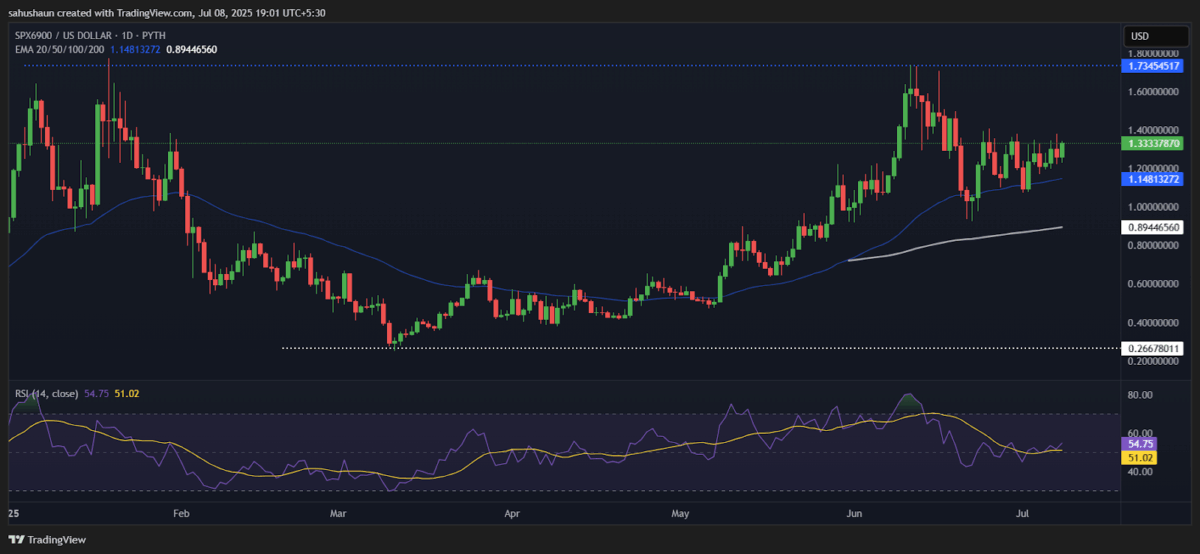
The price action indicates that there is a steady formation of higher lows, especially since the March-April consolidation period formed a solid base at around $0.50-$0.60. The latest break above the psychological resistance of $1.00 shows that there is new buying interest and institutional accumulation.
The RSI of 51.02 shows neutral momentum and has an upside potential, which implies that the rally is not overextended. The present price is above important moving averages, which gives a bullish bias, and the immediate resistance target at $1.70 is an important breakout point.
Once the $1.70 resistance is broken successfully, it may lead to a fast-paced movement towards the $2.00 psychological mark that will reflect a 75% upside potential from the current price. The bullish moving average formation offers several layers of downside support, and this is a desirable risk-reward scenario to momentum traders.
Fartcoin: Preparing for A Robust Rally
Fartcoin is in the consolidating phase at the $0.8688 level, with the price hovering around the 200-day EMA. The memecoin has been moving sideways following a major rally that reached its peak in May and showed normal post-surge consolidation behaviour.
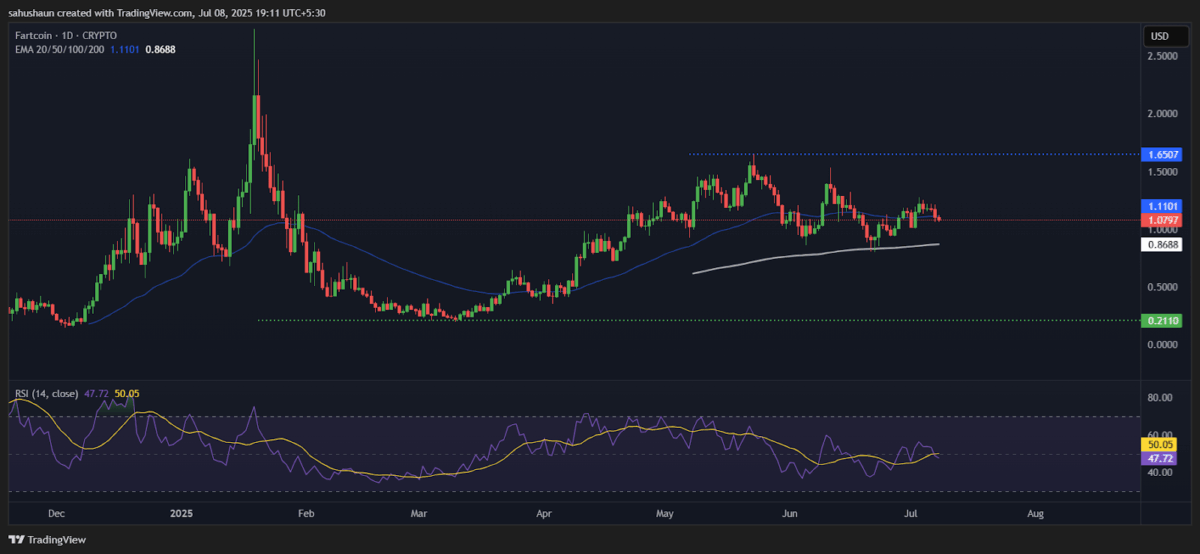
The technical configuration shows a mixed signal where the current price is below the 50-day EMA at $1.11, hinting at a short-term bearish pressure. Nonetheless, the RSI of 50.05 indicates that there is no momentum and it is not overbought, allowing the potential to move upwards.
The most important resistance point to monitor for FARTCOIN is at $1.16 that may become the trigger of the next bullish cycle. Any breakout beyond this level has the potential of propelling Fartcoin to the $2.00 target, which is a big upside potential at the current levels.
The performance indicators show the volatile nature of the cryptocurrency, having surged an impressive 685% between March and May. Such an explosive growth trend indicates high underlying interest and speculative momentum.
The present consolidation period seems to be creating a platform for a possible breakout movement. To confirm a resurgence of bullish momentum toward higher price targets, traders must watch out for volume growth and the continued movement above the 50-day EMA.
Final Thoughts
The four memecoins have interesting technical configurations, and their bullish momentum indicators are high. The EMA breakout of BONK, the long-term uptrend of PENGU, the golden cross of SPX6900, and the consolidation period of Fartcoin all indicate high upside potential.
Nevertheless, even with risk management in place, investors should remain cautious, since memecoins are very volatile and speculative investments that need to be carefully positioned.
Also Read: Fartcoin Price Drops 8%, Will it Crash Below $1?

