Bitcoin Cash Primed for Explosive Rally: $625 Target in Sight?

Bitcoin Cash isn't whispering—it's screaming bullish signals. After weeks of consolidation, the charts suggest a breakout that could send shockwaves through crypto portfolios.
Technical indicators flash green
RSI coils like a spring, MACD lines converge—classic setup for a volatility surge. The $625 resistance level now looks more like a pit stop than a ceiling.
Market sentiment shifts
Traders are flipping from 'wait-and-see' to 'FOMO mode' as Bitcoin Cash outperforms major altcoins. Even Wall Street's crypto skeptics are sneaking glances at the charts—between martini lunches, of course.
Make or break moment
Either this rally confirms Bitcoin Cash as the people's champion of payments crypto, or it becomes another 'should've sold at the top' cautionary tale. One thing's certain: the next 72 hours will separate the diamond hands from the paper portfolios.
Bitcoin Cash Derivatives Data Shows Rising Optimism
As per the latest data of CoinGlass, the BCH Open Interest surged by approximately 5% in the last 24 hours, resulting in it reaching a total of $546.98 million. Further, increasing buying action suggests increasing optimism for the Bitcoin Cash token.
The long/short ratio has risen to 1.0644, while the total volume is at $1.10 billion, a change of +26.95%. By evaluating the market trends, the BCH tokens favor a bullish wave in the NEAR future.

Since its low of $384 that was recorded on April 9, 2025, the Bitcoin Cash Price has rallied to $518, a surge of approximately 93% in a span of just 83 days. When compared to historic sentiments, a similar action was recorded between November and December 2024. Back then, BCH price rallied from $320 to $625 showing great investment opportunities for bulls.

BCH Price Hints Bullish Breakout Rally?
With a positive inflow for three consecutive days, the BCH price has breached its important watch zone above the $490 and has reclaimed the $500 mark. Adding to this, it is on the path of retesting its resistance trendline of the ascending channel pattern in the daily time, highlighting rising positive action.
On the other hand, since its successful retest around the $384 level since early June, this altcoin has constantly formed higher lows in the daily time frame. It signals greater buying power in the market.
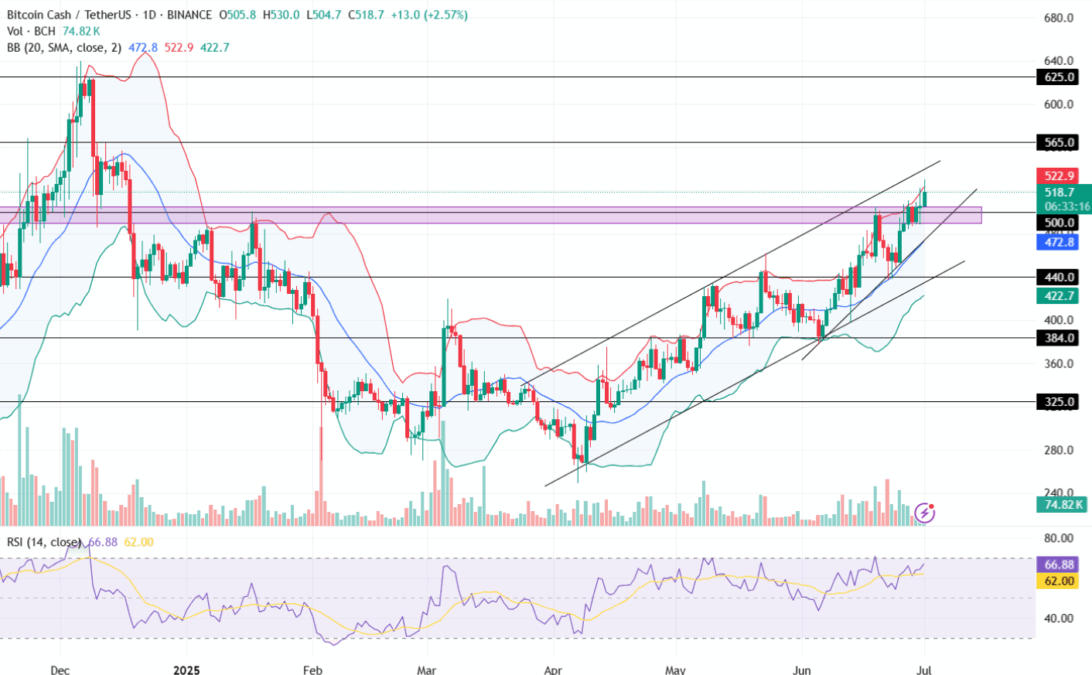
In the Bollinger Bands (BB) indicator, the Bitcoin Cash (BCH) is trading near the upper band ($522.9), indicating a strong bullish momentum. Moreover, the widening bands reflect higher volatility while the midline (blue) at $472.8 acts as a support.
The Relative Strength Index (RSI) is currently at 66.88 and is heading toward the overbought range of 70, indicating growing bullish sentiment, but also suggests a potential reversal zone. Notably, a crossover above 70 could confirm increasing strength, but a rejection could trigger short-term corrections.
The BCH price could head toward its important resistance level of $565 within a short period of time if the bullish sentiment sustains. Furthermore, increasing positive action could set a stage for it to push its value toward its upper target price of $625 this month.
Conversely, a bearish reversal may pull the value toward its important support of $500 this week. Additionally, rising negative sentiment may pull the bitcoin Cash price to plunge toward its lower support trendline of $440.
BREAKING: SEC Approves Grayscale ETF with BTC, ETH, XRP, SOL, ADA

