Bitcoin Stumbles Post-FOMC, Ethereum Primed for Surge as XRP Charts Warning Signs – June 20 Market Pulse

Markets flinch as Bitcoin takes a post-FOMC hit—traders scramble while institutional players yawn through another volatility cycle. Meanwhile, Ethereum gathers steam at key resistance levels, teasing a breakout that could leave maxis crowing.
XRP? Painting another textbook bear flag—because when has following the herd ever burned crypto traders before?
Pro tip: The 'smart money' is too busy overleveraging on memecoins to notice these technicals anyway. Just don't check your portfolio before coffee.
Bitcoin & Ethereum Sell Pressure Continues
According to data from CoinMarketCap, Bitcoin is currently trading for $104,245, a 3% drop recorded in the last 24 hours. Bitcoin has been dropping fast since May 22, when it hit its new all-time high of $111,000. It has been printing red candles with strong momentum ever since.
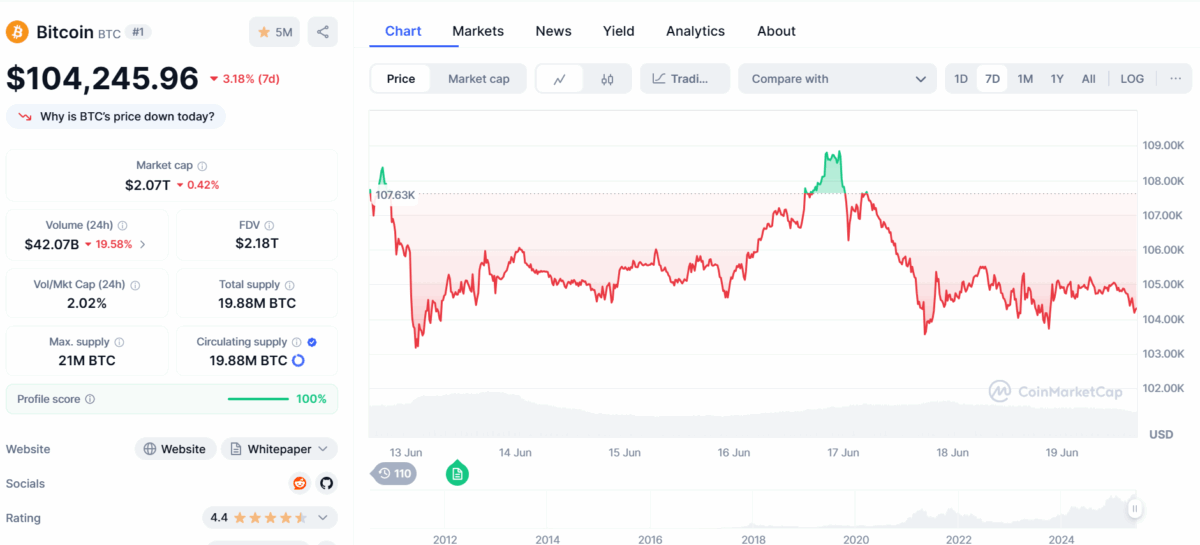
On the daily chart, the overall trend is bearish. To some analysts, this is just a short-term retracement for another possible rally. But right now, the price is creating a series of lower lows and strong sell momentum after tapping off a supply zone at $110,000.

The next swing low is at $102,838. If the price breaks this level, it could fall to $123k or even $100k. This zone has a demand that could give bitcoin the liquidity it needs for another rally. Moreover, the Relative Strength Index RSI is at 40, which means the price still has room to sell before another surge.
Meanwhile, Ethereum has been consolidating between $2,333 and $2,866 since May 2025. Right, the bulls are controlling the market with this sideways consolidation forming a bearish flag pattern on the 4-hour timeframe.
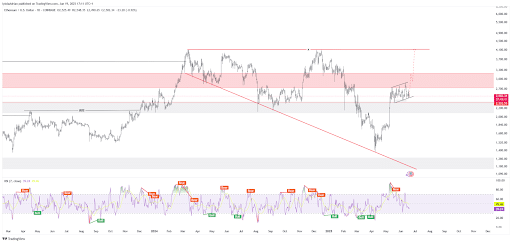
However, there’s still hope if the price could break above the pattern. If that happens, we might see a climb to $3 or possibly $4.2 if the momentum is strong enough. If not, we might see more drop in price, possibly to $1.6. At the time of writing this report, ETH is trading for $2,500, which is just a 0.34% dip today, but it has dropped 8% over the last 7 days.
XRP is at a CrossroadsXRP seems to be showing a similar price action to Ethereum. It has also been consolidating sideways for a while. This is visible on the daily timeframe as the resistance zone on $2.69 and the support zone at $1.9 keep rejecting the price. XRP has been ranging between this zone since November last year.
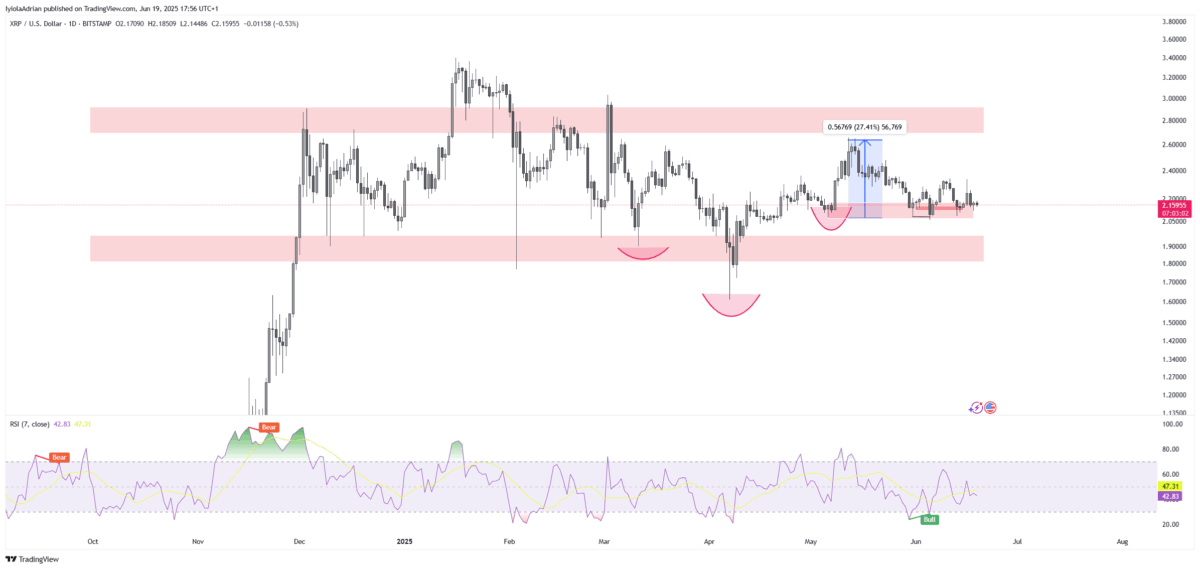
The price broke out of an inverse head and shoulder pattern recently. It rallied up to $2.6 but dropped down to retest the May 6 daily candlestick that broke the pattern. However, the market has been consolidating in this zone instead of pushing up from it. On May 16, the price tried to surge on June 16, but the price was rejected. This might mean there isn’t enough liquidity in the zone.
However, if the market disrespects it, it could drop to retest the resistance zone at $1.9 before another zone. But if the zone later gets momentum, XRP could rally up to $3 or more. Right now, the price is holding steady at $2.15.
Top Gainers and Losers Today| Gainers | Losers |
| Sei (SEI): +13.92% | Fartcoin (FARTCOIN): -8.11% |
| OKB (OKB): +10.41% | Story (IP): -7.91% |
| Mantle (MNT): +9.49 | Hyperliquid (HYPE): -6.12% |
The global crypto market capitalization is currently at $3.2 trillion in valuation. This is a 0.23% drop in the last 24 hours, with $95 billion in trading volume.
Also Read: TRUMP Quietly Cuts Crypto Stake from 60% to 40% in WLFI

