Ethereum’s $3K Comeback: Can ETH Defy Gravity in June 2025?

Ethereum bulls are licking their wounds—but not counting themselves out. As June 2025 looms, the crypto old guard whispers about a $3,000 resurrection play. Forget ’slow and steady’—this is crypto, where triple-digit rallies happen between coffee breaks.
The Setup: Institutional money’s been playing hide-and-seek with ETH since the last bull run. Layer-2 adoption is up, gas fees are down (relatively), and staking yields still beat your bank’s ’high-yield’ savings account (which pays less than inflation—classic finance).
The Wildcards: Regulatory shadowboxing continues, while Bitcoin ETF flows suck oxygen from altcoins. But Ethereum’s defi ecosystem keeps shipping—even if half the projects are Ponzi schemes dressed in APY drag.
Bottom Line: $3K isn’t just a number—it’s a psychological battleground. If ETH claws back, it’ll be on pure network effect grit. If not? Well, there’s always the next cycle... or the one after that.
A Look at ETH’s On-chain Sentiments
As of 29th of May the unique addresses of ethereum tallies to 321,162,670. Reportedly, this is an increase of 4,356,762 when compared with data of 1st of May which was 316,805,908. Notably, this is a jump of 1.372% Month-on-Month (MoM).

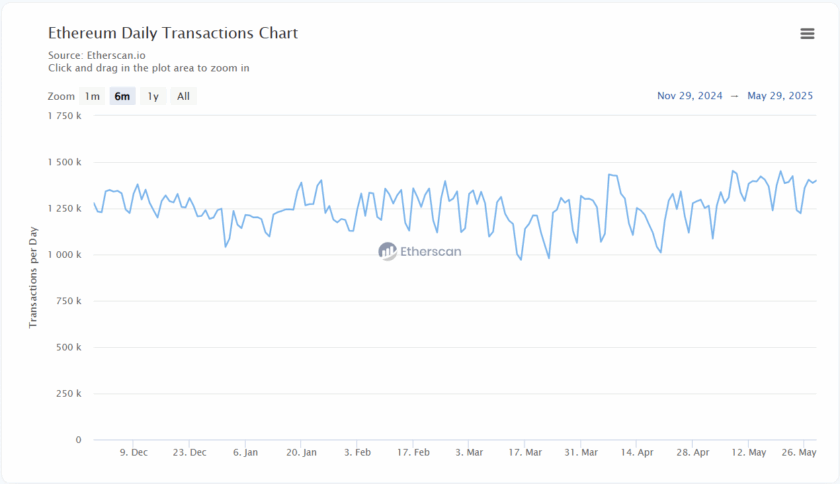
On the other hand, the daily transactions of Ethereum token ranged between 1,250k and 1,500k throughout the month. This indicates an increase in the adoption of this ecosystem in the real-world financial system.
As of today, the Ethereum ETFs have recorded 20 active trading days out of which it experienced 14 positive trading days, 5 negative trading days, and only one neutral trading day. When adding the positive trading days, it has added a total of $607.07 million, whereas when adding the negative days, it has lost $113.13 million.
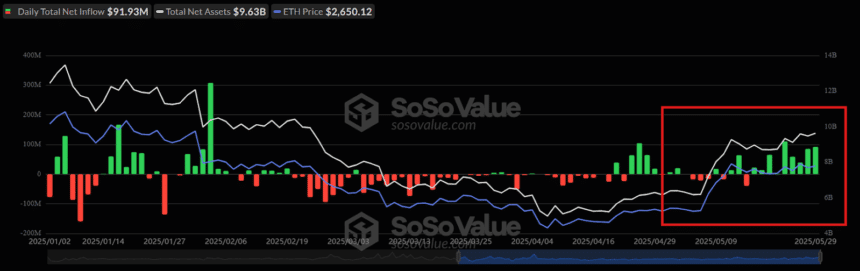
By evaluating the total market flow, the ETH ETF is on the verge of concluding the month with a positive netflow of $493.94 million. With this, the Ether ETF has maintained a 9 day inflow streak.
Ethereum Price Forms Bullish Trend in 1D Time Frame
Despite recording a drop of over 3% today, the ETH price has maintained its value above the $2,500 mark, indicating a strong support around that range. Notably, it has jumped approximately 45% over the last 30 days and has a market capitalization of $310.48 billion. With this, it has a market dominance of 9.399%.
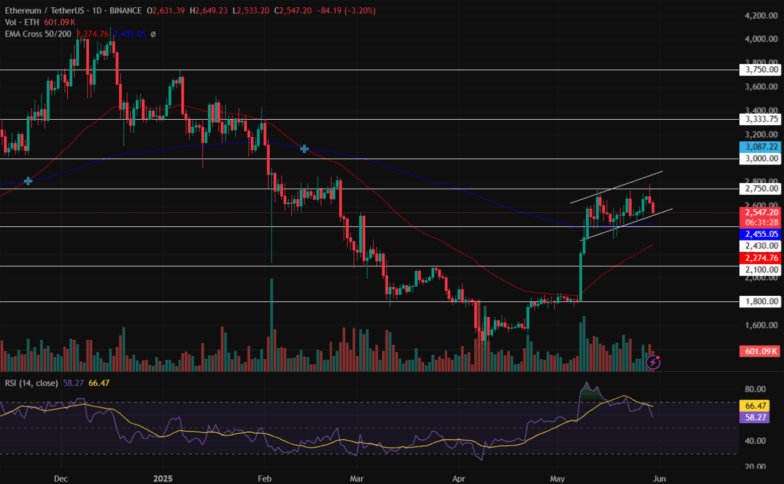
The Relative Strength Index (RSI) has failed to breach the overbought range in the daily time frame, resulting in it recording a sharp drop toward the neutral point. Moreover, the average trendline acts as a strong resistance to the price trend, suggesting a negative outlook next week.
The Cross EMA 50/200-day displays a bullish rise in the Ethereum price chart and may experience a Golden Cross in the upcoming time. This suggests a mixed price action for the altcoin in the cryptocurrency market.
Will ETH Coin Price Hit $3k This June?
Maintaining the value above the support trendline of the channel pattern could result in it heading toward its $2,750 mark. Adding to this, a sustained bullish action could result in it heading toward its upper price target of $3k during the upcoming weeks.
On the contrary, if the bears dominate the crypto market, the value of Ethereum could drop toward its low of $2,430. Suppose, the crypto space experiences increased liquidation at that point, this may result in the largest altcoin plunging toward its lower support zone of $2,100 in June.
Also Read: Bitcoin price prediction June 2025: BTC to Smash $120K Goal?
