XRP Teeters on the Brink: $2 Plunge Looms as Inflows Dry Up

XRP’s bullish momentum hits a wall—the once-steady inflow streak has snapped, leaving the token vulnerable to a nosedive toward $2.
Market watchers are eyeing the charts like nervous ICU nurses, knowing full well that crypto ’support levels’ are about as reliable as a banker’s handshake promise.
If the sell-off accelerates, we could see a classic crypto cascade—where paper hands meet panic trades in a race to the bottom. Buckle up.
XRP Suffers Outflows Despite Inflow for Other Digital Assets
XRP’s 80-week inflow streak just ended last week. According to CoinShares data, XRP saw an outflow of $37.2 million in the past week. On the other hand, other crypto asset investment products saw inflows, posing threat to XRP’s dominance in the market.
Digital Asset Investment products experienced an inflow of $3.3 billion over the past week. With this, it has witnessed a positive inflow for 6 consecutive weeks and a total FLOW of $10.5 billion. Moreover, the Year-to-Date (YTD) inflow has now achieved a new high of $10.8 billion.
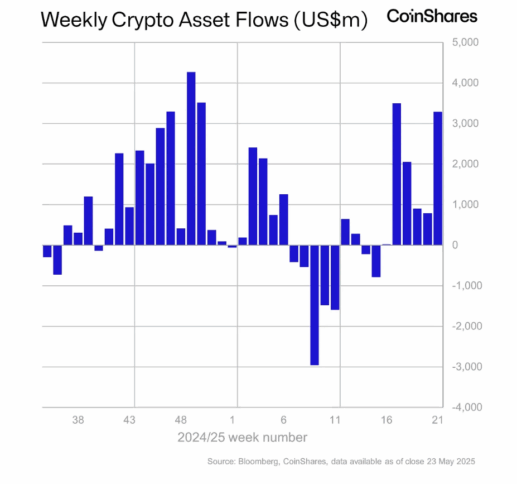
Adding to this, the total assets under management (AUM) has now peaked at an all-time high (ATH) of $187.5 billion during the previous week. Furthermore, the United States of America (USA) dominates the market with a weekly inflow of $3.2 billion.
Following this, Germany, Australia, and Hong Kong ranked in a descending order with inflows of $41.5 million, $10.9 million, and $33.3 million respectively. On the other hand, the Swiss investors used the recent price action as an opportunity to book in gains, resulting in $16.6 million worth of outflows.
XRP Price Prediction For This Week
Xrp price today has recorded a jump of 2.25% with a trading volume of $2.01 billion, a change of +10.85% during this period. Despite recording a neutral return over the last seven days, this altcoin has jumped over 6% in 30 days, indicating a long-term bullish action. With a market cap of $137.03 billion, it has a market cap of 3.968%.
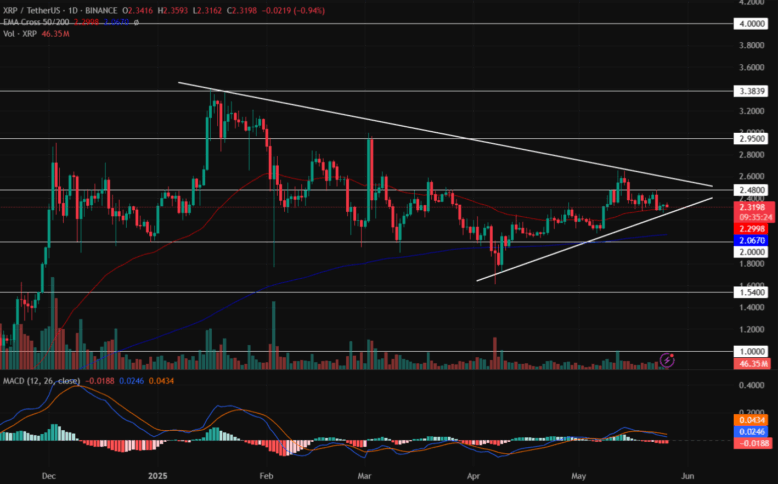
The Moving Average Convergence Divergence (MACD) displays a constant red histogram in the daily time frame with its 12 & 26-day average witnessing a negative action. This hints at a negative price action for the 2nd largest altcoin this week.
On the other hand, the 50-day EMA acts as a strong support to the XRP coin price in the 1D time frame. Moreover, the 200-day EMA records a major support around the $2 mark. This indicates a high possibility of a bullish reversal in the upcoming time.
Will XRP Ever Rise Back Up?
Maintaining the value above its support trendline could set the stage for Ripple price to retest its resistance level of $2.50. Moreover, if the bullish sentiment intensifies, this could result in this altcoin breaking out of its triangle pattern and heading toward its upper price target of $3 this month.
Conversely, if the bears outrun the bulls, this could result in the XRP crypto price retesting its immediate support level of $2.25. Adding to this, if the bulls fail to regain momentum at that point, then the price of XRP token could plunge toward its lower support level of $2 during the coming days.
Also Read: Breaking: TRUMP Media Plans $3B Raise for Crypto Investment
