Bitcoin Bulls Charge: BTC Rally Gains Momentum Amid Lingering Market Risks

Bitcoin's bulls are back in the driver's seat—pushing prices upward while navigating familiar potholes.
Market Momentum Builds
Buyers pile in, driving renewed optimism across crypto exchanges. Trading volumes spike as institutional players dip toes back into digital waters.
Risk Factors Linger
Regulatory shadows loom—same old story, different chapter. Volatility hasn't magically vanished; it's just taking a coffee break.
Technical Breakout Underway
Key resistance levels crack under pressure. Chart patterns suggest upward trajectory, but remember: past performance guarantees nothing in this casino masquerading as an asset class.
The climb continues—for now. Whether this rally has real legs or just expensive prosthetics remains the billion-satoshi question.
Technical Analysis
By Shayan
The Daily Chart
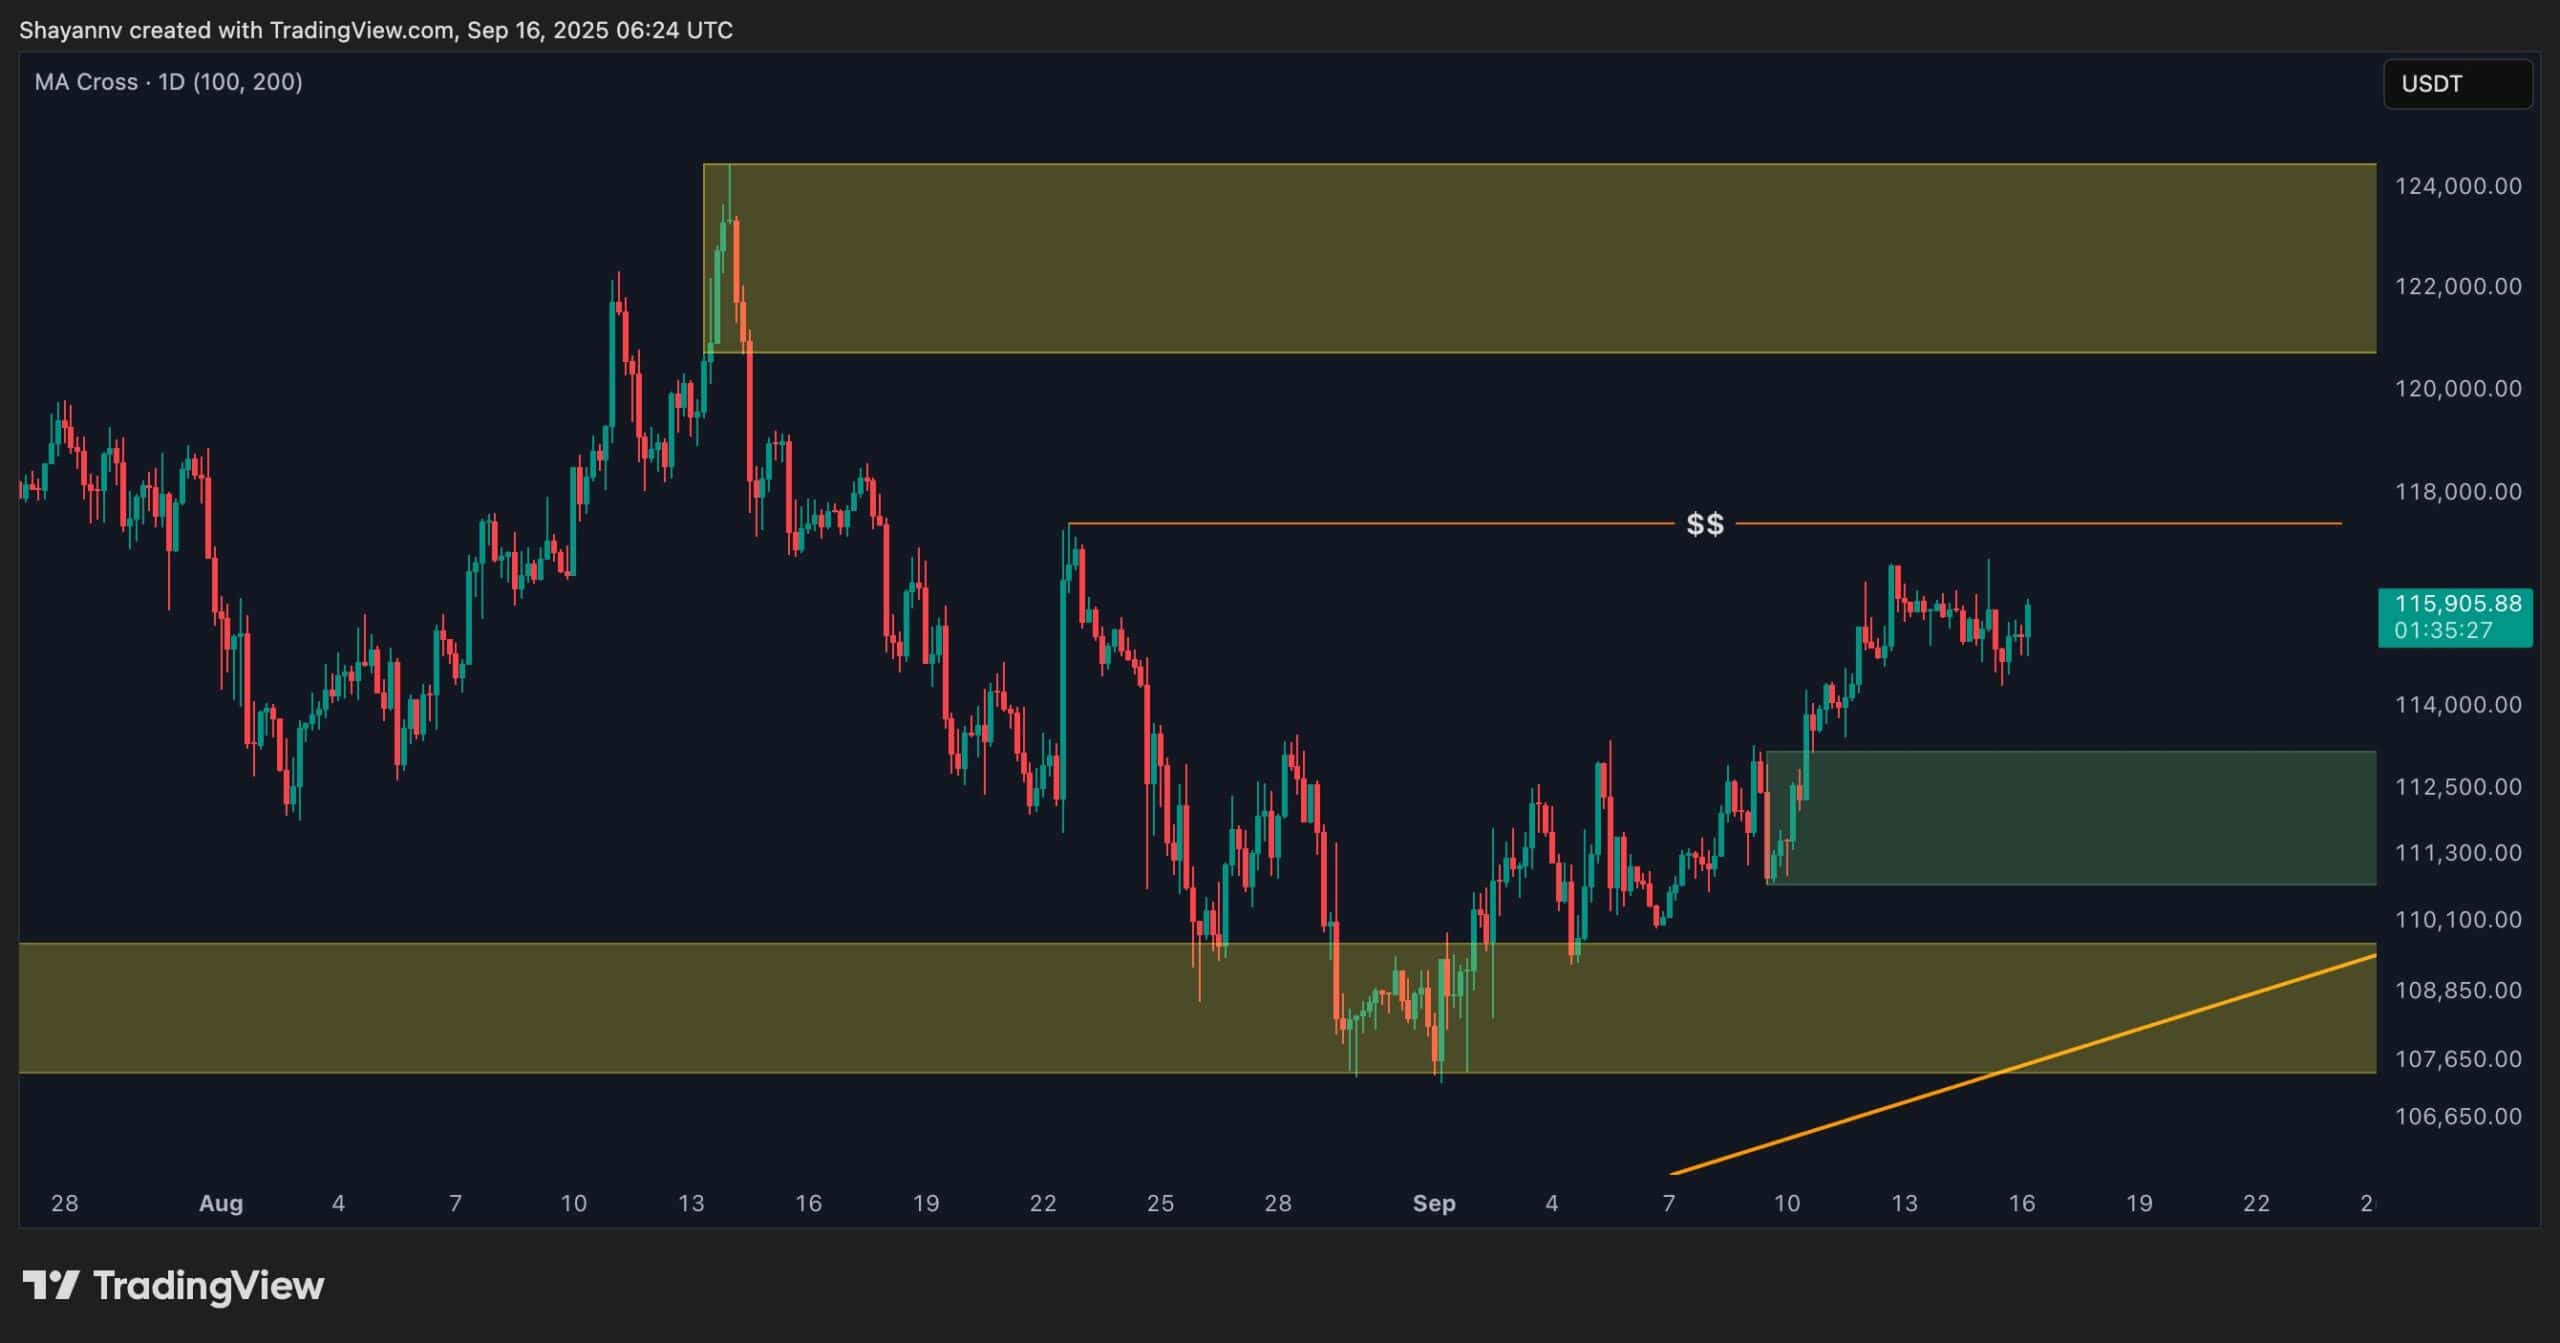
On the daily timeframe, BTC is trading inside a well-defined range between $107K support and $123K resistance. The recent influx of buyers at the lower boundary fueled a sharp rebound, allowing the asset to reclaim the 100-day moving average and advance toward the range high.
This structure reflects renewed demand, as participants defend key supports. The decisive trigger now lies at the $123K upper boundary. A breakout above this level WOULD not only mark a new all-time high but also confirm bullish continuation for the broader trend.

The 4-Hour Chart
Zooming into the 4-hour chart, Bitcoin has rallied close to the $117K swing high, where notable buy-side liquidity is positioned just above. While the bullish structure remains intact, a short pullback into the decision-point demand zone at $110.7K–$113.1K cannot be ruled out.
This area has previously attracted strong buying interest, and a successful retest would reinforce the bullish case. If buyers defend this zone and reclaim momentum, the liquidity above the swing high could act as a magnet, potentially fueling a continuation move toward higher levels.
On-chain Analysis
By Shayan
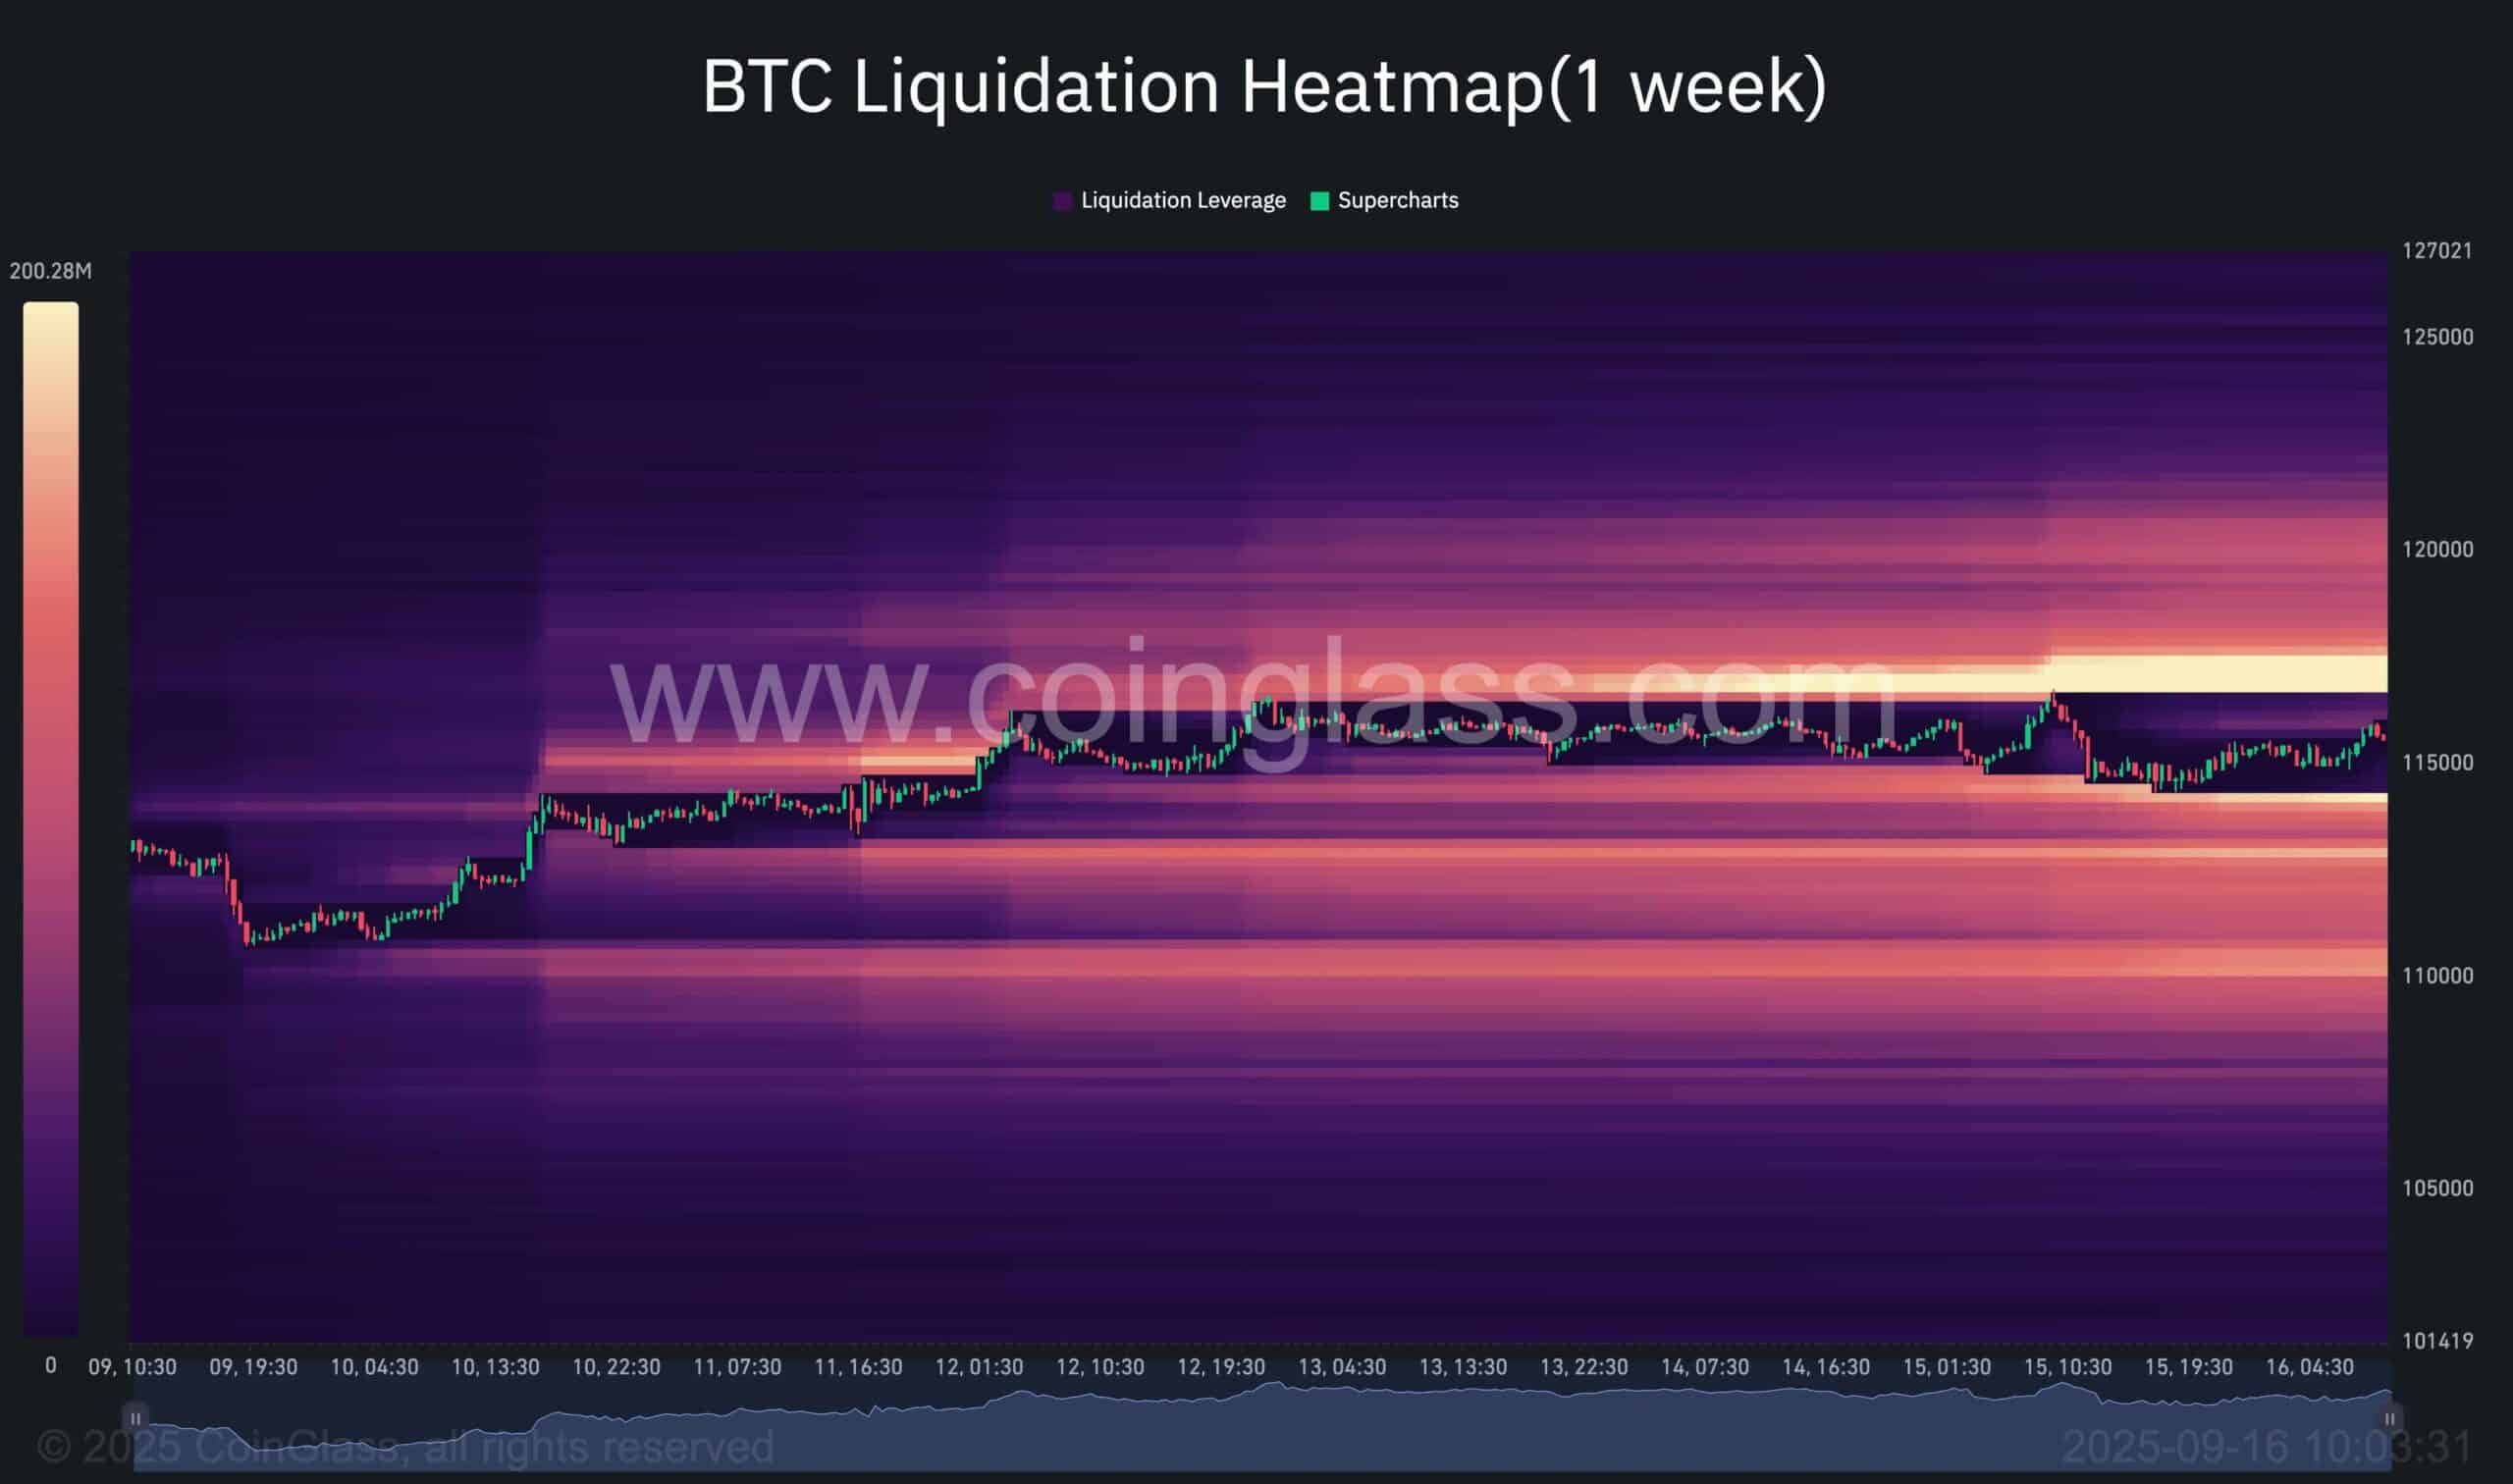
The 1-week bitcoin liquidation heatmap highlights a dense cluster of liquidations sitting just above the recent swing high, aligning with the liquidity discussed in the 4-hour chart.
Markets often accelerate into such zones, as stop orders and forced liquidations amplify momentum. A clean push through the swing high would likely trigger this cascade, forcing shorts to cover and driving price higher.
This reinforces the outlined scenario: while a brief pullback into demand remains possible, the path of least resistance increasingly points toward liquidity absorption above the swing high, a setup that could serve as a catalyst for continuation toward new highs.