DOGE Shatters Triangle Formation: Is $0.31 the Next Target?

DOGE just blasted through a critical technical pattern—traders are scrambling as the meme coin defies expectations once again.
The Breakout Momentum
No gentle drift here—DOGE ripped straight through resistance levels that had contained it for weeks. That triangle pattern? Obliterated in a classic crypto surge that left analysts scrambling to update their charts.
Targets in Sight
With the pattern smashed, technical projections now point toward the $0.31 zone. That's not just hopeful thinking—it's the measured move calculation from the triangle's formation. Of course, in crypto, even textbook patterns come with the standard disclaimer: past performance guarantees absolutely nothing—except maybe some entertaining volatility.
Market psychology shifts faster than a crypto influencer's allegiance when the charts start moving. Retail FOMO meets institutional interest in the weirdest financial dance of our generation. Just remember—what triangles giveth, market makers can taketh away in the blink of a red candle.
Symmetrical Triangle Breakout
Dogecoin (DOGE) has broken out of a symmetrical triangle pattern after several weeks of consolidation. The breakout took place NEAR the $0.24 level, sending the price higher and confirming a bullish setup.
At the time of writing, Doge is trading at $0.25, supported by a 24-hour trading volume of more than $3.15 billion. The token has gained 3% in the last day and is up 16% over the past week.
Fibonacci levels are being used to track the next targets. The move above the 0.618 retracement at $0.24 has added weight to the breakout. The following levels to watch are $0.253, $0.27, $0.3, and $0.32. crypto analyst Ali Martinez stated,
Dogecoin $DOGE breaks out of a triangle, targeting $0.31! pic.twitter.com/QLKBUHvMeN
— Ali (@ali_charts) September 10, 2025
Looking at longer trends, another analysis by Javon Marks focuses on Dogecoin’s repeating cycle over several years. His chart shows that DOGE often consolidates in broad triangle or wedge patterns before breaking higher. This was seen between 2014 and 2017, and again from 2018 to 2020, which led to the 2021 run that pushed DOGE to a record near $0.73.
The current structure, which began forming in 2022, shows a similar consolidation phase with higher lows supporting an ascending base. Marks suggested this setup could result in a MOVE beyond the previous all-time high. He noted,
$DOGE (Dogecoin) to new All Time Highs in a nearly +200% gain ! pic.twitter.com/6uxRZj8i5j
— JAVON![]() MARKS (@JavonTM1) September 10, 2025
MARKS (@JavonTM1) September 10, 2025
Ichimoku-Based Uptrend Signal
Analyst Trader Tardigrade shared an Ichimoku view of Dogecoin’s daily chart. On September 9, the Chikou Span crossed above the price, generating a bullish confirmation. He explained,
“Chikou Span (Lagging Span) crossing above price, indicating a confirmation of uptrend. A long trade of $DOGE suggested.”
According to his analysis, all Ichimoku conditions currently point upward, producing a strong uptrend score of +4. Support sits at $0.23804 and in the $0.21517–$0.22661 range. DOGE continues to hold above these areas, with resistance seen near the $0.26 zone.
Liquidity and Short Position Liquidations
DOGE recently moved past $0.25 after clearing areas where short positions had built up. These liquidations reduced selling pressure and allowed the price to advance. Liquidity data shows firm support between $0.23 and $0.24, while the market is consolidating around $0.25–$0.255.
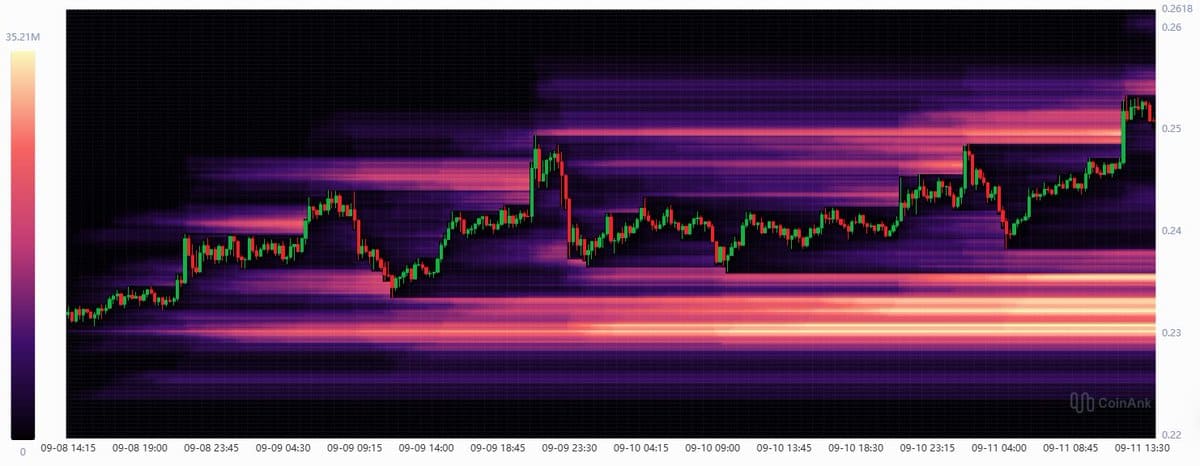
If buying demand continues and the asset breaks above $0.26, the reduced liquidity above current levels could give DOGE room to push toward the $0.31 target outlined by analysts.
