ETH Price Analysis: Defending This Key Support Could Catapult Ethereum to New ATH

Ethereum bulls dig in at critical support level as momentum builds for potential breakout.
Technical Standoff at Make-or-Break Level
The world's second-largest cryptocurrency faces its ultimate test at a key technical juncture. Ethereum's ability to hold this support zone separates consolidation from capitulation—and traders are watching every tick.
Market Mechanics Favor Upside Breakout
Volume patterns suggest accumulation while funding rates remain neutral—a classic setup before major moves. The defending this key support isn't just technical analysis jargon; it's the line in the sand between range-bound trading and historic price discovery.
Institutional flows continue stacking despite traditional finance's continued confusion about whether crypto is an asset class or a nuisance. Meanwhile, Ethereum's network activity quietly hits new highs—because nothing says 'store of value' like paying $50 in gas fees to transfer $100.
The stage sets for either a spectacular rally or painful rejection. With Bitcoin dominance wavering and altseason whispers growing louder, Ethereum's next move could define the entire cycle.
Ethereum Price: Technical Analysis
By Shayan
The Daily Chart
On the daily timeframe, ETH continues to respect its ascending channel; however, the rejection at the channel’s upper boundary NEAR the all-time high has forced price back into the $4.2K support zone. This area aligns with a daily order block and the channel’s mid-boundary, making it a critical level for bulls to defend.
The RSI has cooled to around 52, reflecting neutral momentum after the extended rally. A decisive breakdown below $4.2K would likely expose ethereum to the $3.8K demand region, which coincides with the lower half of the channel. On the upside, a rebound from current levels could drive price toward $4.6K, and reclaiming this level would restore bullish momentum, potentially opening the path to a new all-time high.

The 4-Hour Chart
On the 4-hour chart, Ethereum has already broken its steeper ascending trendline but continues to hold above the dotted mid-channel support. The asset is consolidating between $4.2K support and $4.6K resistance, with repeated failures at $4.6K underscoring persistent supply pressure.
The short-term structure remains cautious. A loss of $4.2K could attract the price toward the liquidity cluster below this zone, accelerating bearish momentum. However, if bulls manage to defend $4.2K, Ethereum WOULD remain in a range-bound state, giving buyers another opportunity to challenge resistance. Ultimately, the market is trapped within a tight consolidation band, and an impending breakout will likely dictate the next major trend.

Onchain Analysis
By Shayan
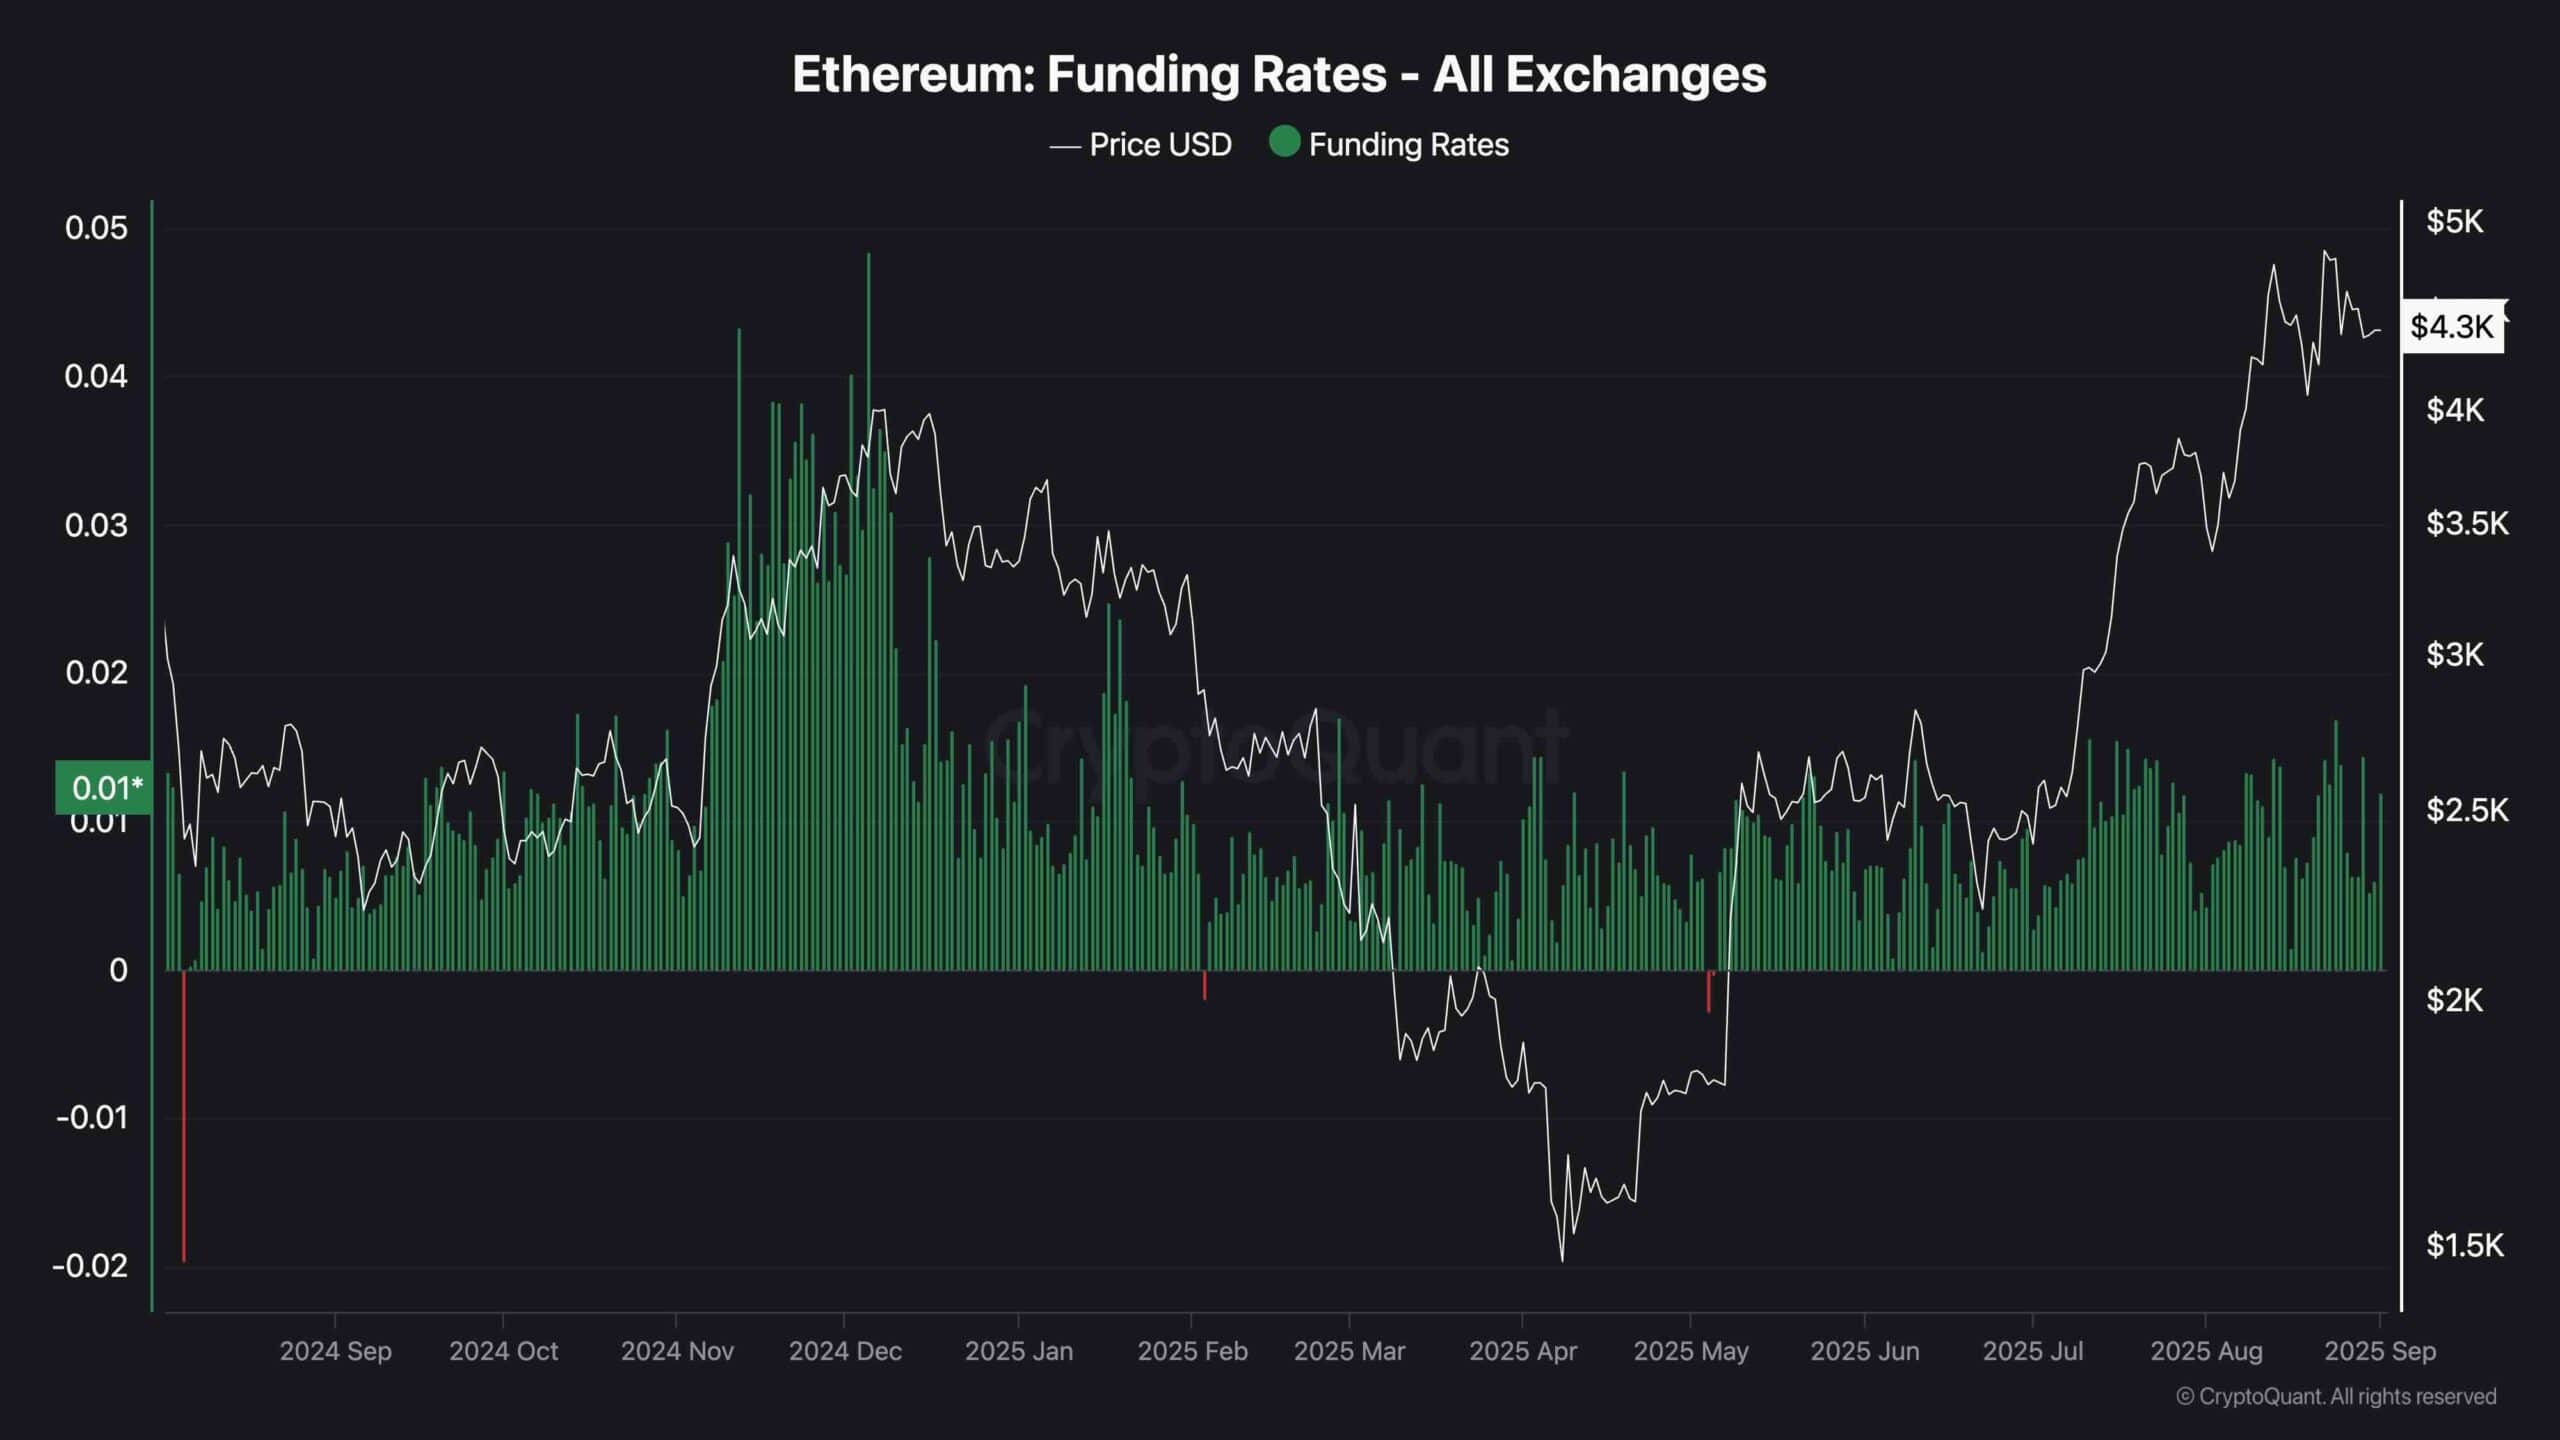
Funding rates in the perpetual futures market are a direct measure of trader sentiment. Sustained positive rates signal that long positions are dominant, but extreme values often warn of overheated conditions. Importantly, divergences between price action and funding rates can reveal exhaustion points where momentum begins to fade.
Currently, Ethereum’s funding rates remain positive as price consolidates around $4,300–$4,400, indicating that Leveraged longs still hold the upper hand. However, a notable divergence has emerged when comparing recent activity to earlier cycles.
In late 2024, funding rates spiked above 0.04 while ETH traded near $3,800–$4,000, reflecting aggressive long positioning at relatively lower prices. By contrast, during the August 2025 rally, ETH pushed to a new local high near $4,800, yet funding rates peaked only around 0.02–0.025 — far below the prior extremes.
This divergence suggests waning bullish momentum, as price extended higher but speculative traders were less willing to pile into leveraged longs compared to previous cycles. Historically, such patterns have often preceded trend slowdowns or corrective phases, where prices overextend but participation becomes less enthusiastic.