Bitcoin Price Analysis: Is BTC Set to Break Down Below $100K?

Bitcoin teeters on the edge—will $100K become resistance instead of support?
The Psychological Barrier
Traders watch the $100K level like hawks, knowing it's more than just a number—it's a make-or-break moment for market sentiment. Breaking below this threshold could trigger cascading liquidations across leveraged positions.
Market Forces at Play
Institutional flows slow to a trickle while retail FOMO cools off—classic signs of consolidation before the next major move. Whales accumulate quietly in the shadows, waiting for weaker hands to fold.
Technical Breakdown
Key support levels get tested repeatedly until they break. The charts don't lie—they just show what happens when greed meets reality. Every dip gets bought until it doesn't, and that's when things get interesting.
Remember: Wall Street still thinks Bitcoin's a 'risk asset' while quietly stacking SATs behind closed doors—the ultimate financial hypocrisy.
The Daily Chart
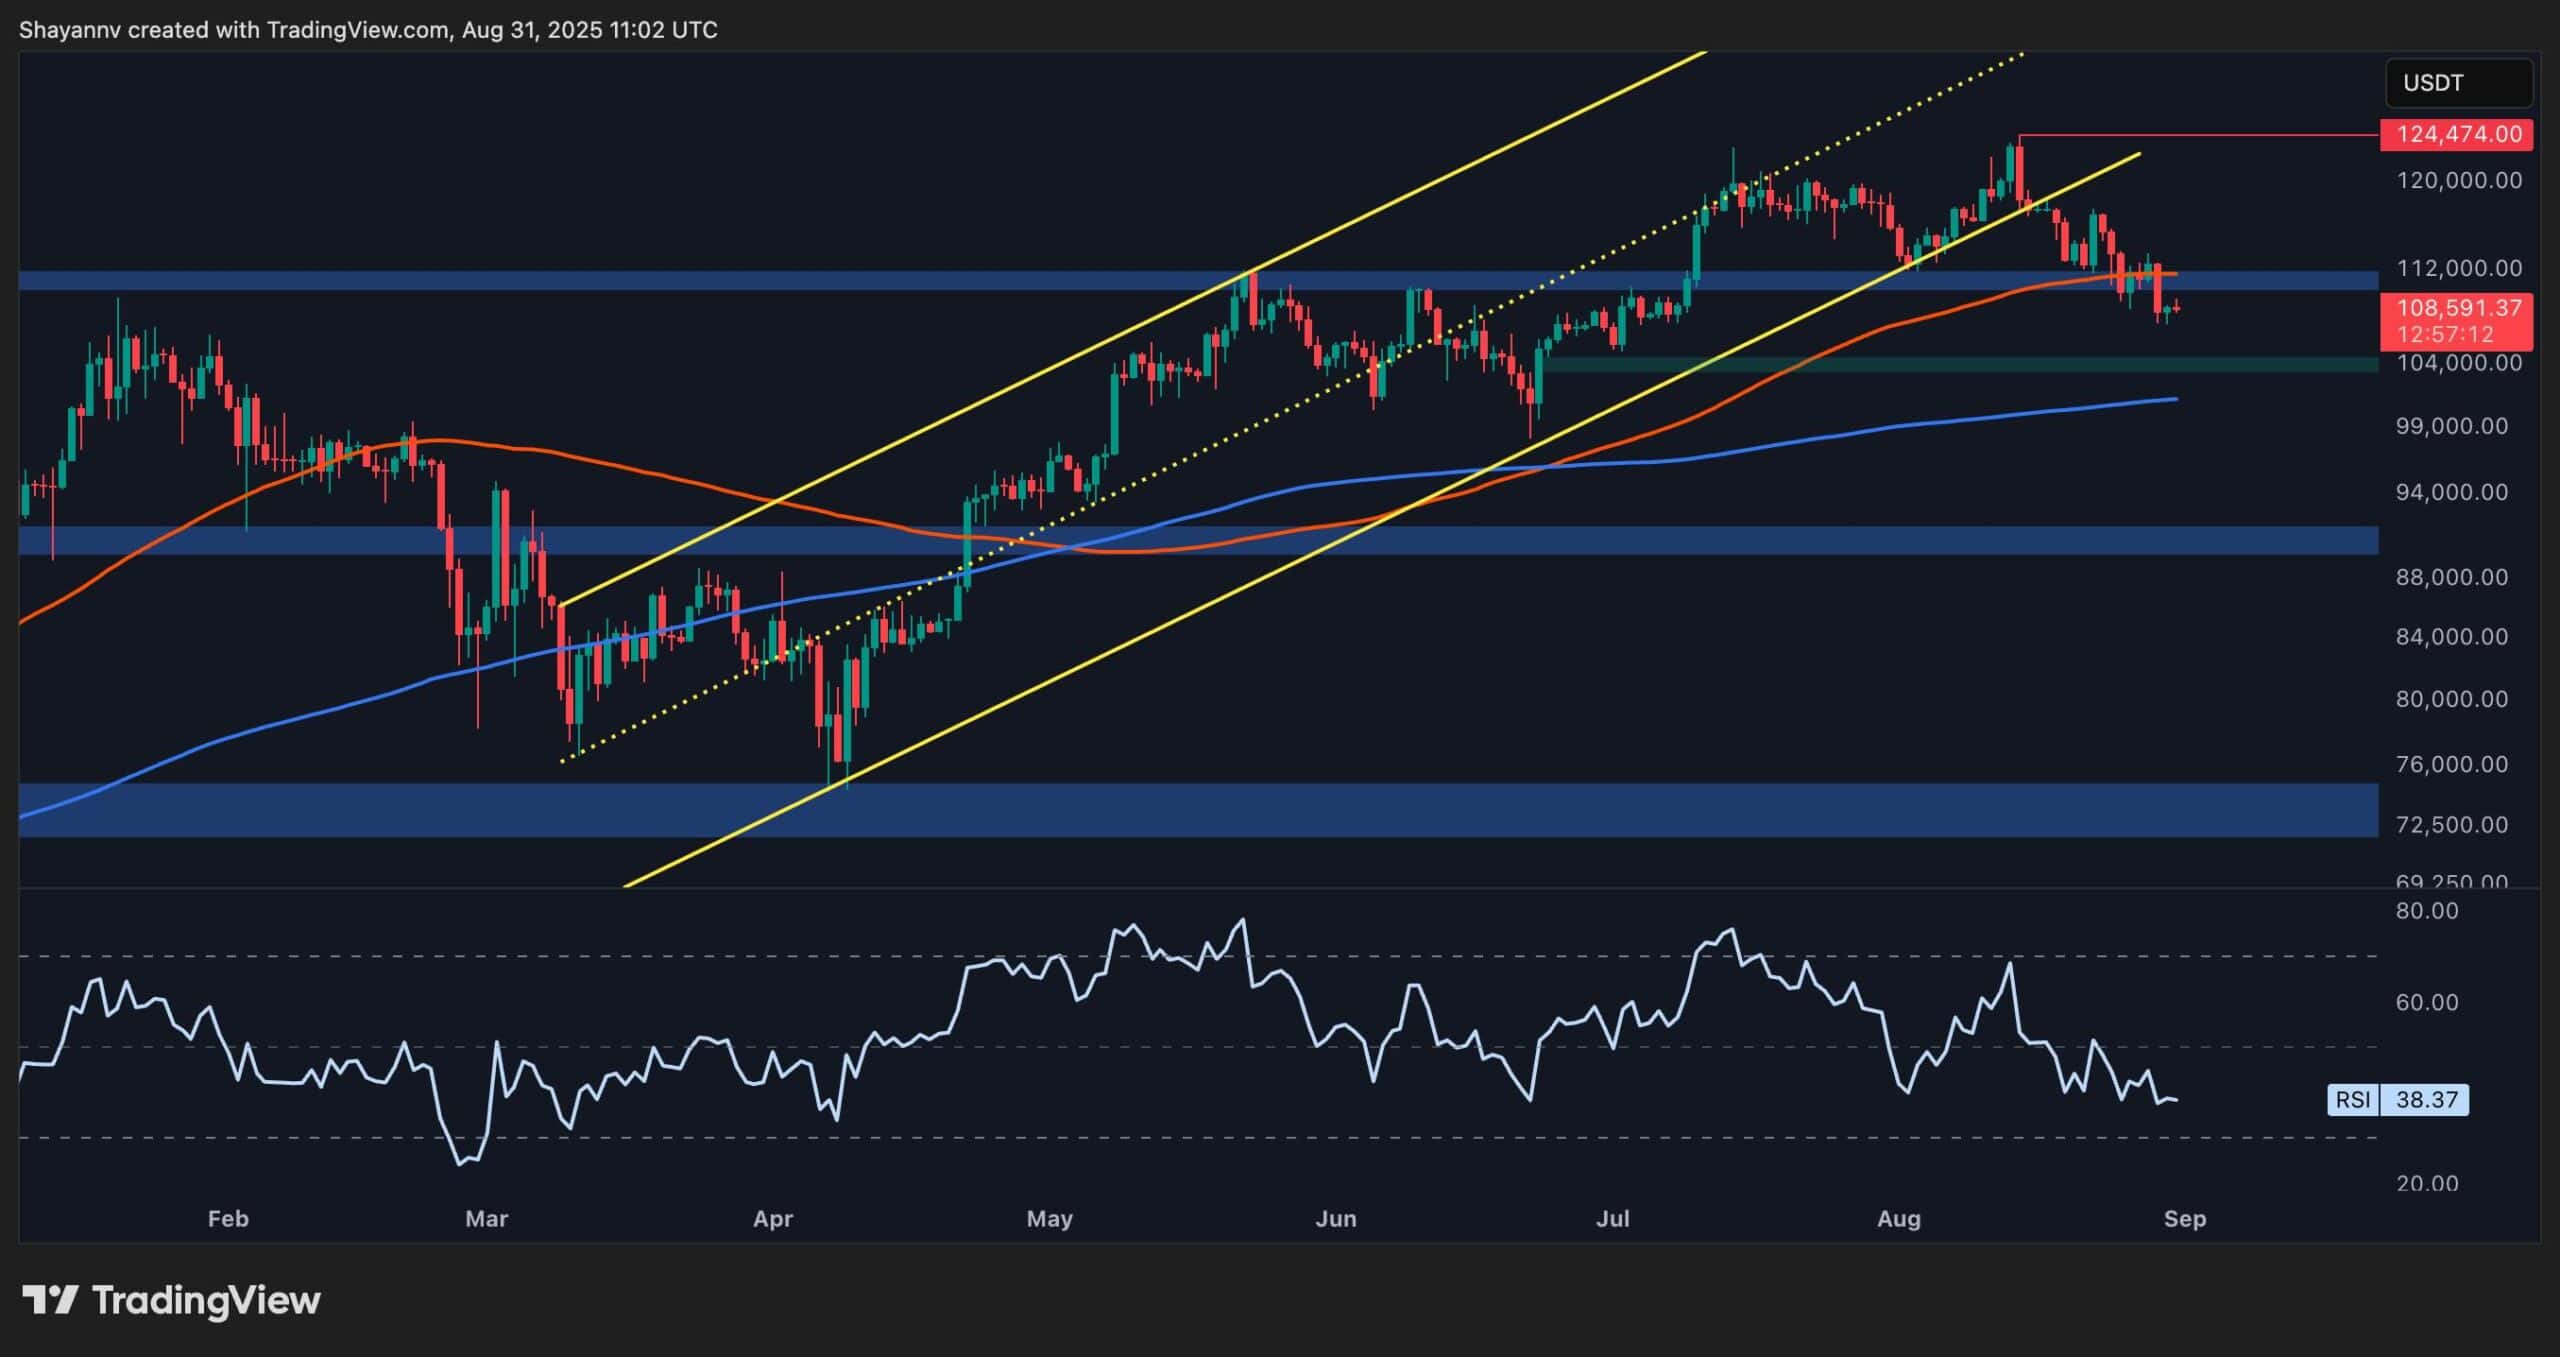
On the daily timeframe, the market has been steadily moving lower, breaking beneath the major descending channel, the $110K support area, and the 100-day moving average that aligned with it.
Losing these critical levels increases the likelihood of a deeper decline, with the next downside targets sitting around the $104K fair value gap or even the 200-day moving average NEAR the psychological $100K zone.
Since the RSI is also holding below 50, momentum clearly favors the bears, making continued downside the most probable outcome.
The 4-Hour Chart
On the 4-hour chart, the market is in a clear downtrend, forming consistent lower highs and lows within a tight descending channel. The $117K and $110K supports have both been broken decisively and retested, pointing toward the fair value gap around $104K as the next likely target.
The RSI is sitting below 50, reinforcing bearish momentum, while the price is edging closer to the Fibonacci golden zone. The lower boundary of this zone, at the 78.6% retracement level, aligns with the $104K fair value gap, making it a strong target and potential rebound area. How the market reacts to this level will be critical in shaping the direction for the weeks ahead.
Onchain Analysis
Exchange Reserves
This chart illustrates Bitcoin’s exchange reserves and its price. The purple line shows the reserves held across all exchanges, while the WHITE line tracks the USD price of Bitcoin. What stands out is the persistent decline in exchange reserves since the beginning of 2024, which has continued to this day.
This means fewer units are being held on exchanges, a sign that investors and institutions are withdrawing their BTC to cold storage rather than keeping them ready for sale. In other words, the circulating supply available for immediate trading is shrinking.
From a supply and demand perspective, this trend is highly significant. As exchange reserves drop, the supply of Bitcoin that can be quickly sold on the market becomes tighter.
If demand holds steady or increases, this imbalance supports higher prices over the long run, as we’ve seen with bitcoin pushing to new all-time highs. However, short-term price corrections like the recent pullback are still possible when demand weakens or when macroeconomic conditions shift.

