XRP’s 20% Plunge: Is This The Ultimate Buying Opportunity Or Just Another Crypto Trap?

Ripple's native token just got rocked—down a brutal 20% in what traders are calling a classic crypto gut-check.
Technical Breakdown
The charts don't lie—support levels cracked like cheap glass as XRP bled out alongside broader market jitters. That 20% haircut wiped out weeks of gains in days, leaving bagholders staring at screens with that familiar sinking feeling.
Market Forces at Play
Whales moved first—dumping massive positions while retail investors scrambled for exits. Liquidity vanished faster than a hedge fund's ethics during a market crash. Trading volumes spiked to panic levels, creating the perfect storm for cascading liquidations.
What's Next for XRP?
Either this is the mother of all dip-buying moments or just another reminder that crypto markets eat optimism for breakfast. Smart money's watching for consolidation around key levels—another breakdown could signal deeper pain ahead.
Remember: in crypto, a 20% drop is just Tuesday—but it separates the believers from the tourists real quick.
XRP Analysis
By Shayan
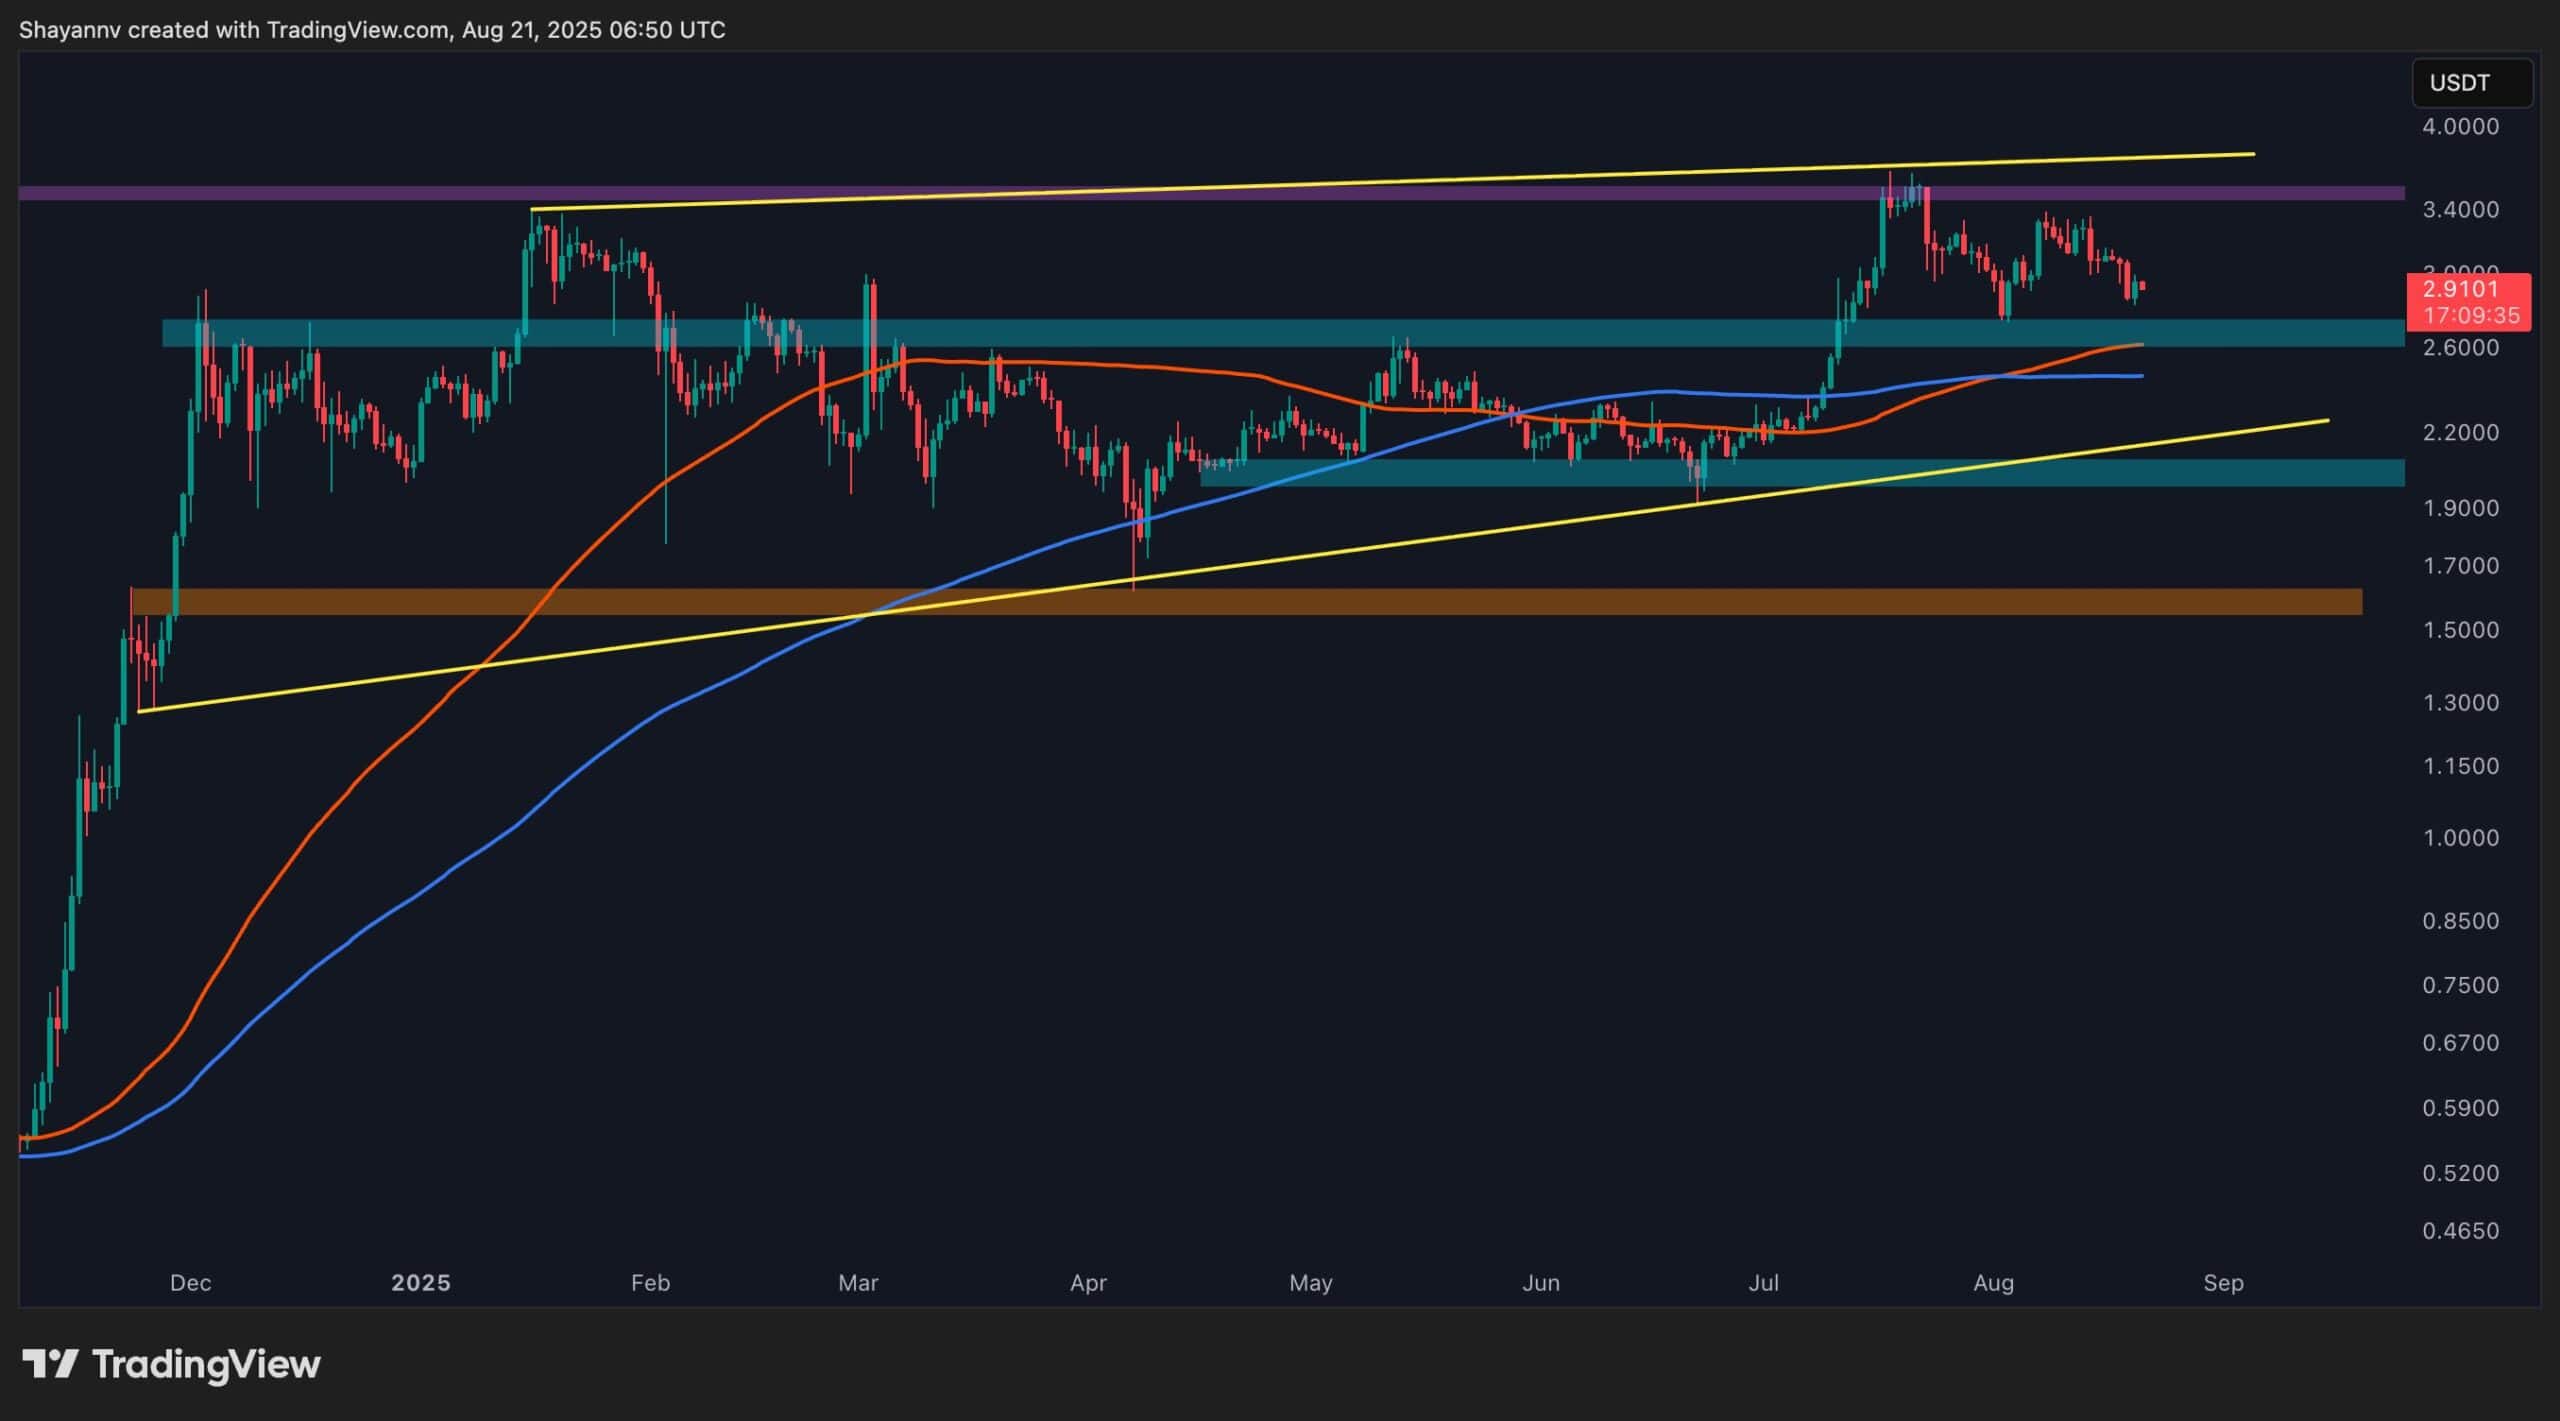
The Daily Chart
On the daily timeframe, Ripple’s token failed to sustain its breakout above the $3.5 resistance zone, resulting in a sharp rejection and pullback. The asset is now testing the $2.8–$2.9 support area, which overlaps with the mid-range of the ascending channel and the 100-day moving average, adding strength to this demand zone.
If buyers defend this support, XRP could rebound toward $3.2 and eventually retest the $3.5 resistance, keeping the broader bullish structure intact. However, if sellers succeed in breaking below $2.8, the next critical support rests at $2.2–$2.4, a zone that previously served as a strong accumulation area and aligns with the ascending wedge’s lower boundary.
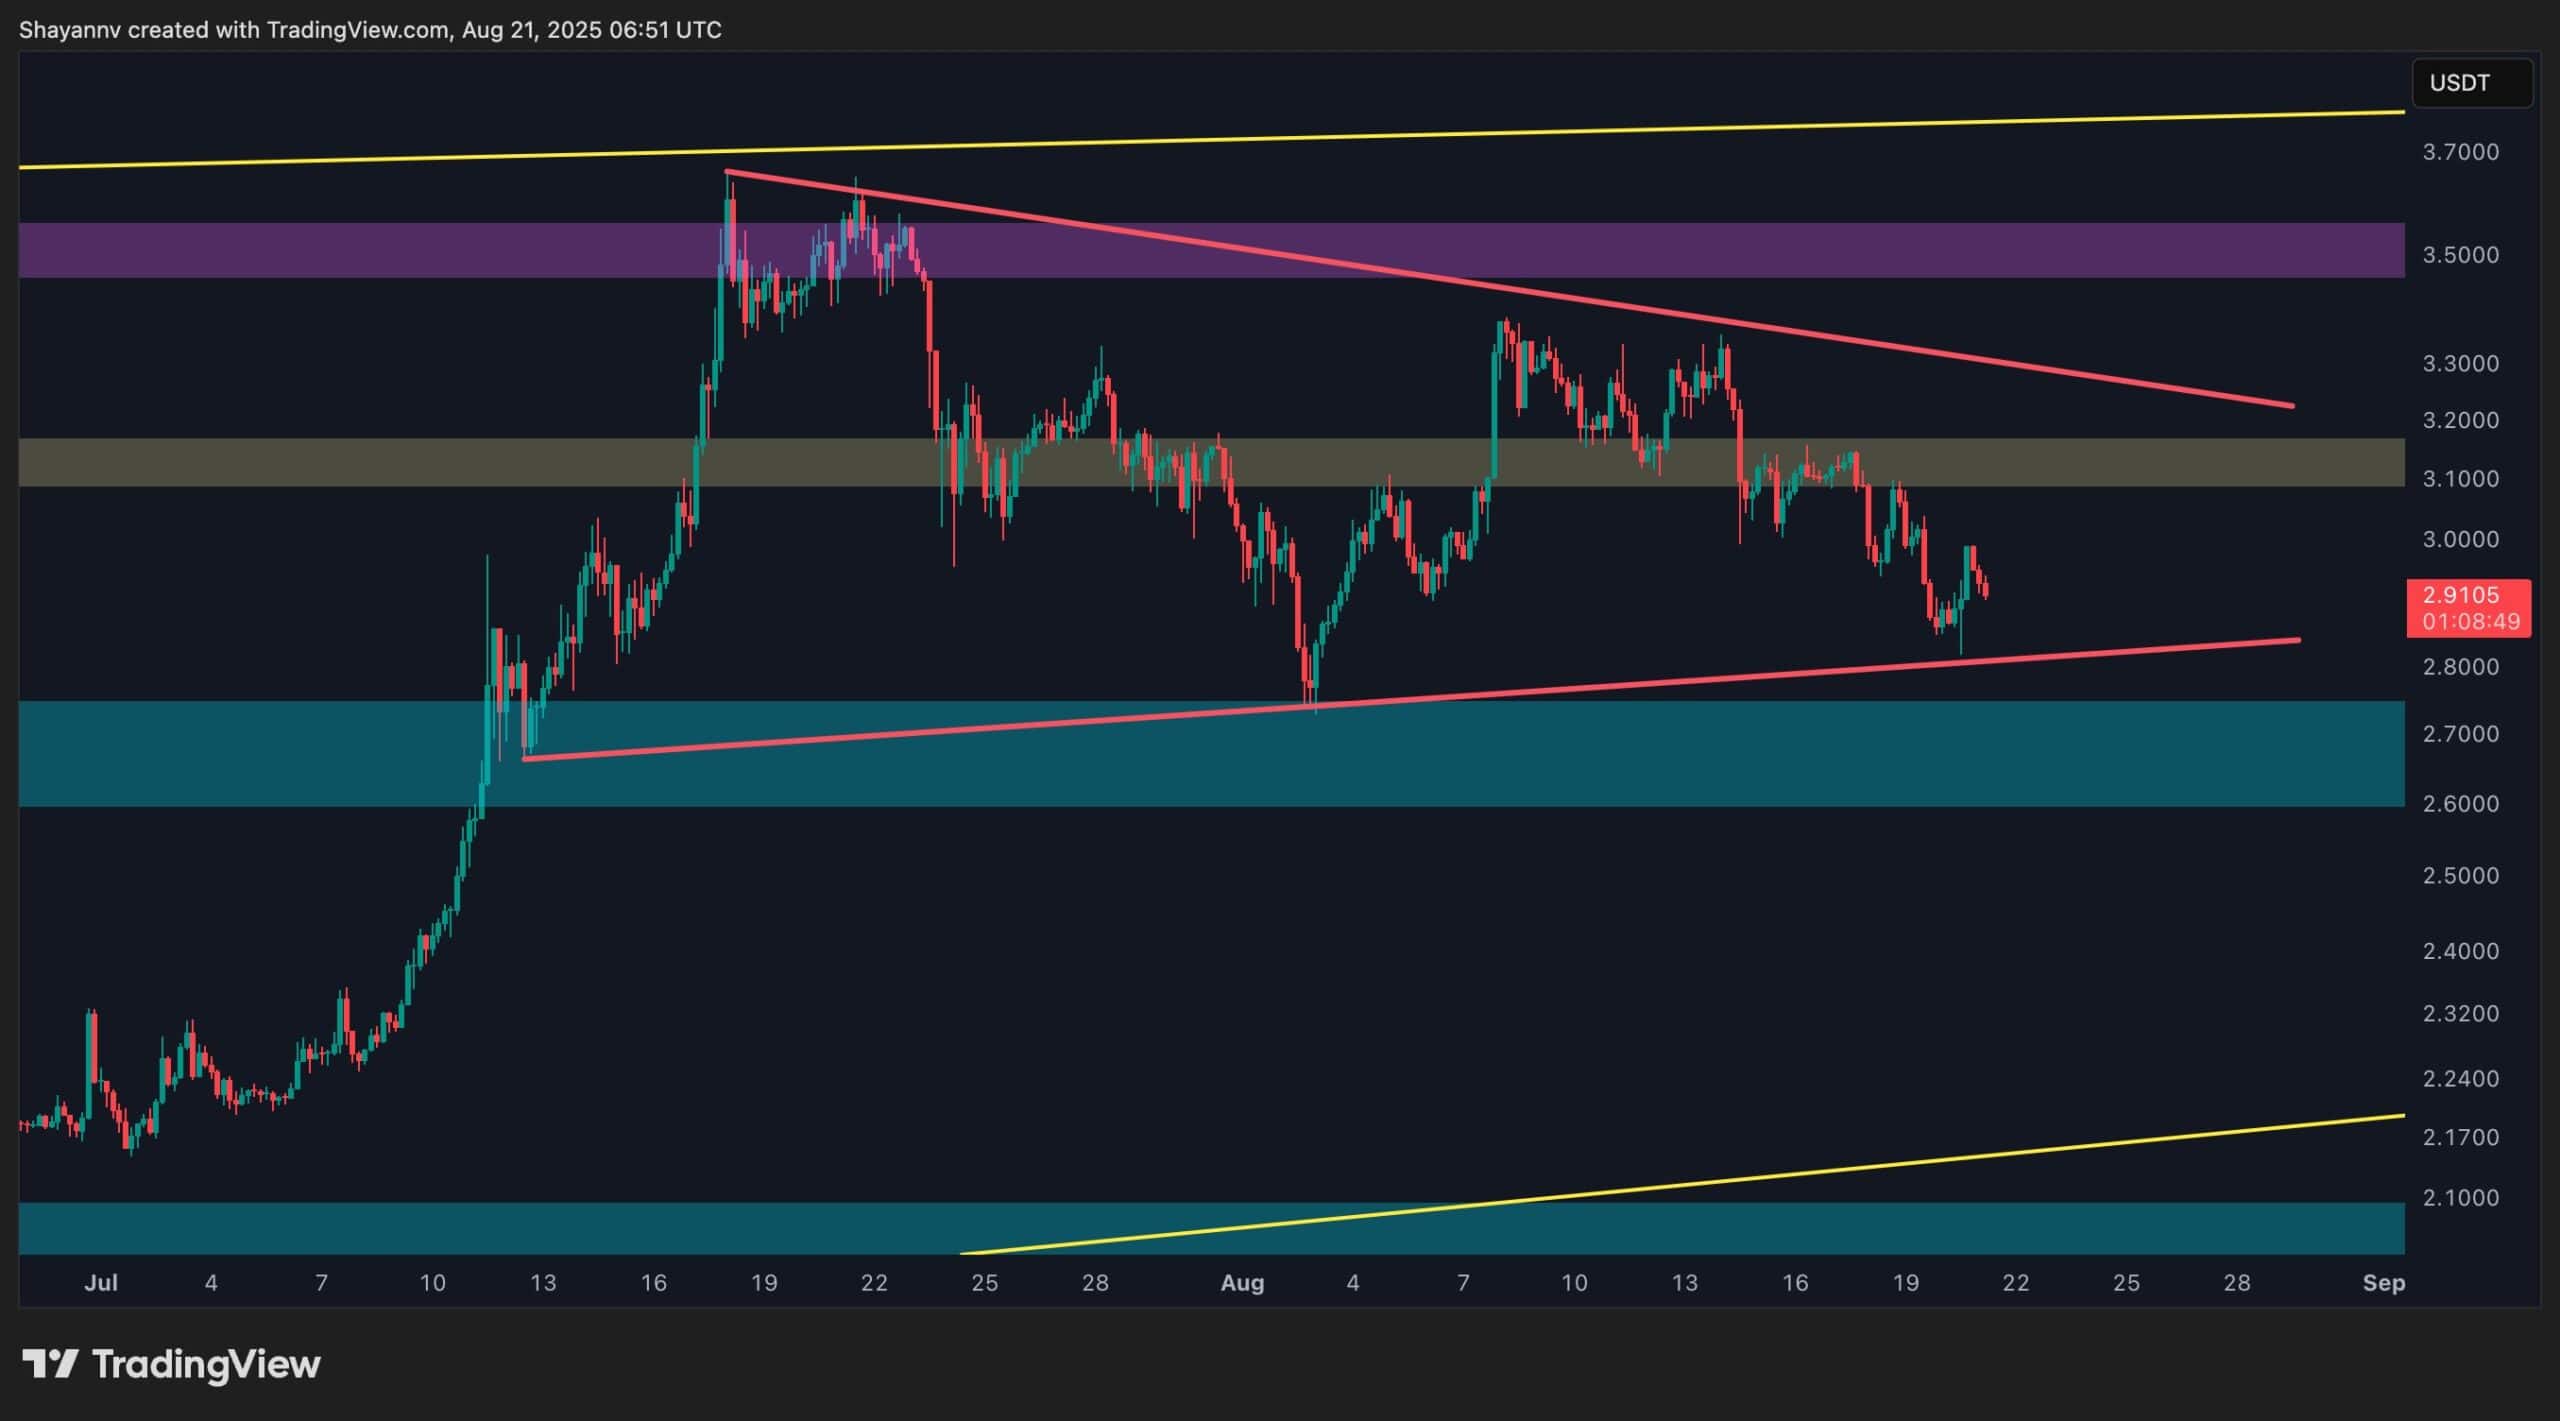
The 4-Hour Chart
On the 4-hour chart, Ripple’s native coin has formed a descending triangle pattern, with lower highs converging toward a relatively flat base at $2.8–$2.9. This setup reflects gradually intensifying selling pressure. A breakdown from this structure WOULD likely confirm a bearish continuation, exposing liquidity zones at $2.7 and $2.2.
Conversely, if the bulls manage to defend the $2.8 base and break above the descending trendline NEAR $3.2, the bearish scenario would be invalidated. Such a move could reestablish short-term bullish momentum, targeting the $3.5 resistance once again.