Ethereum’s 10% Plunge: Is This a Buying Opportunity or the Start of a Deeper Correction?

Ethereum just got rocked—down 10% in a brutal slide that left traders scrambling. The question now: Is this a temporary dip or the beginning of something uglier?
### The Breakdown: ETH's Sudden Freefall
No sugarcoating it—ETH got hammered. The drop came fast, leaving even seasoned degens sweating. Was it macro fears? A whale dumping bags? Or just crypto being crypto?
### Key Levels to Watch
All eyes are on whether ETH holds critical support. If it cracks, we could see panic selling. If it bounces? The bulls will scream 'I told you so' between sips of overpriced NFT coffee.
### The Bigger Picture
Let's be real—10% moves are Tuesday in crypto. But with institutional money now playing, these swings carry more weight. (And more margin calls.)
### Final Take
Ethereum's either on sale or in trouble—your call. Just remember: in crypto, 'fundamentals' are what people yell while ignoring the charts. Place your bets.
Ethereum Price Analysis: Technicals
By Shayan
The Daily Chart
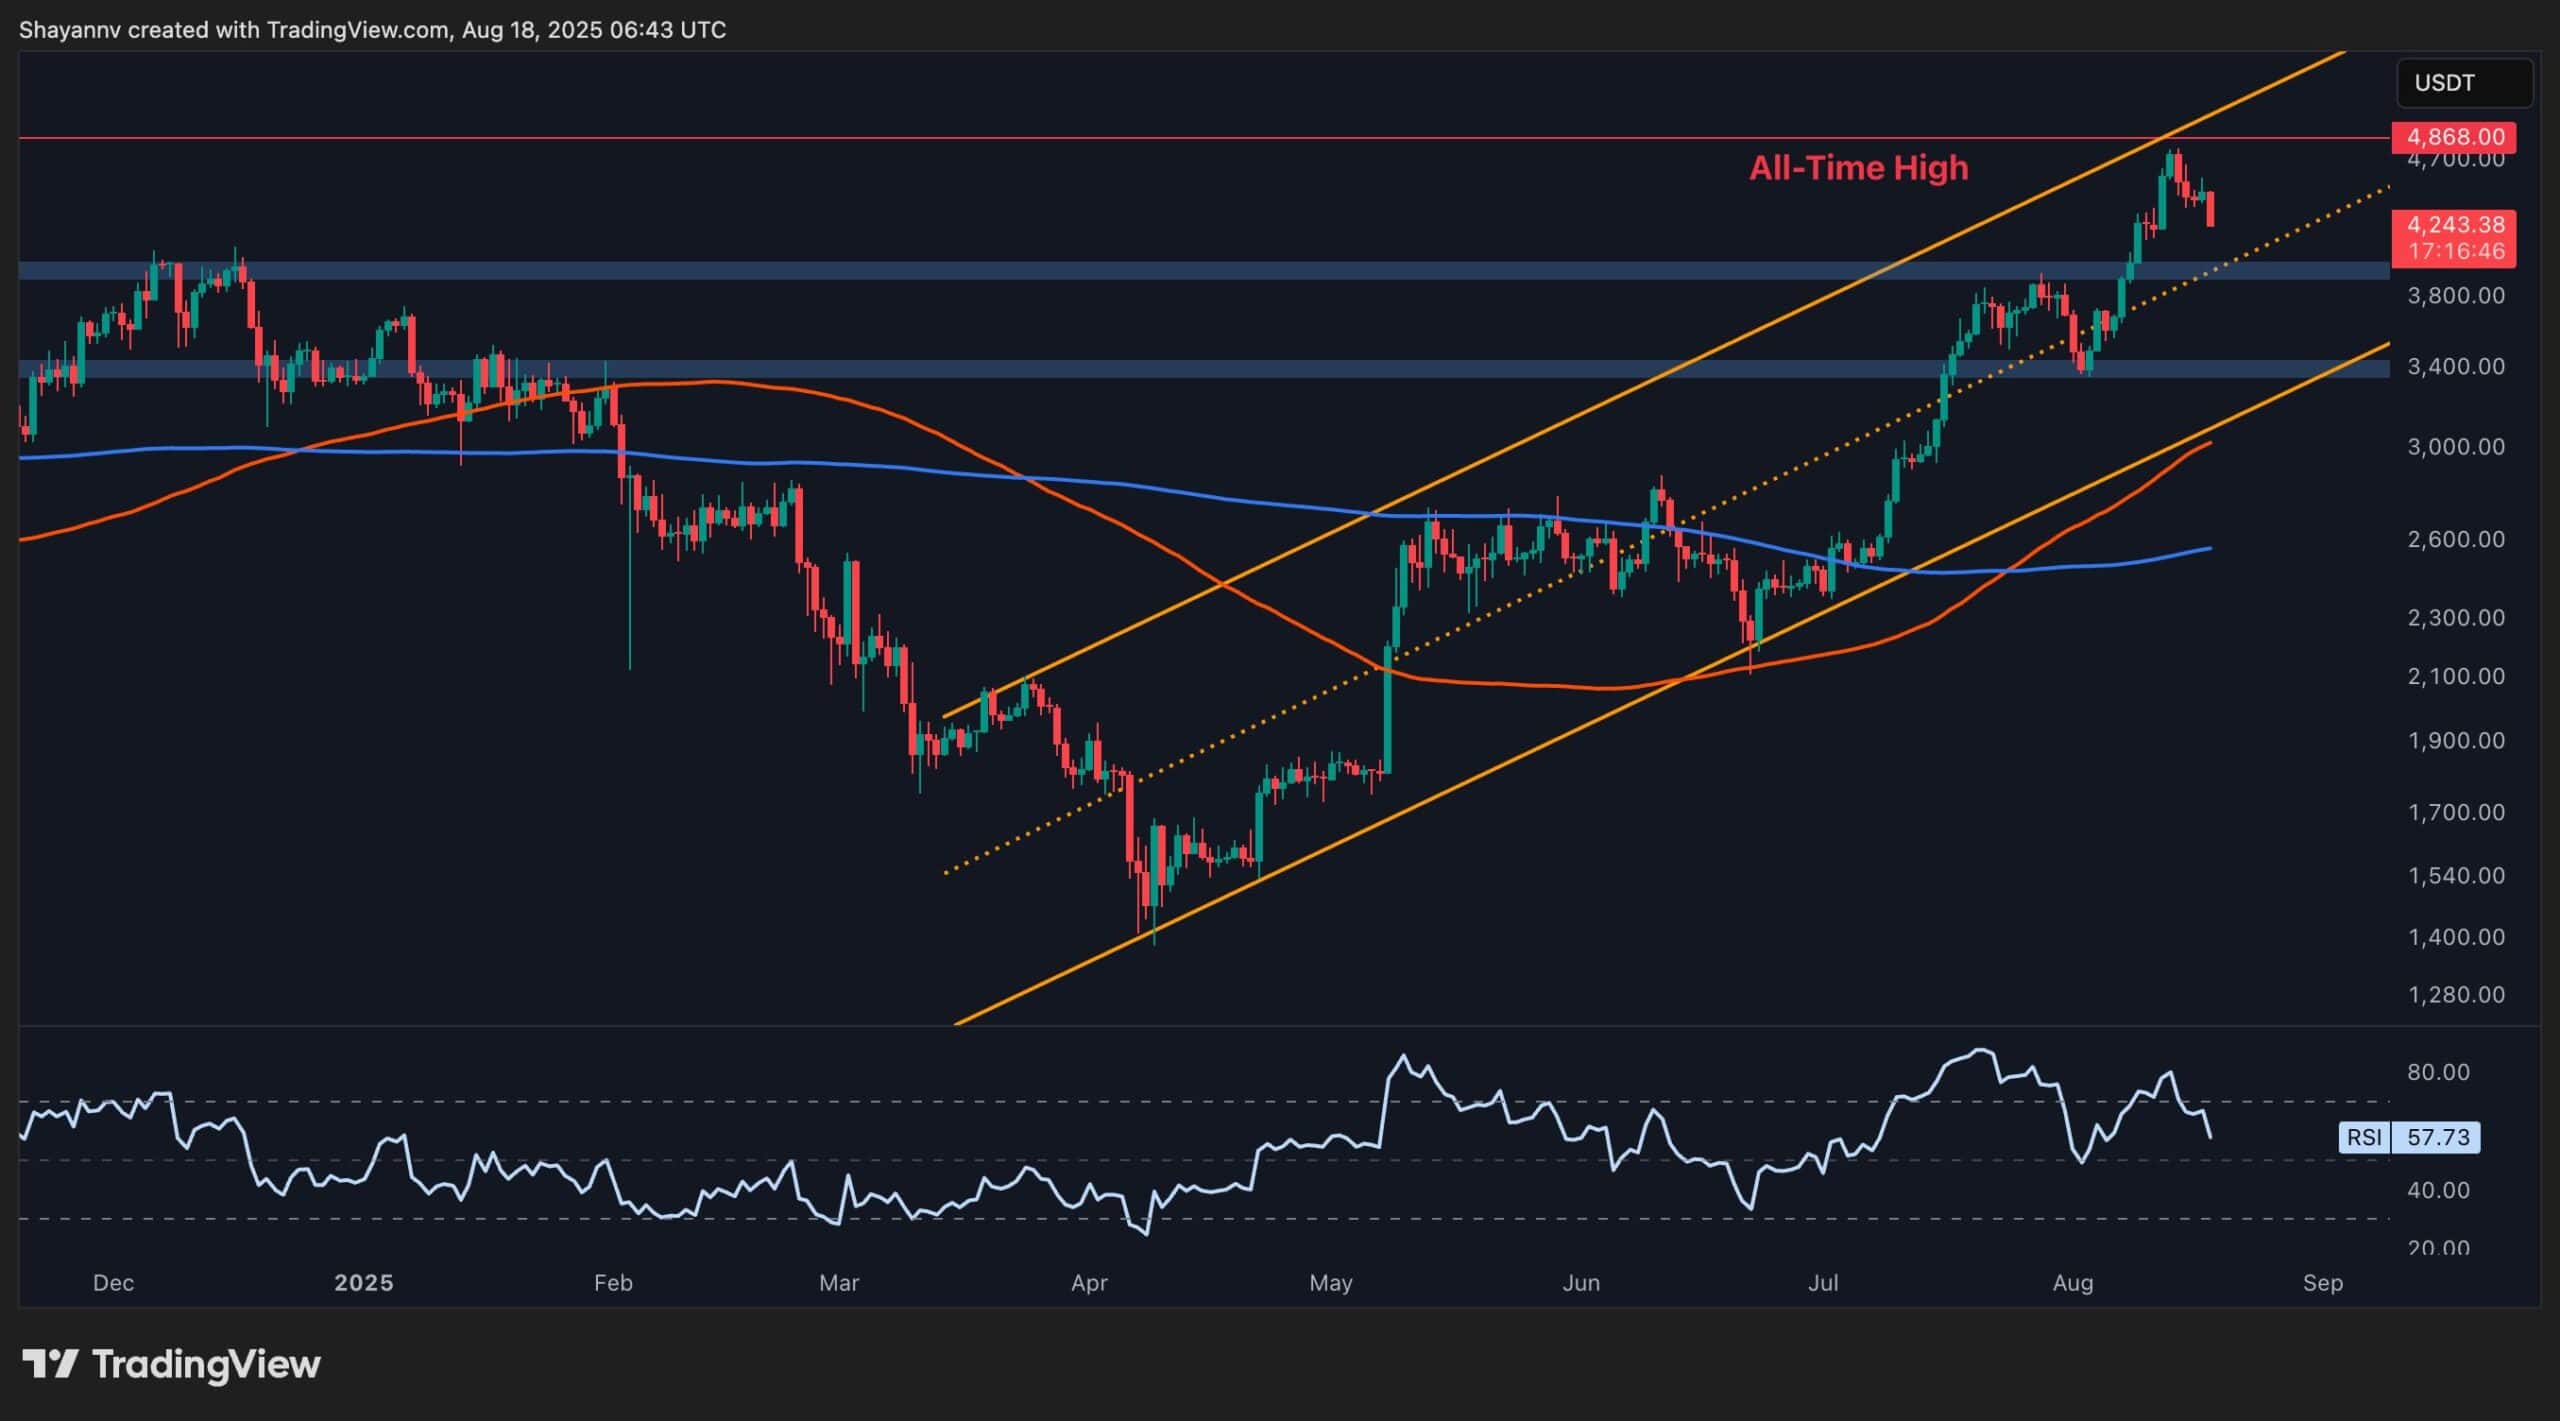
On the daily chart, ethereum was rejected near its $4.8K all-time high, as heavy selling pressure, likely from profit-taking and unstaking, added to supply. The decline pushed price back toward a confluence of supports, including the ascending channel’s midline and the $4.2K demand zone.
As long as ETH holds above this area, the broader bullish market structure remains valid. However, a breakdown below this zone could expose $3.8K, which aligns with a prior consolidation base and WOULD mark a deeper retracement. Meanwhile, the RSI indicator has rolled over from overbought conditions, forming a bearish divergence that reinforces the corrective tone.
The 4-Hour Chart
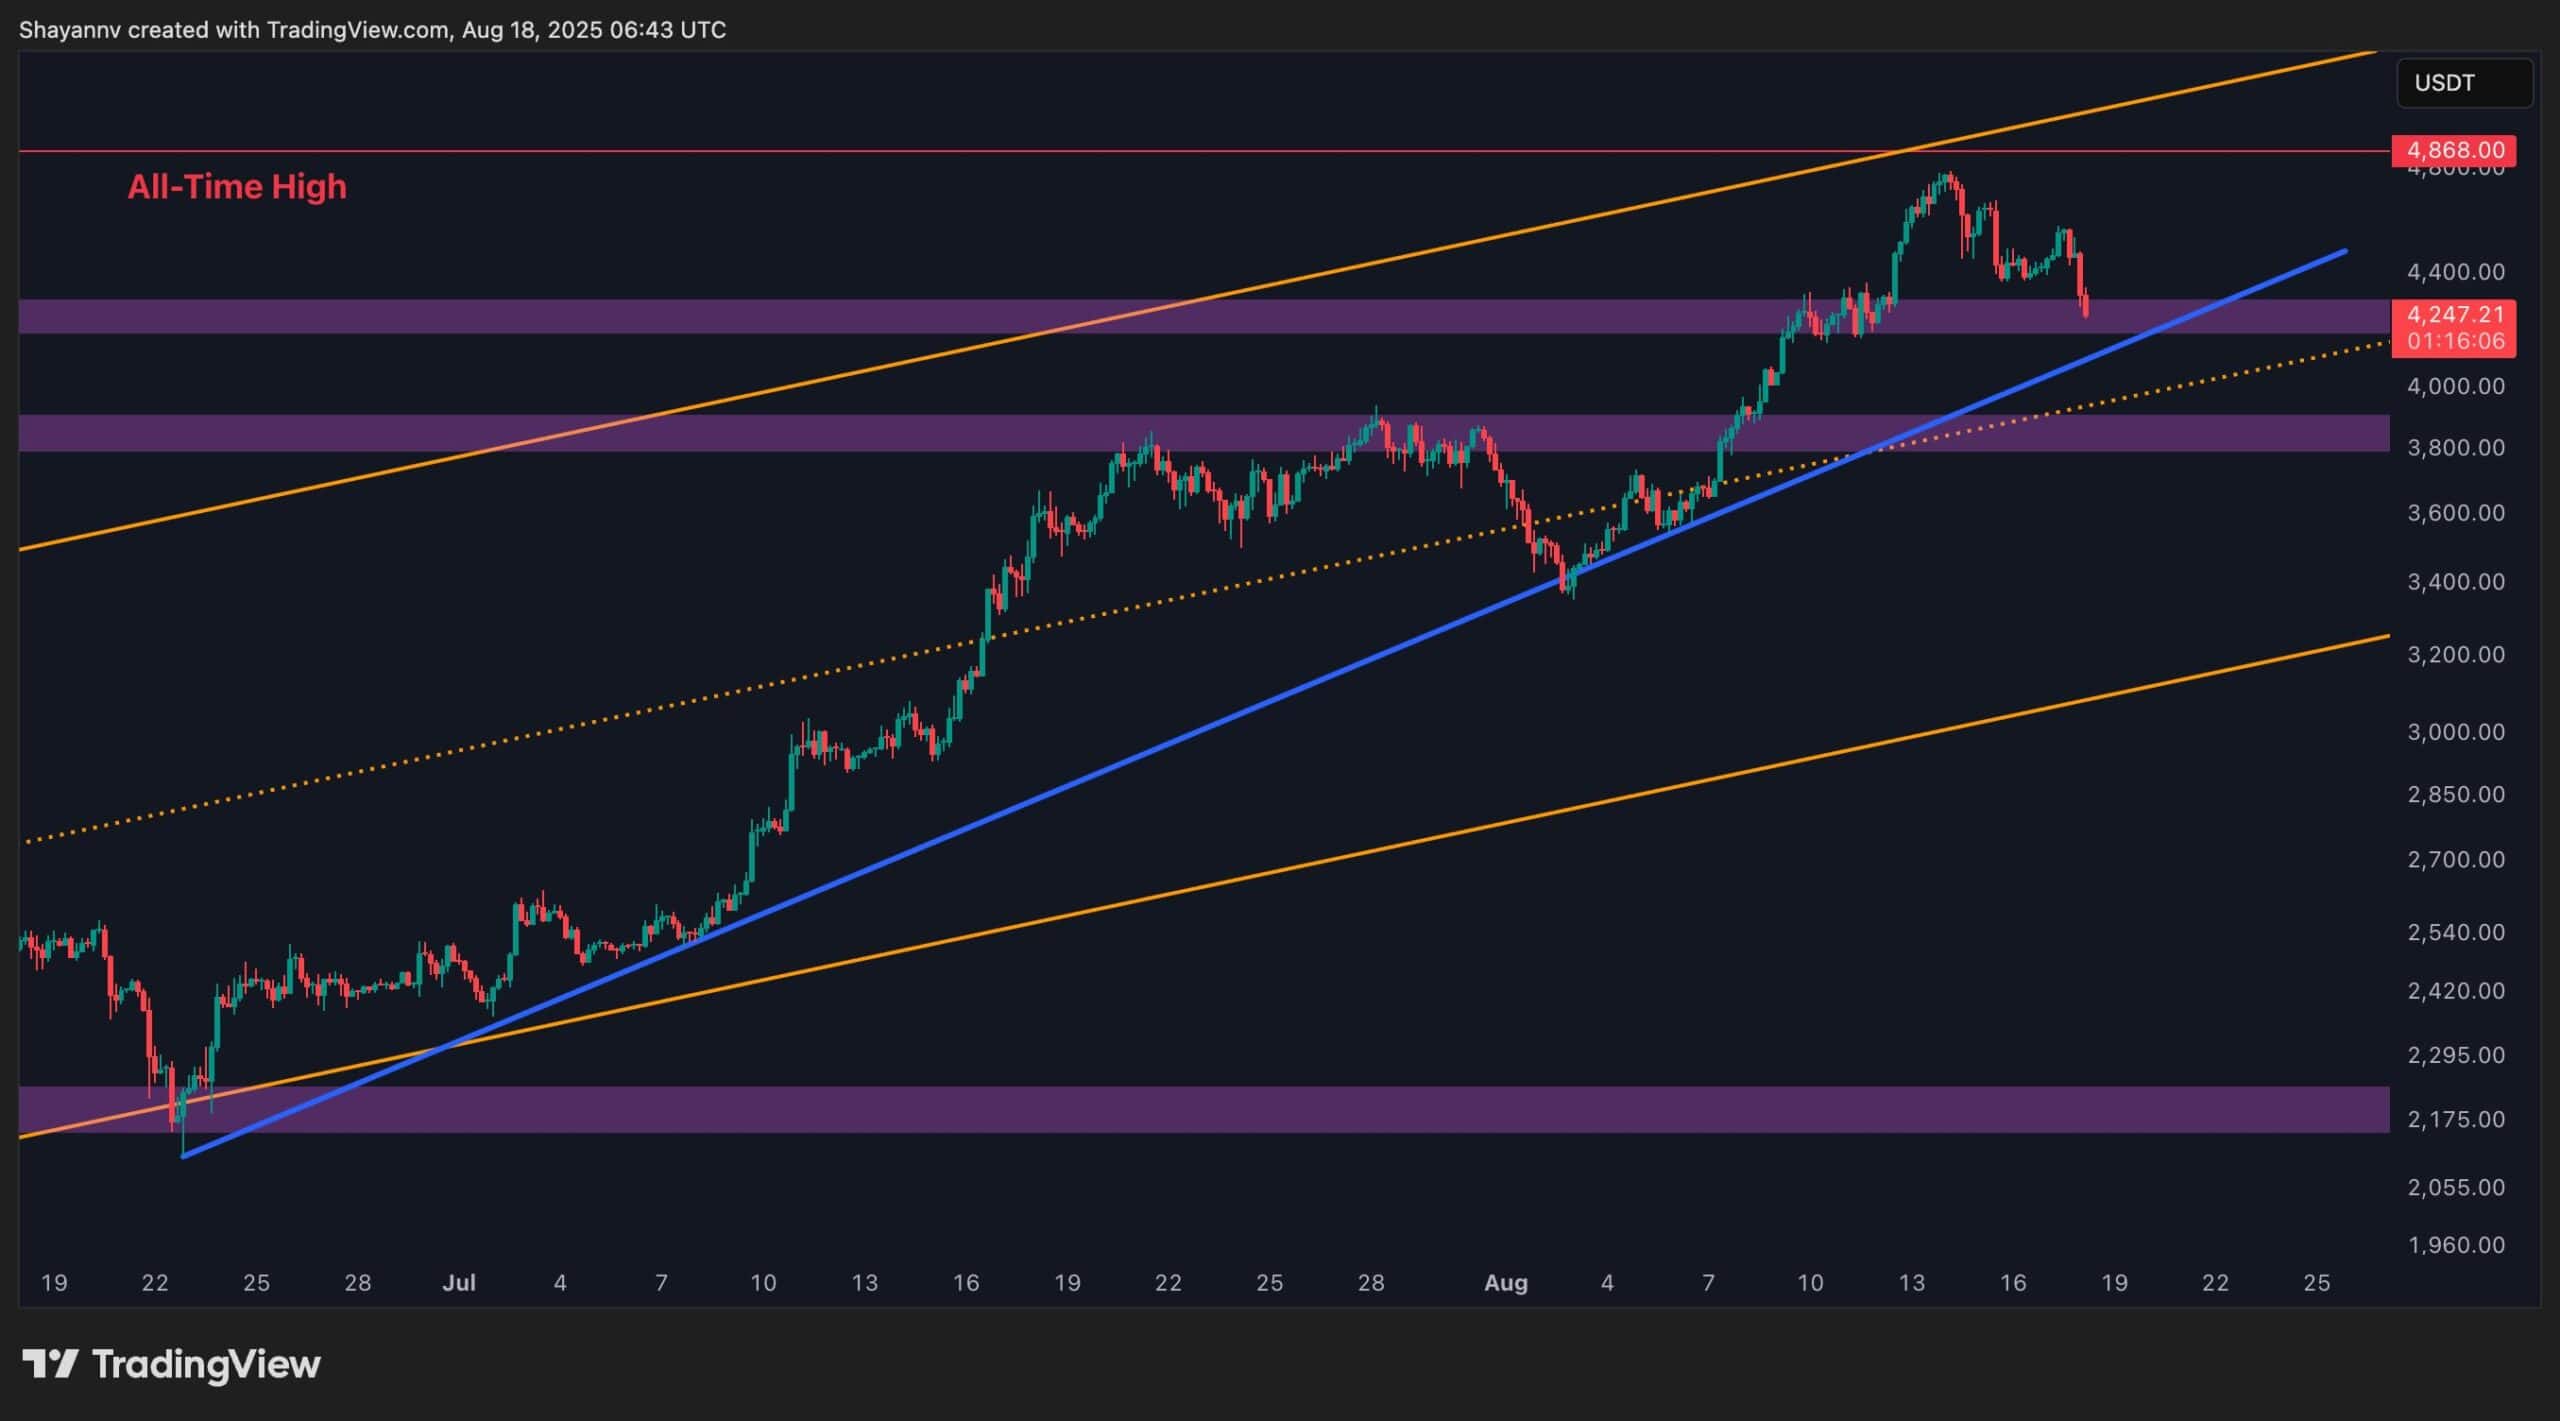
On the lower timeframe, Ethereum displayed a classic liquidity hunt as it approached the liquidity pool around the $4.8K mark, triggering stop orders and late breakout entries before reversing sharply. This rejection also broke below a recent higher low, hinting at the early stages of a market structure shift.
Currently, ETH is consolidating within a corrective phase, testing multiple support confluences. These include the $4.2K region, the ascending trendline (Blue), and, in the case of a deeper pullback, the multi-month channel’s midline near $3.8K. Until a decisive breakout occurs, ETH is likely to remain volatile, oscillating around these critical supports as the market establishes its next direction.
Sentiment Analysis
By Shayan
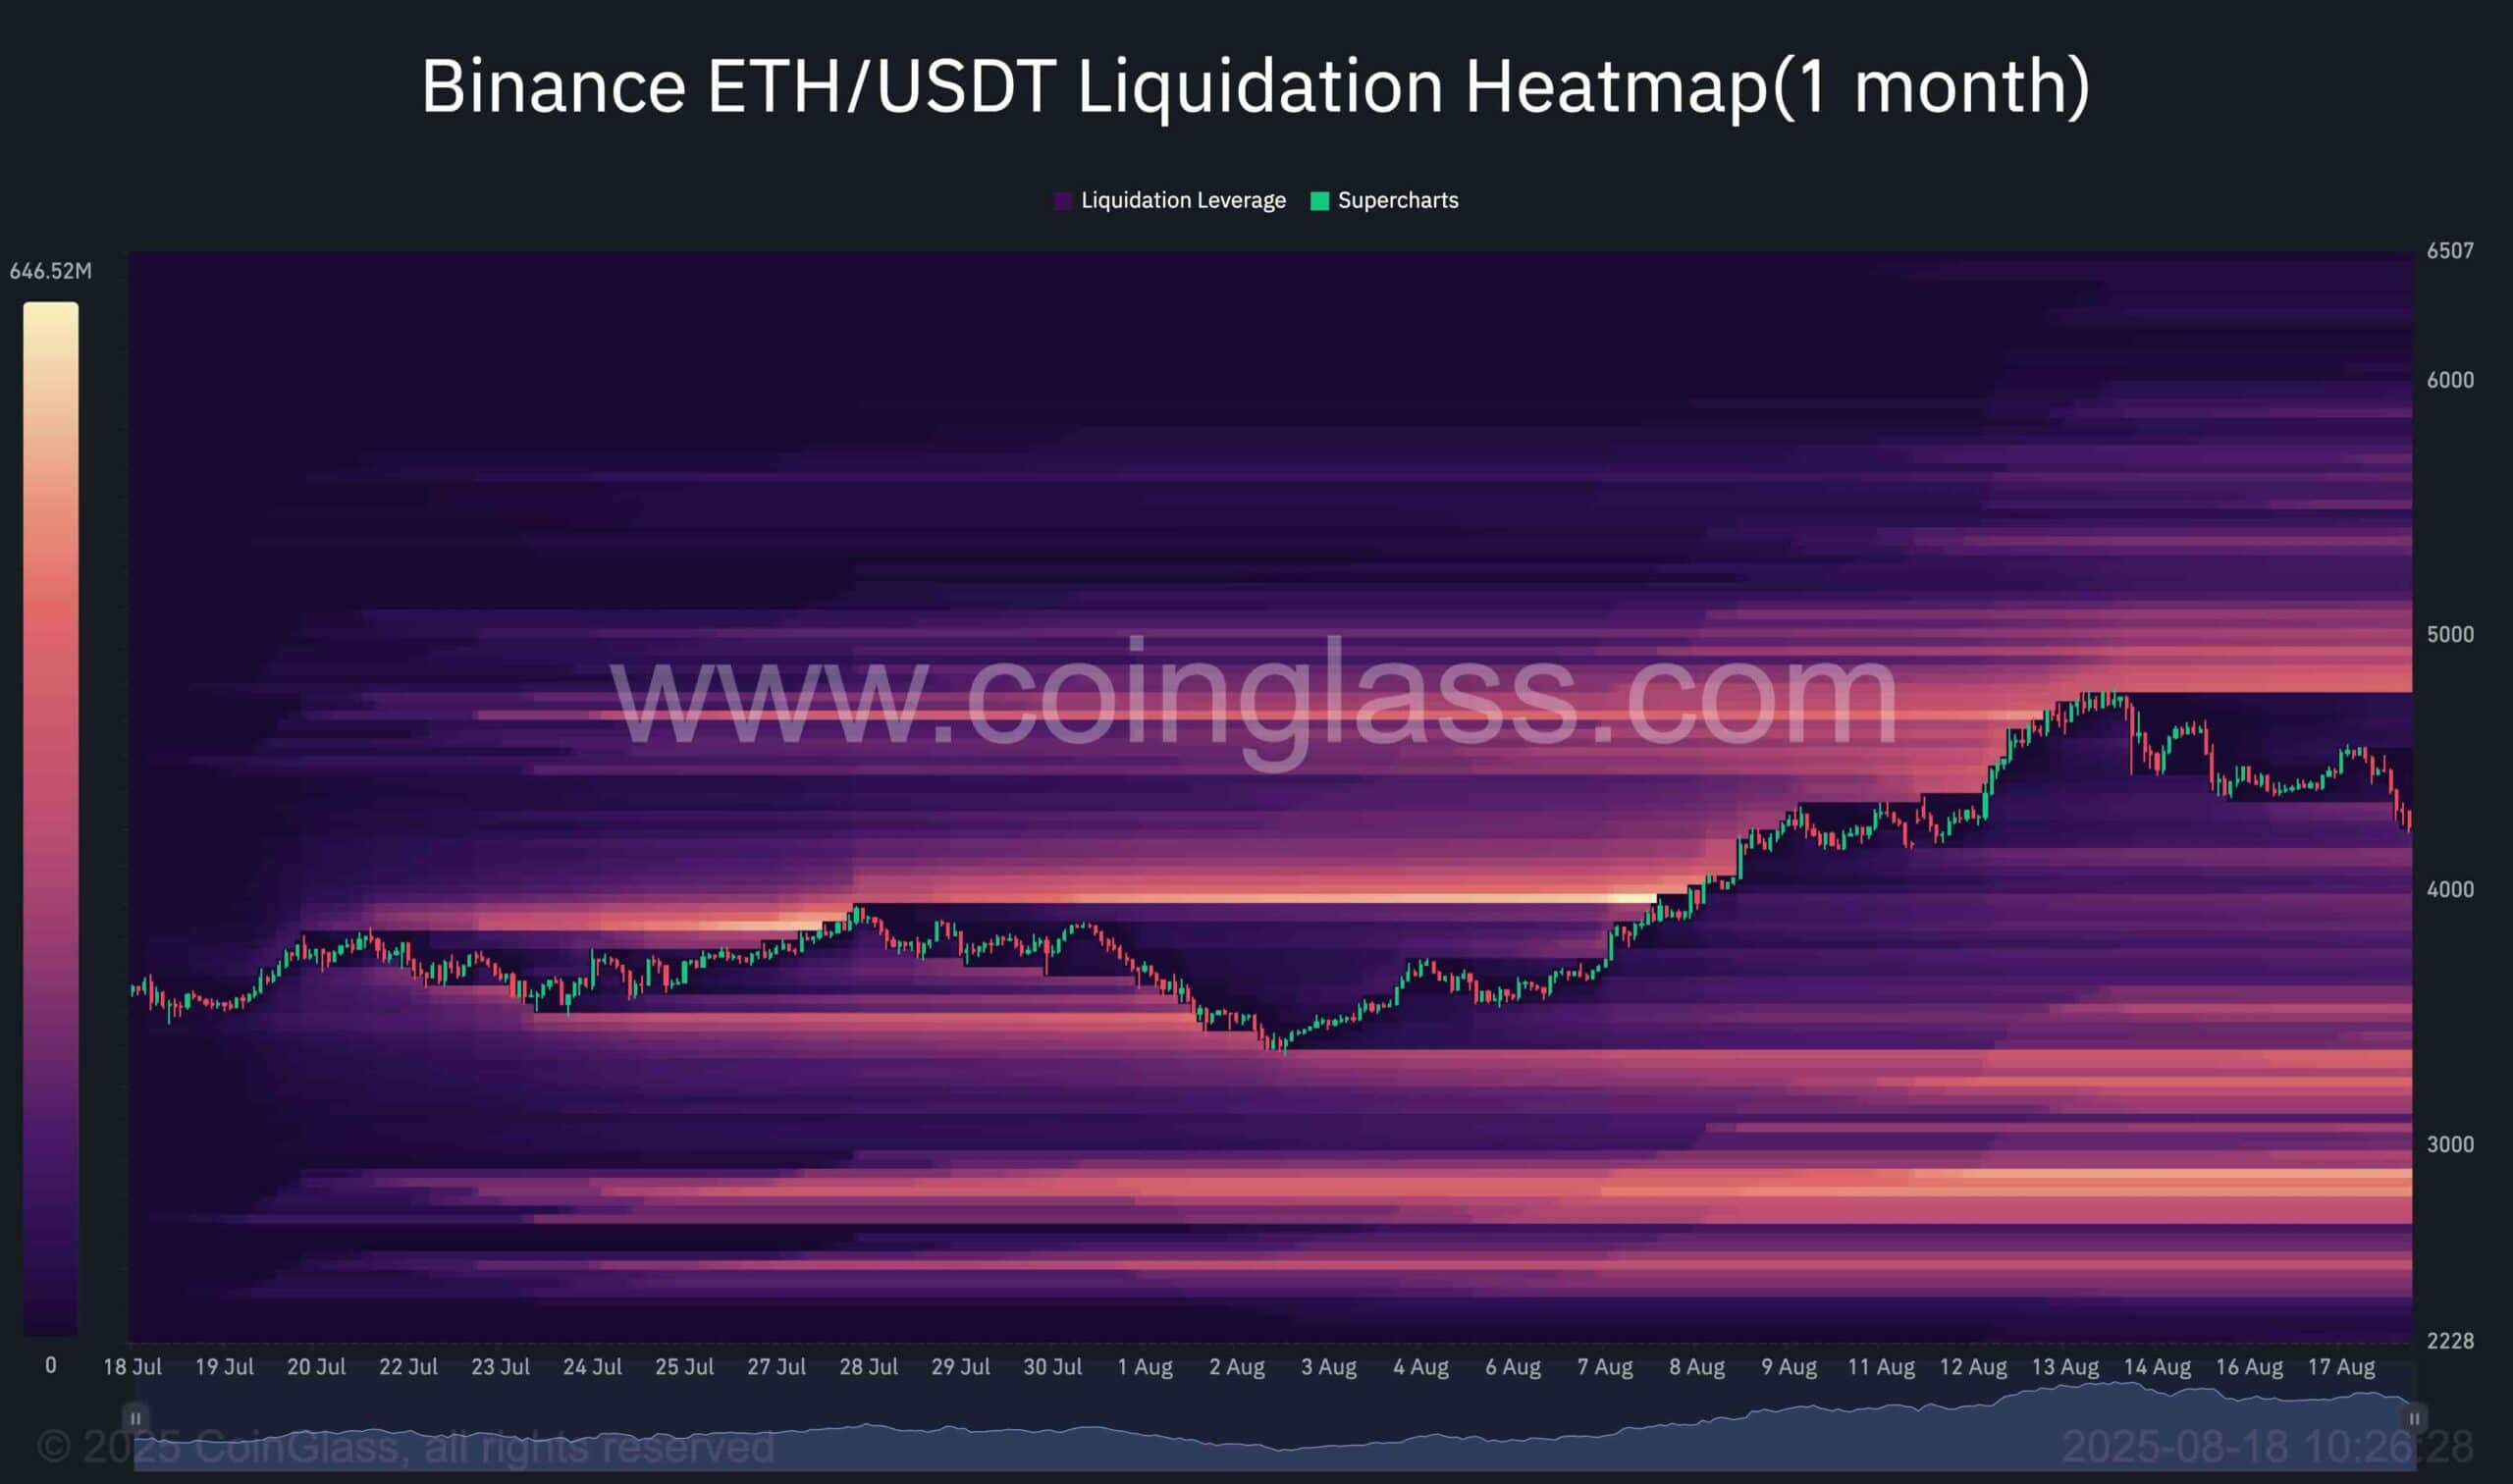
Ethereum has recently exhibited increased volatility, with the price action heavily influenced by liquidity-driven moves. The liquidation heatmap highlights where Leveraged positions are concentrated, offering key levels that may attract the price in the short term.
Over the past week, ETH surged toward the $4.8K region, sweeping the liquidity pool located there before encountering strong selling pressure that triggered a sharp rejection. The retracement drove price back toward the $4K zone, which serves as a critical and psychological support.
Notably, a significant cluster of liquidation levels is now visible below the $3.8K threshold. This suggests that, in the event of a deeper correction, ETH could target this area to trigger long liquidations and capture liquidity before staging another bullish leg higher. Such levels often act as magnets for price, increasing the probability of a liquidity grab in that region.
That said, traders should remain cautious of false breakouts, as liquidity hunts on both sides of the market are likely to continue until a decisive trend structure takes hold.