BNB Soars to Record $865 – Whales Now Eyeing $1K as Next Milestone

Binance Coin just blasted past all resistance, hitting an all-time high of $865. Here’s why traders are already pricing in a four-digit future.
The FOMO is real—and so are the buy walls
Institutional money flooded in as BNB cleared $800, with order books showing concentrated accumulation between $820-$850. Retail traders piled on after the breakout, because nothing fuels a rally like watching your neighbor get rich.
Three reasons this isn’t just another hype cycle
1) Binance’s burn mechanism just torched another $600M worth of tokens 2) Exchange reserves hit 18-month lows (thanks, regulatory scrutiny) 3) Perpetual swap funding rates stayed neutral—no overheated leverage yet
The cynical take?
Wall Street’s crypto desks will start calling this "digital gold 2.0" right around $950. By $1,100, they’ll be packaging it into structured products with 3% management fees.
One thing’s certain: The charts scream momentum, but smart money’s already calculating exit liquidity. Trade accordingly.
Breakout Above $865
Binance Coin (BNB) shipped to $865 earlier today after breaking above its previous all-time high. The MOVE follows a steady recovery from the $550–$600 support range earlier this year, with the asset gaining 13% over the past week alone.
According to analyst crypto King, BNB is “only 15% away from 4 digits” and looks set for the next push toward $1,000 if momentum continues.
$BNB is only 15% away from 4 digits.
Price broke the all time high of $865 and is holding strong above support.
If momentum continues, the next stop is $1,000.
Looks ready for the next big push. pic.twitter.com/60p7rZgtIB
— Crypto King (@CryptoKing4Ever) August 14, 2025
Notably, the chart shows two recent bullish legs, a 20% rally in May and a 16% climb in the current move. Immediate support is at $793–$800, with holding above this zone likely to keep the breakout structure intact. Should buying pressure persist, the next targets sit between $950 and $1,000.
Long-Term Market Structure
Analysis from Crypto Yoddha points to a multi-year bullish trend for BNB, marked by higher highs and higher lows since 2018. The asset traded within an ascending channel until early 2021, when it broke out into a sharp rally.
This was followed by a long consolidation lasting over 1,000 days, during which the price repeatedly tested equal highs and equal lows.
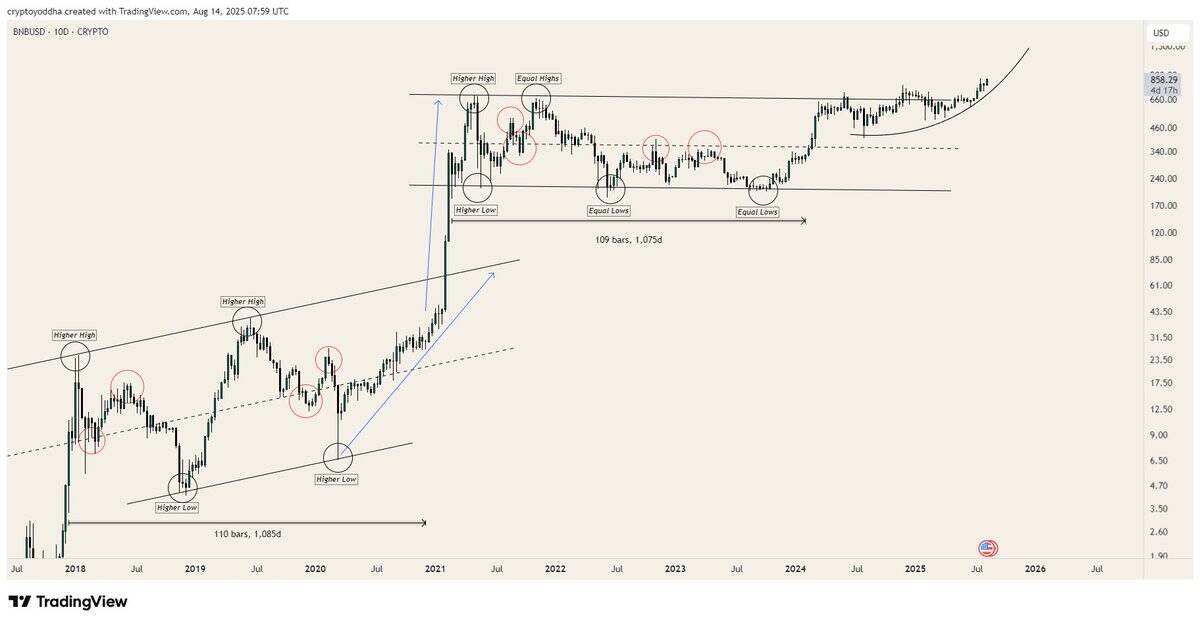
Interestingly, the latest breakout above this consolidation, paired with an upward price curve, suggests renewed momentum. Yoddha’s analysis indicates that past consolidation phases have often been followed by strong upside moves, aligning with the view that $1,000 is the next major resistance.
Meanwhile, technical indicators remain in bullish territory. The MACD line is at 27.35, above the signal line at 21.84, with a positive histogram reading of 5.51, pointing to building momentum after a recent crossover.
The RSI is at 73.35, placing BNB in overbought conditions. This level suggests strong buying interest but also the potential for short-term pullbacks if profit-taking emerges.

Rising Network Activity
Glassnode data shows active BNB addresses jumped to 1,441,548 on August 13. Activity began the week NEAR 1.15 million, dipped slightly above 1 million, and then climbed steadily, with the largest rise in recent days.

In addition, Whale Insider recently reported that BNB’s market value has climbed past $120 billion. The rise comes as more users engage with the network and price strength continues.
