Ethereum’s $4K Breakout: Bull Run or Bubble? (ETH Price Analysis August 2025)

Ethereum bulls charge toward $4,000—but can they dodge gravity?
Key levels to watch as ETH tests all-time highs
The $4K psychological barrier looms large after a 30% monthly surge. Technicals scream overbought while fundamentals whisper 'institutional adoption.' Classic crypto cognitive dissonance.
Meanwhile, TradFi analysts still can't decide if ETH is 'programmable money' or a glorified spreadsheet. Spoiler: It's both.
Will the network upgrades keep pace with the price action? Or are we witnessing another 'number go up' spectacle before the inevitable correction? Place your bets—the house always wins.
The Daily Chart
The daily chart demonstrates ETH’s upward path inside a large ascending channel. This uptrend began in the middle of April, and the price has broken multiple resistance levels to the upside.
Both the 100-day and 200-day moving averages are also located below the price now, with the 100-day MA having an upward slope following a bullish crossover earlier.
As things stand, the market is very likely to push beyond the high of $4,107 and even toward a new all-time high in the coming months, if the channel is broken to the upside.
On the other hand, however, a rejection from the higher trendline of the channel could push the price back toward the $3,200 area, which WOULD be the deciding point for whether a short-term correction or a full-on reversal is on the table.

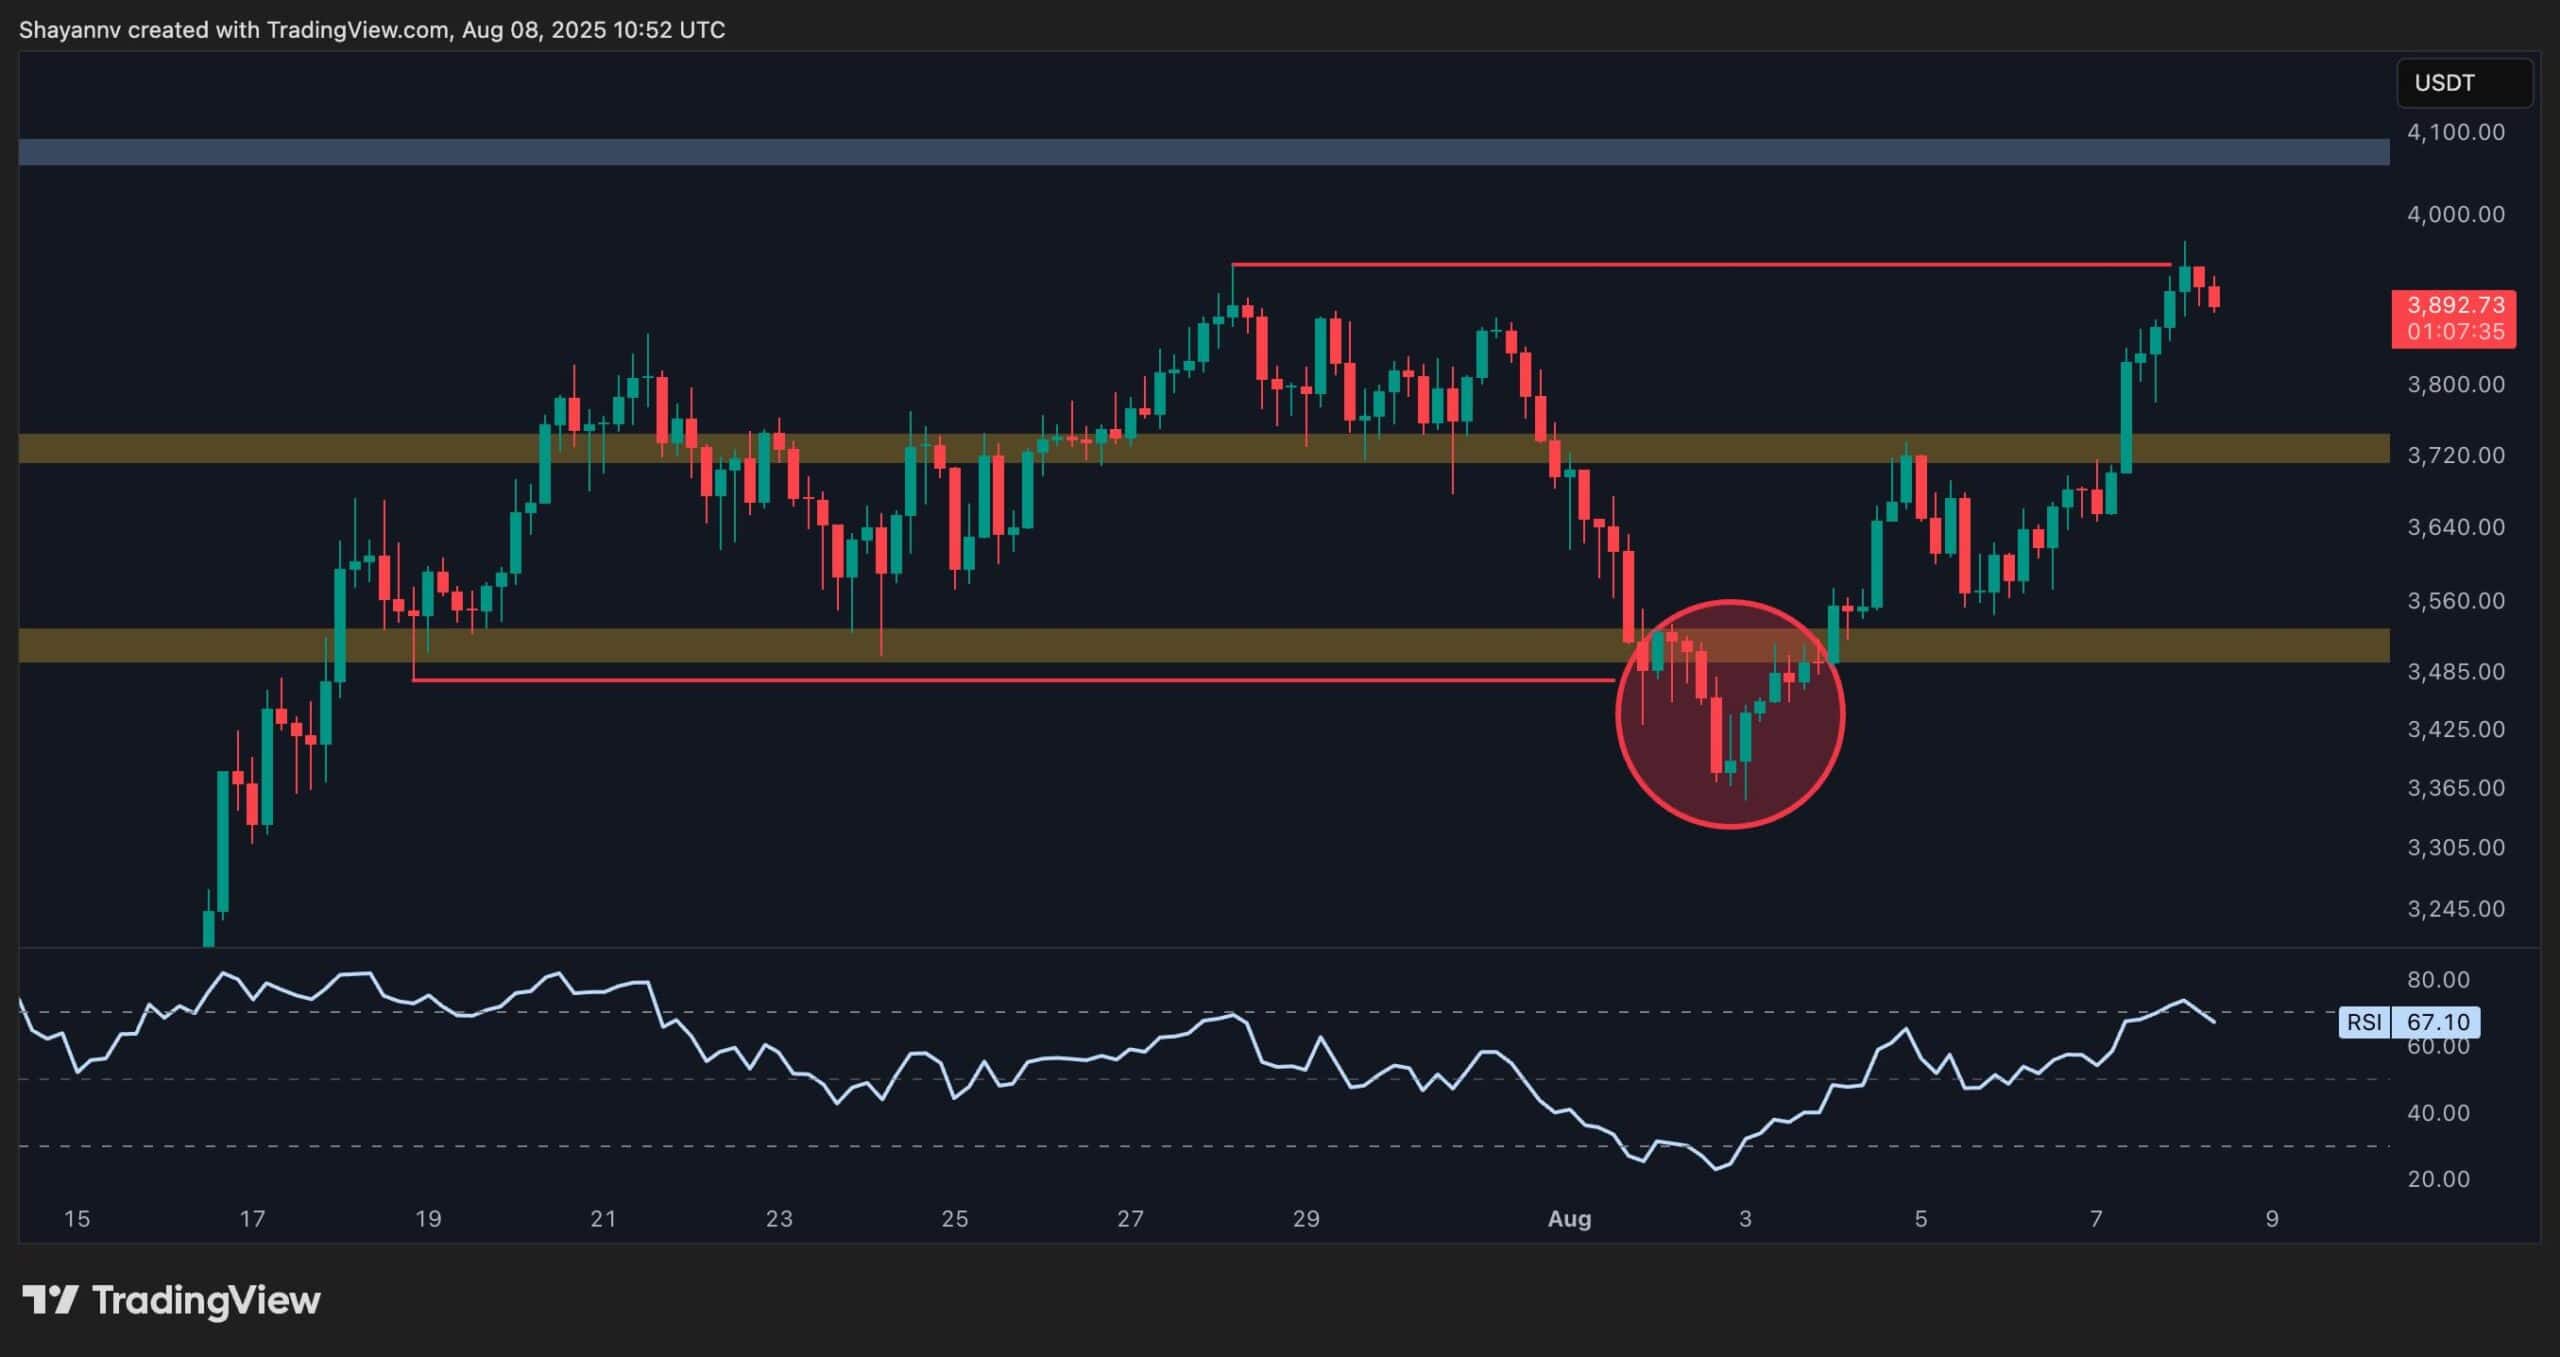
The 4-Hour Chart
The 4-hour chart shows an interesting reaccumulation phase going on, which mostly occurs after a rally. The price has been consolidating between the $3,500 and $3,800 levels, with a fake breakout and liquidity sweep occurring below the $3,500 zone.
Currently, the price is on the verge of breaking above the $3,900 high, and in case of an impulsive follow-up, the market would likely begin a new aggressive rally as ETH hunts for a new all-time high. The RSI is also around 67, confirming bullish momentum, but also hinting at a potential overbought condition occurring soon. Yet, it will not mean that the market will reverse lower, at least not before a bearish divergence occurs.
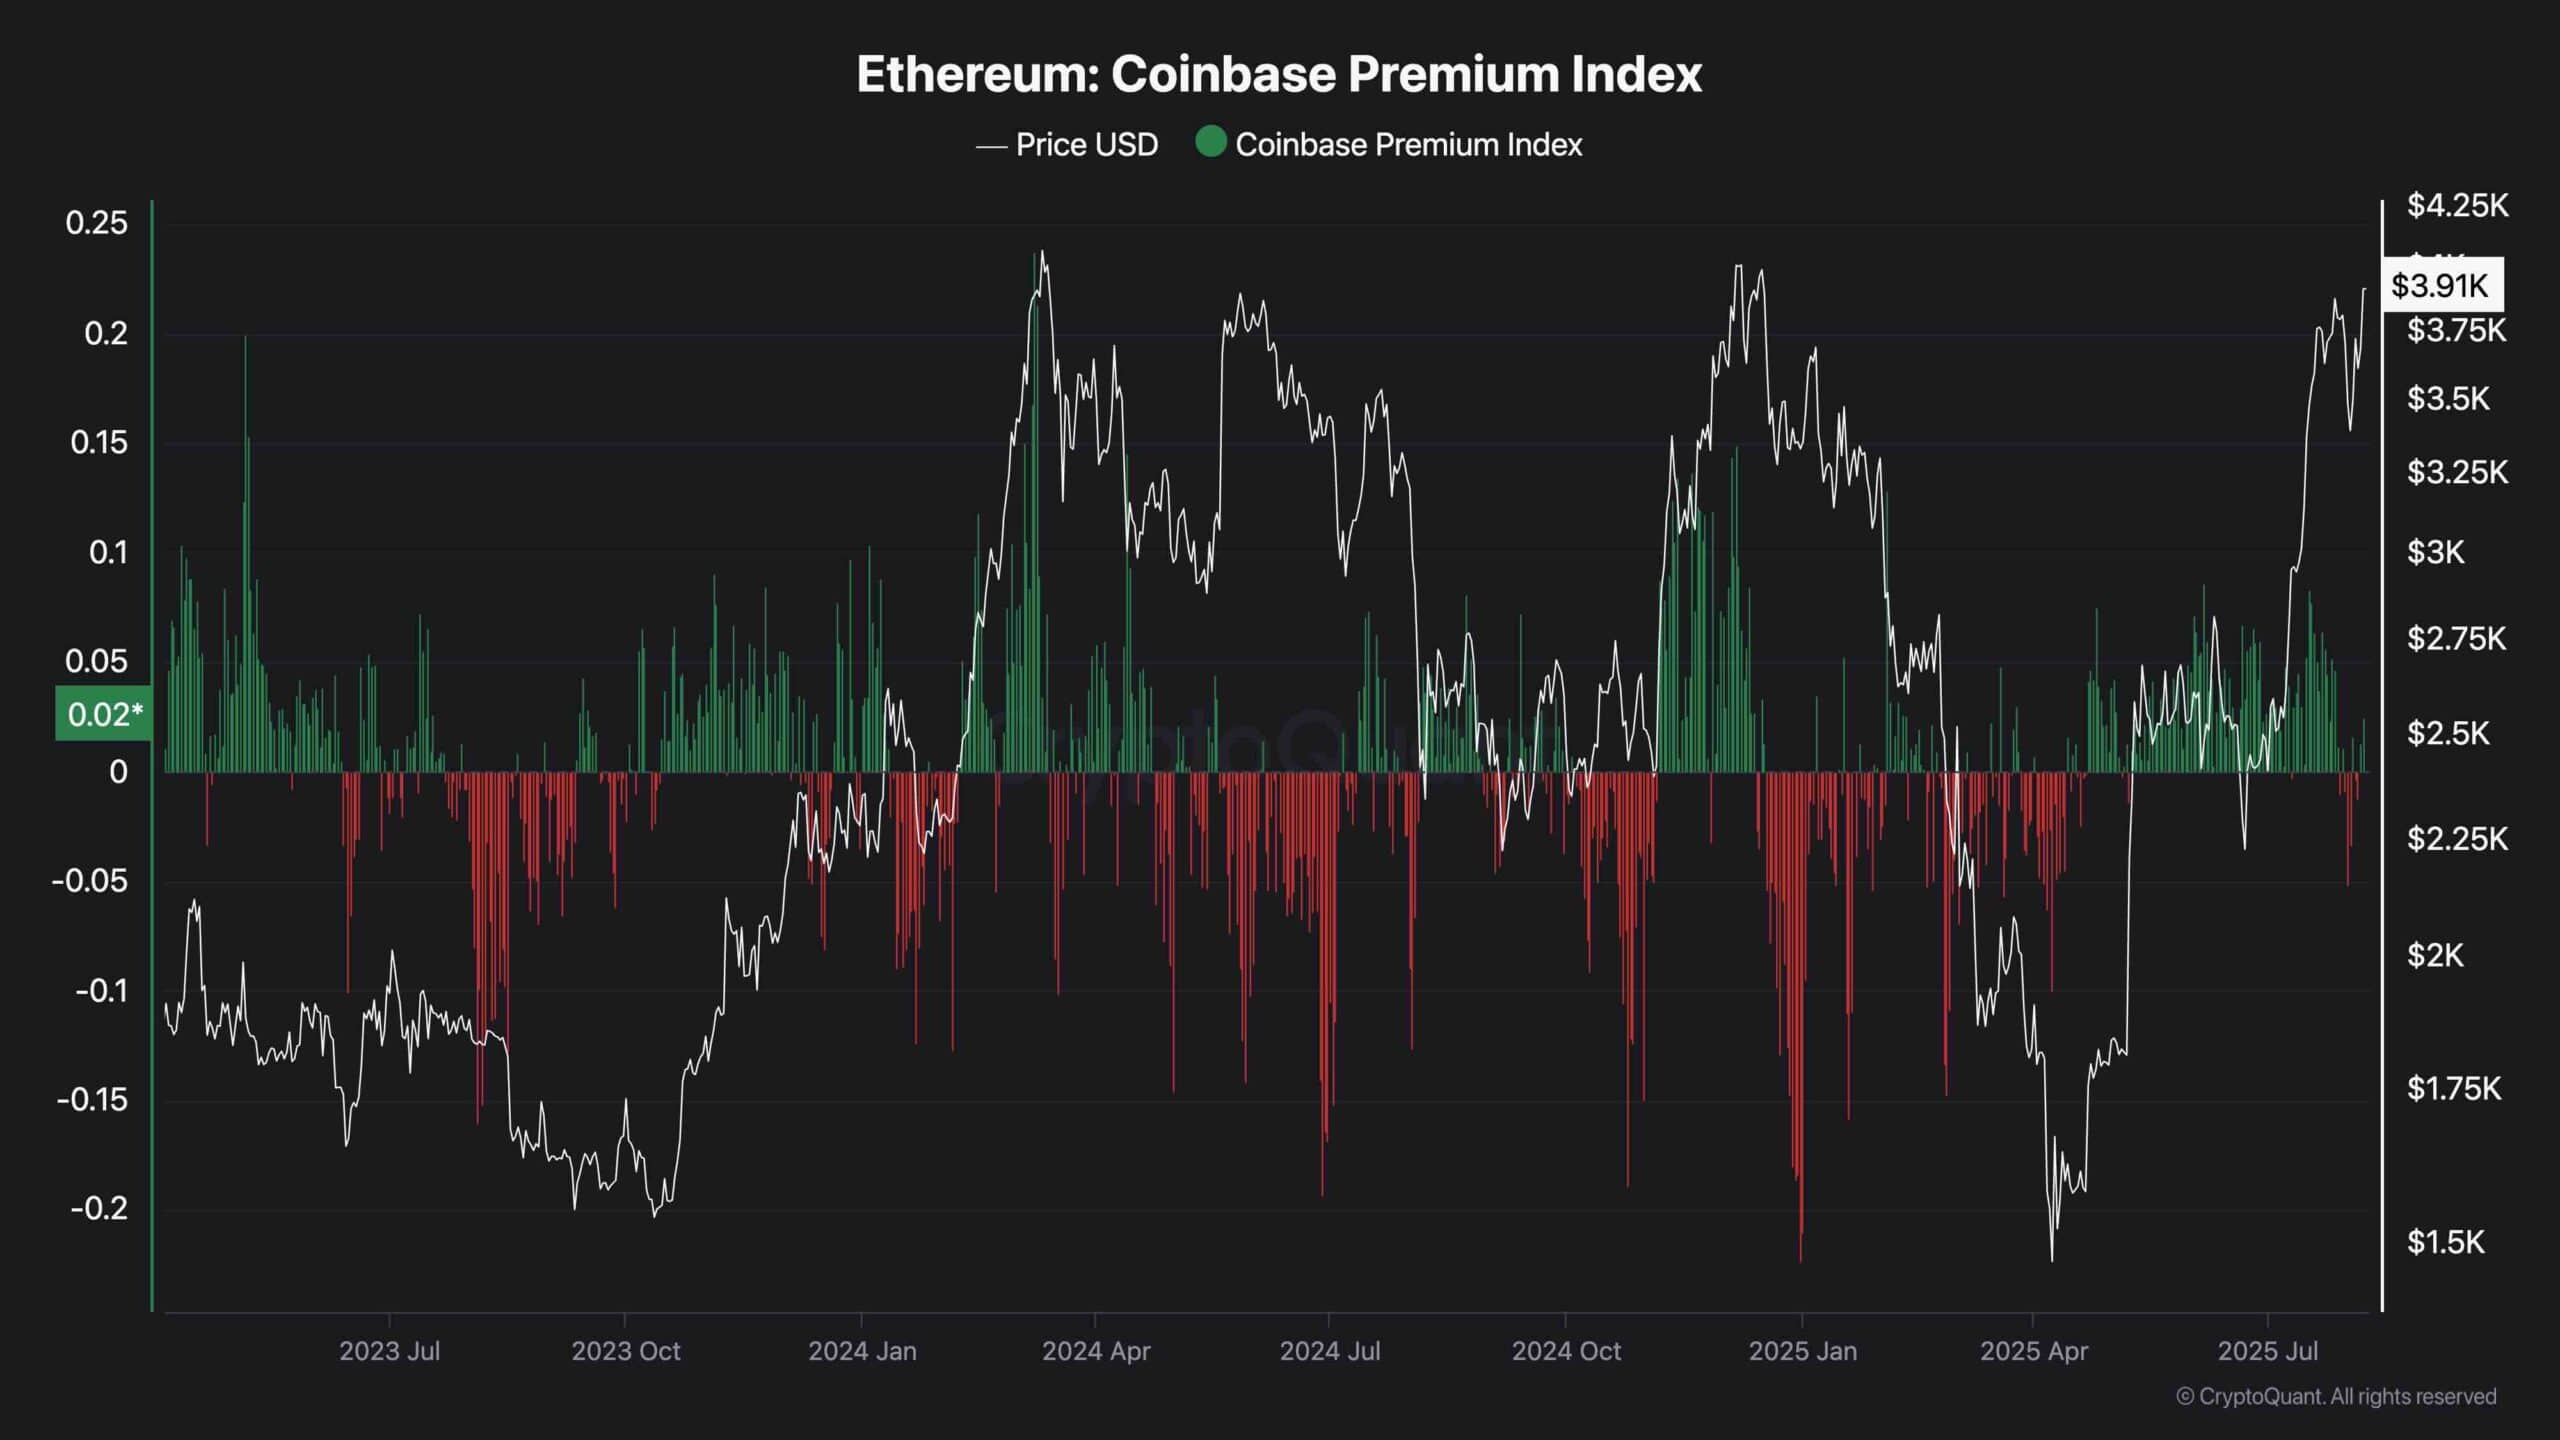
Coinbase Premium Index
The Coinbase Premium Index is a metric that measures the difference between Bitcoin’s price on Coinbase and that of Binance. As the chart shows, the index has been mostly printing positive values since the beginning of the current rally in April. This indicates that there is considerable demand from American Investors, compared to other countries.
Looking to the past, the Coinbase Premium Index demonstrates a positive correlation with price action, as positive values have led to price rallies more often than not.
Therefore, as the current situation suggests, the probability of further bullish price movement is higher than a reversal, and market sentiment supports the upward price action seen on technical charts.