Bitcoin’s Next Move: Will BTC Surge to $120K or Dip to $110K?

Bitcoin's price teeters on a knife-edge—bulls and bears clash over the next big swing.
Key levels in play: $120K beckons as a moonshot target, while $110K lurks as a potential pitstop for weak hands.
Market sentiment splits between 'hyperbitcoinization' believers and traders eyeing the 20% correction rule. Meanwhile, Wall Street's latest 'crypto expert' just discovered hardware wallets.
Volatility? Guaranteed. Boredom? Impossible. Buckle up.
The Daily Chart
Bitcoin’s daily structure shows a breakdown and pullback to the ascending channel that’s been respected for months. After the drop from $123K, and the midline of the channel, BTC has finally broken the channel to the downside and is consolidating below it. This is a concerning development, as it might lead to deeper corrections.
The price is currently attempting to hold above the 100-day moving average, which is located NEAR the $110K support level. The RSI also sits around 51, signaling a neutral momentum state.
Yet, if a bearish shift occurs following a rejection from the channel’s lower boundary, and the $110K level breaks down, the next high-confluence zone lies around the psychological $100K level. This zone also aligns with the key 200-day moving average.

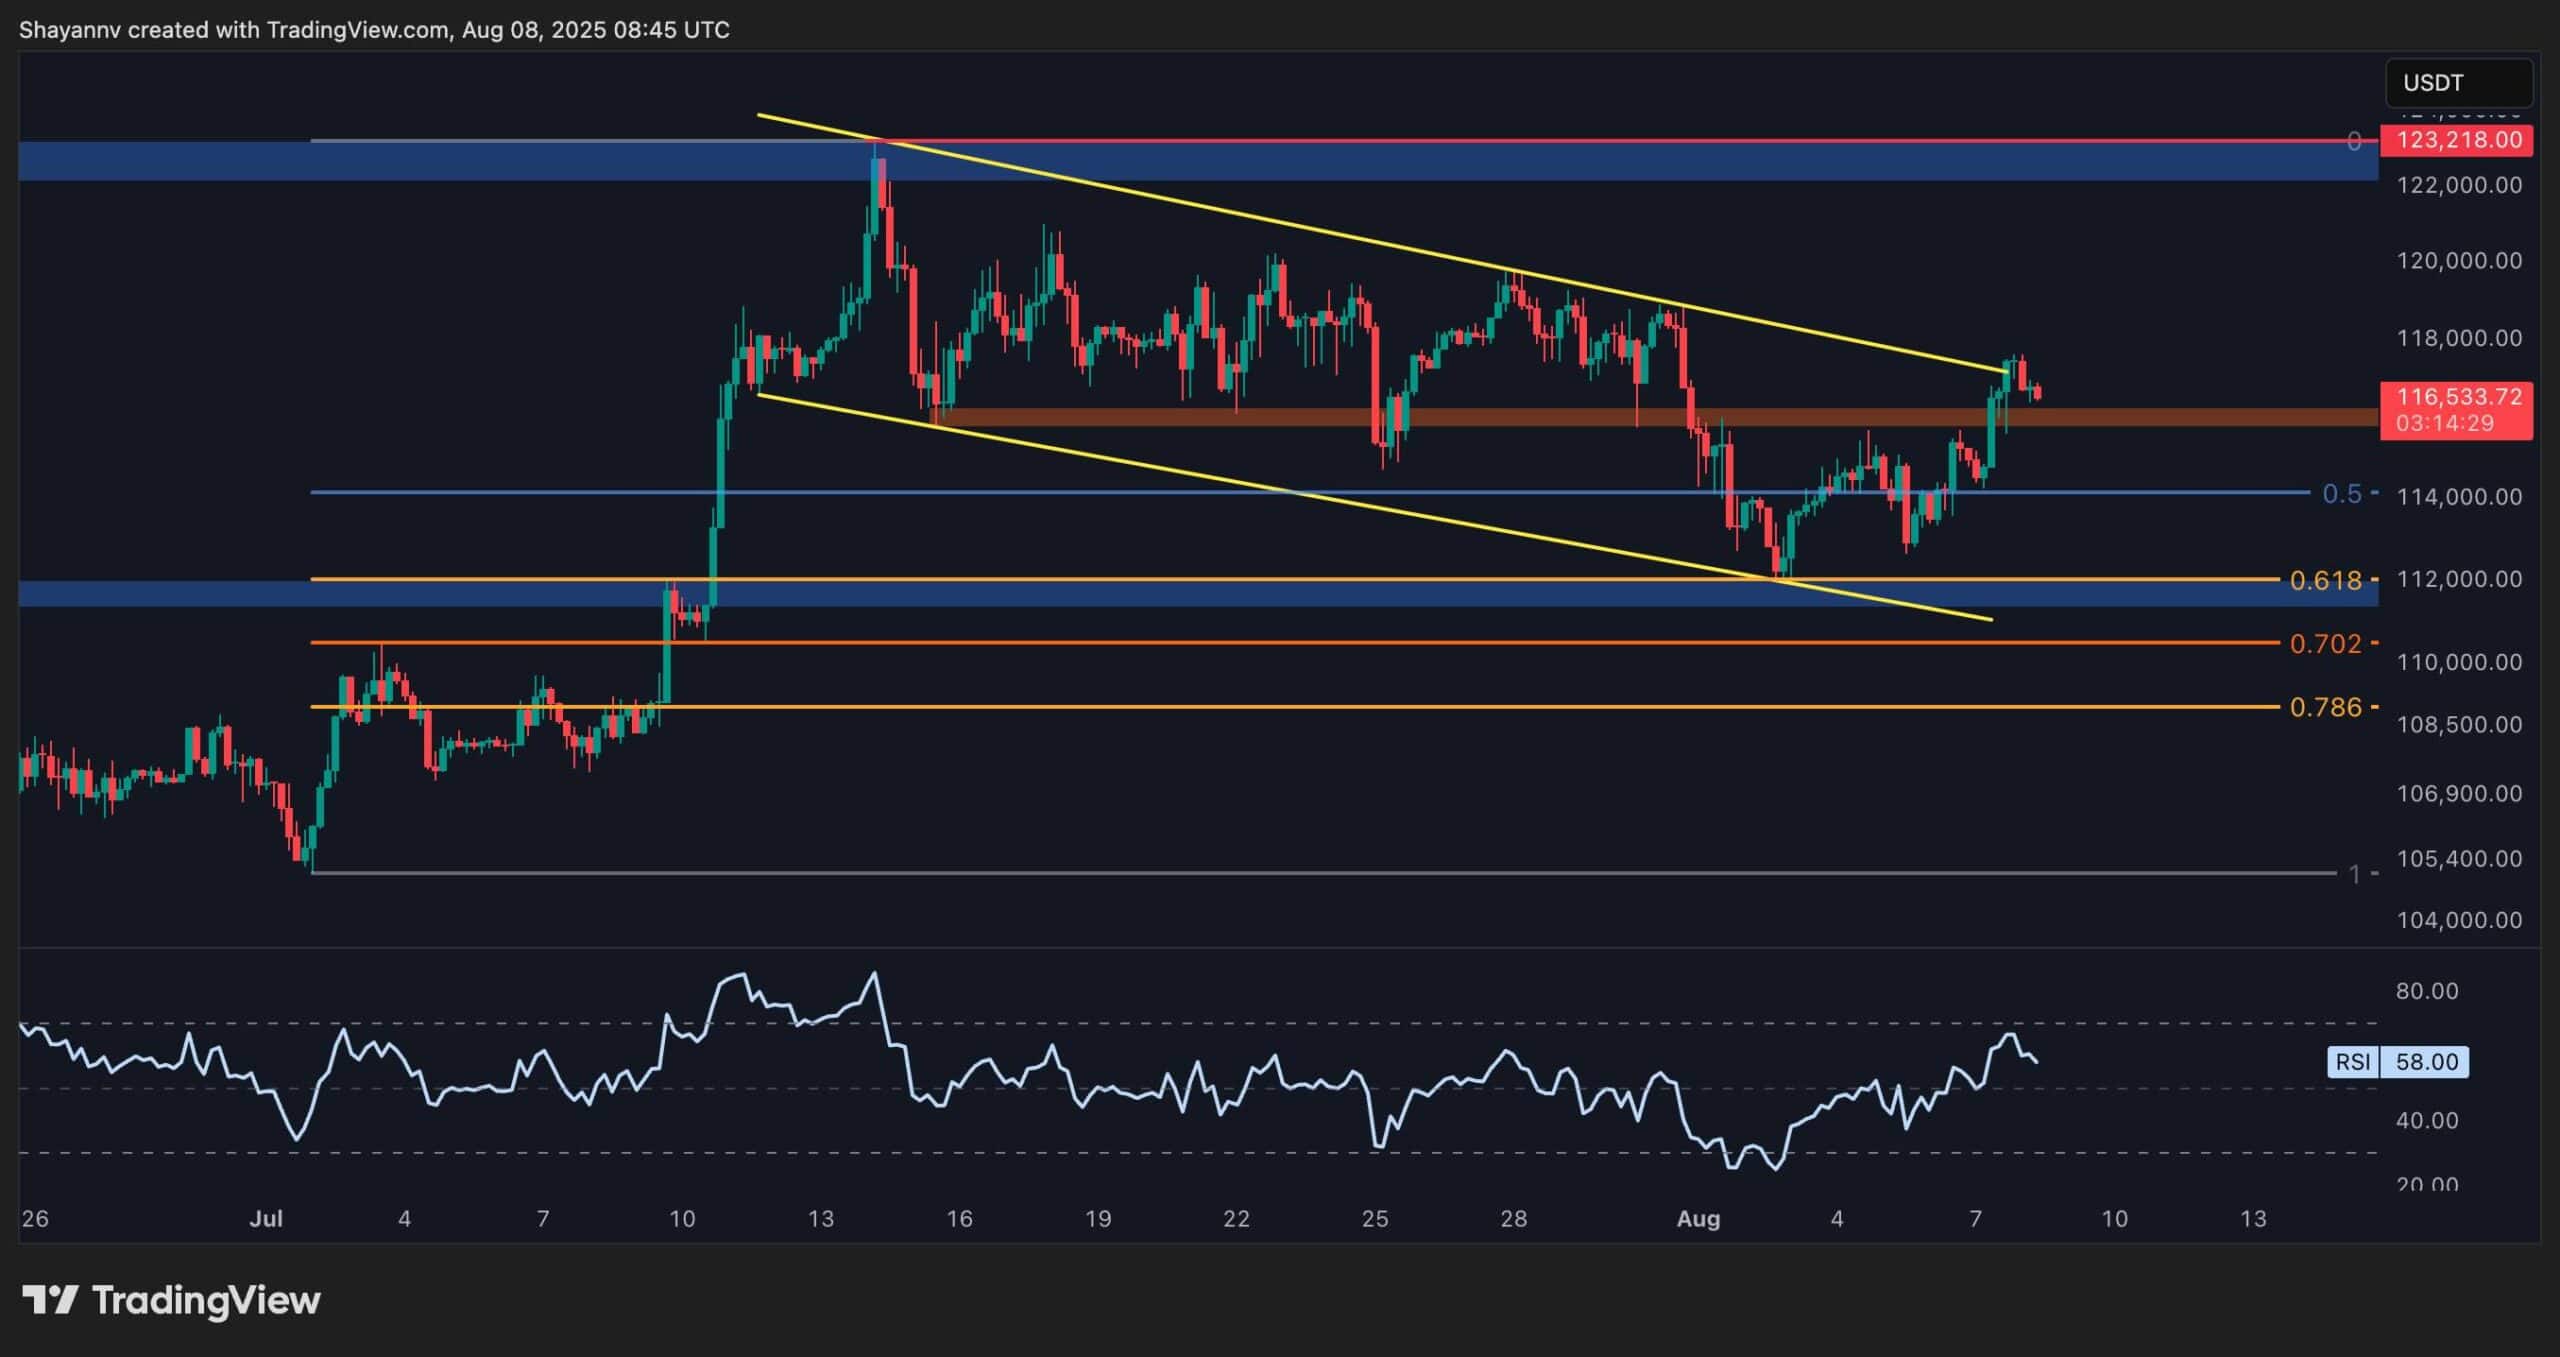
The 4-Hour Chart
The 4-hour chart shows BTC declining inside a descending channel since the price dropped from the $123K level. The cryptocurrency is now trying to break the channel to the upside, as it broke through the $116K short-term resistance.
The price is rebounding from the 50% area of the Fibonacci retracement tool, which also adds to the probability of a bullish continuation to begin from this zone.
Moreover, the RSI is showing a bullish shift in momentum as it has risen above the 50% level. As a result, if the price holds above the $116K level, it will likely break out of the descending channel and rally toward the $123K all-time high and beyond in the coming weeks.
Onchain Analysis
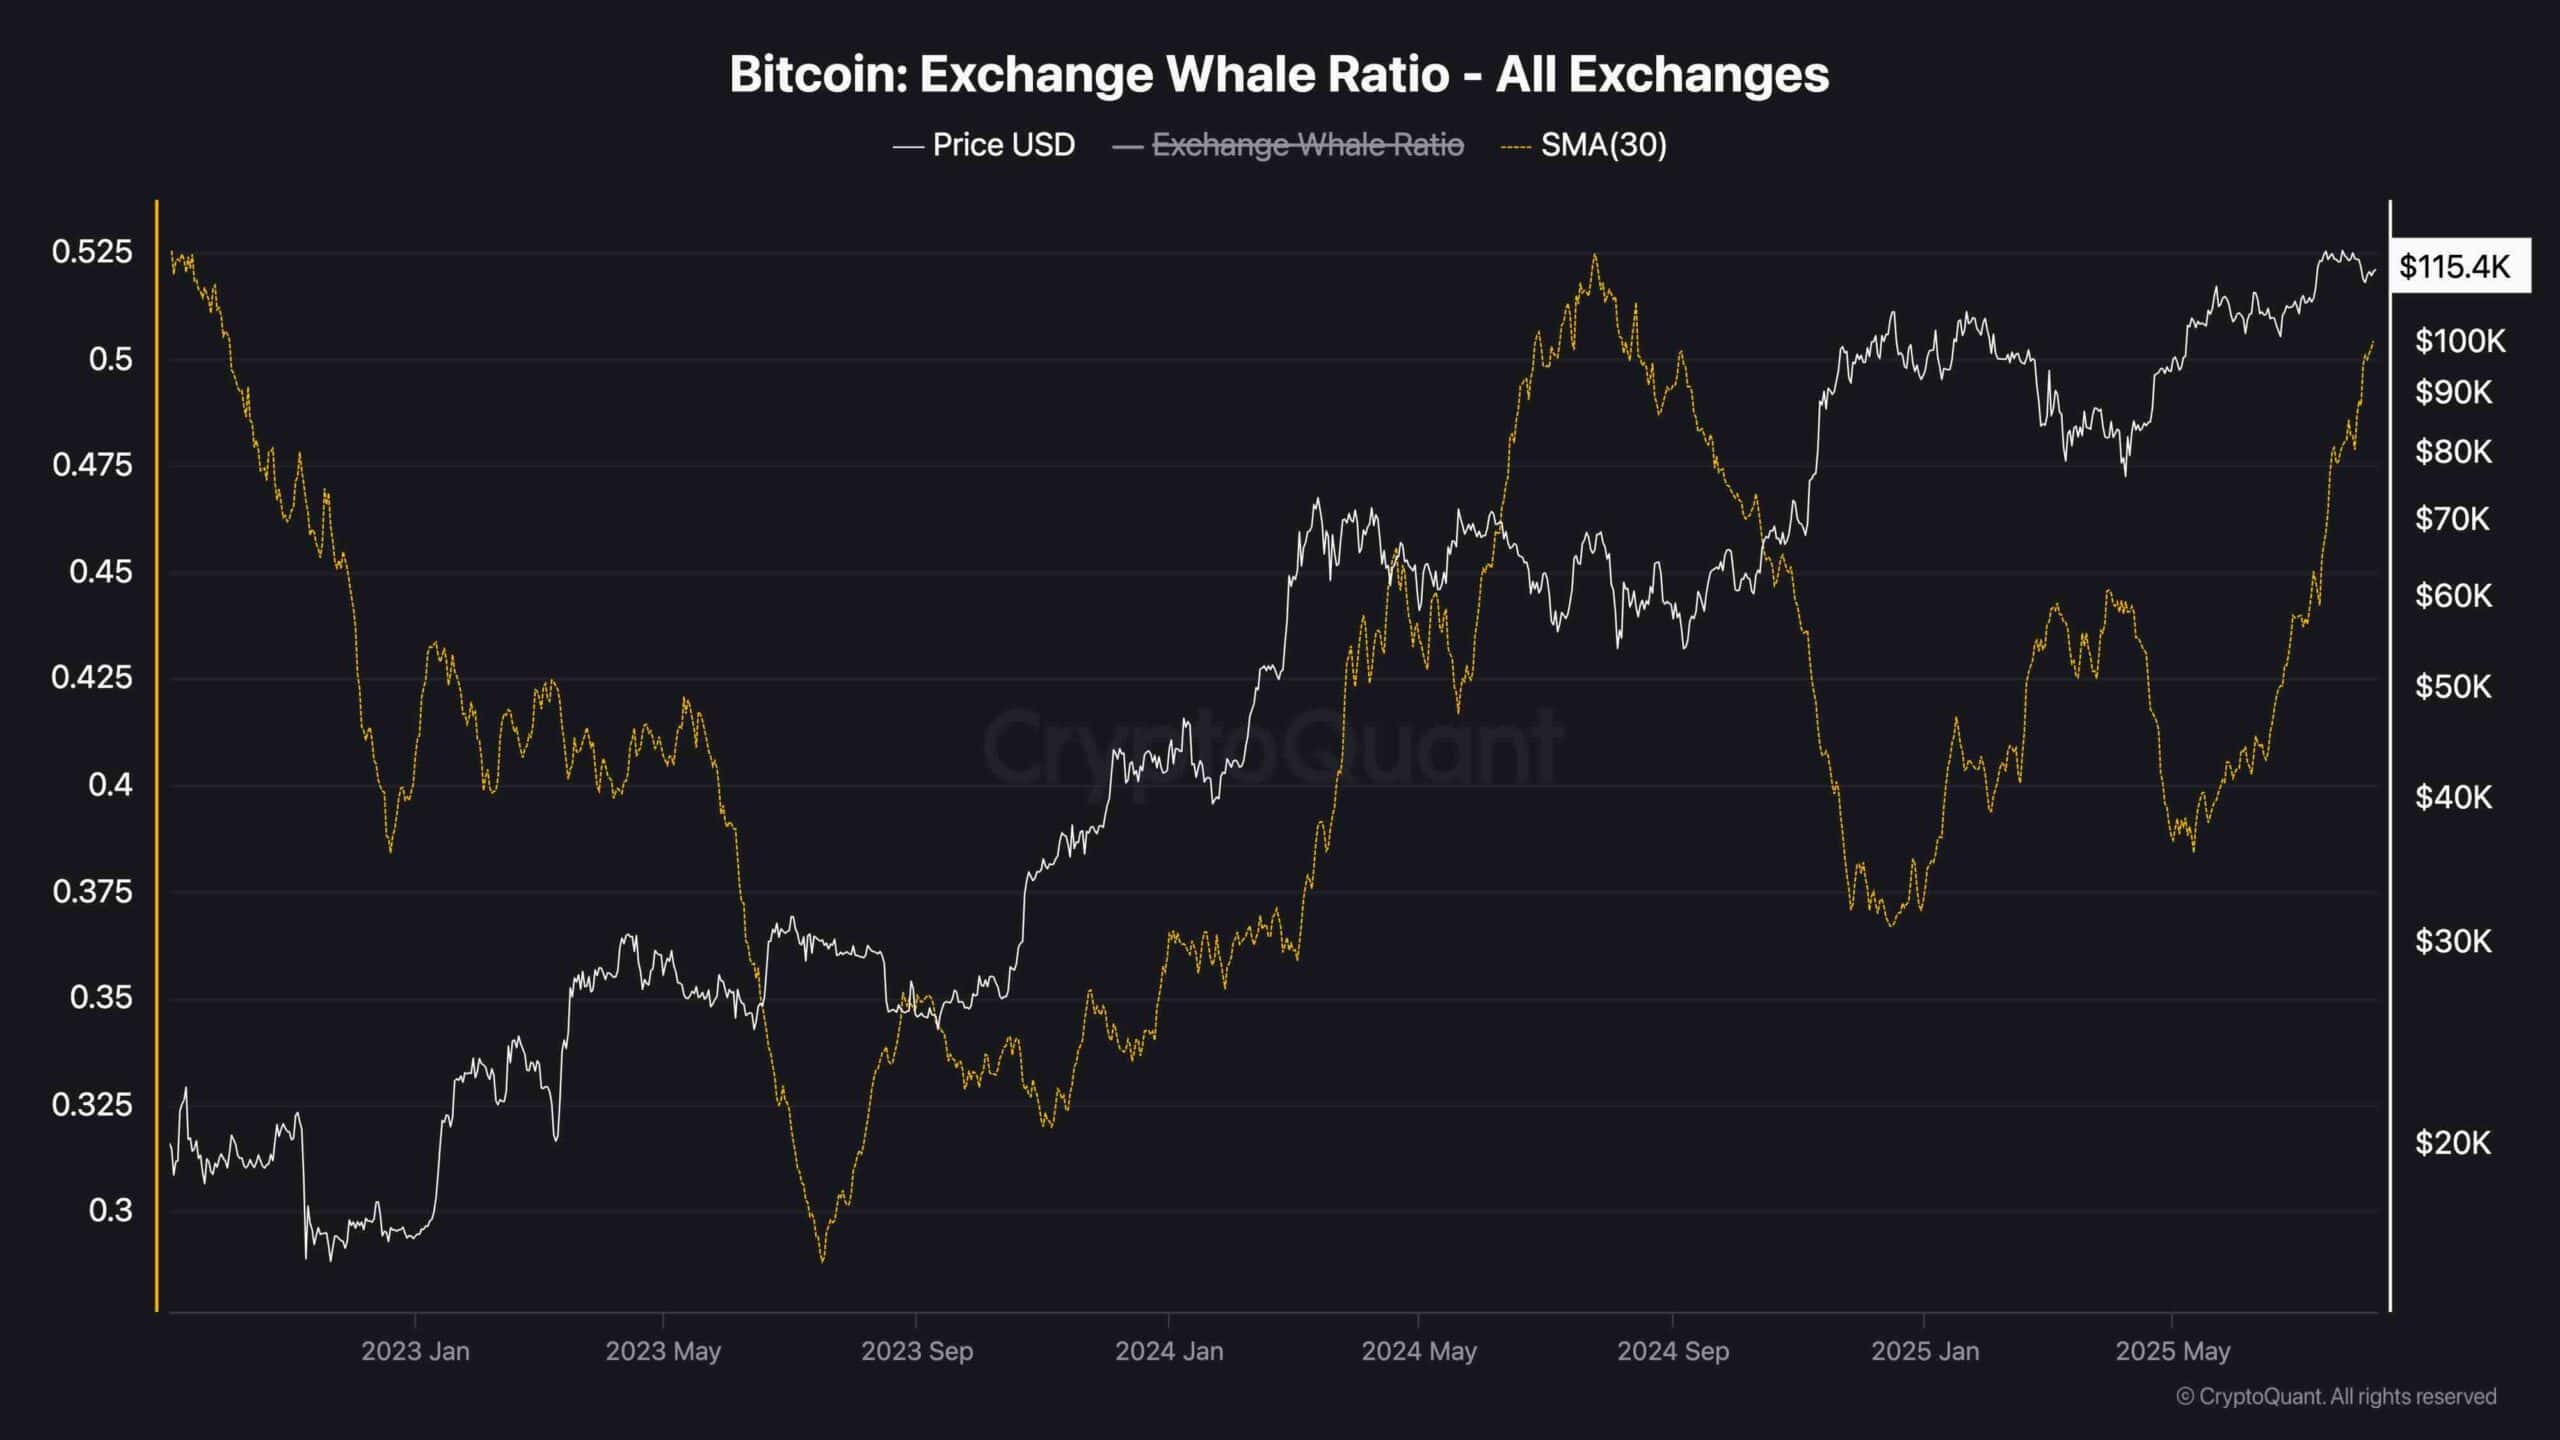
Exchange Whale Ratio
The Exchange Whale Ratio is flashing a warning signal. It has been steadily climbing and is now at its highest level since early 2023. Historically, such spikes, especially above 0.5, tend to precede either distribution events or significant profit-taking, as large holders increasingly dominate inflows to exchanges.
This rise, combined with the stalled momentum in price, suggests whales may be preparing to offload into strength.
While it doesn’t guarantee a reversal, it typically marks local tops or slower price progress until new demand kicks in. Traders should watch closely for on-chain outflows and derivatives positioning to see if the current uptick in whale activity turns into real selling pressure.