🚨 Bitcoin Bloodbath Incoming? Analysts Fear Nosedive Below $111K as Support Crumbles

Bitcoin's throne is wobbling. After months of bullish momentum, the king of crypto now faces its most critical test since the 2024 halving.
The $111K cliff edge
Technical charts are flashing red as BTC struggles to hold key support levels. One false move could trigger a cascading liquidation event—Wall Street short-sellers are already licking their chops.
Whale watching season
On-chain data shows mega-holders quietly moving stacks to cold storage. Either they're playing 4D chess... or bracing for impact. Meanwhile, retail traders keep leverage long like it's still 2021.
Remember: Bitcoin doesn't care about your feelings—or your overleveraged position. This could get messy before the next leg up. (But hey, at least it's more exciting than watching Treasury yields decay.)
Technical Analysis
By ShayanMarkets
The Daily Chart
Bitcoin’s price consolidation continues just below its all-time high of $123K, hovering between the $116K and $120K levels. This price behavior signals an equilibrium zone, where buying and selling pressure are currently balanced, a sign that the market awaits a fresh catalyst.
Importantly, this range also aligns with the 0.5-0.618 levels of the Trend-Based Fibonacci Extension, adding further technical significance to the current resistance zone. Given the lack of strong bullish momentum, a deeper correction below $116K is likely, with the $111K zone emerging as the next key target.
The 4-Hour Chart
On the lower timeframe, BTC appears to be forming a bullish flag — a classic continuation pattern. Despite multiple rebounds from the $116K support, repeated testing suggests growing vulnerability.
These reactions have likely created a sell-side liquidity pool just below $116K, increasing the probability of a liquidity sweep followed by a bearish breakout. Should this support level fail, the asset could swiftly decline toward the flag’s lower boundary NEAR $111K.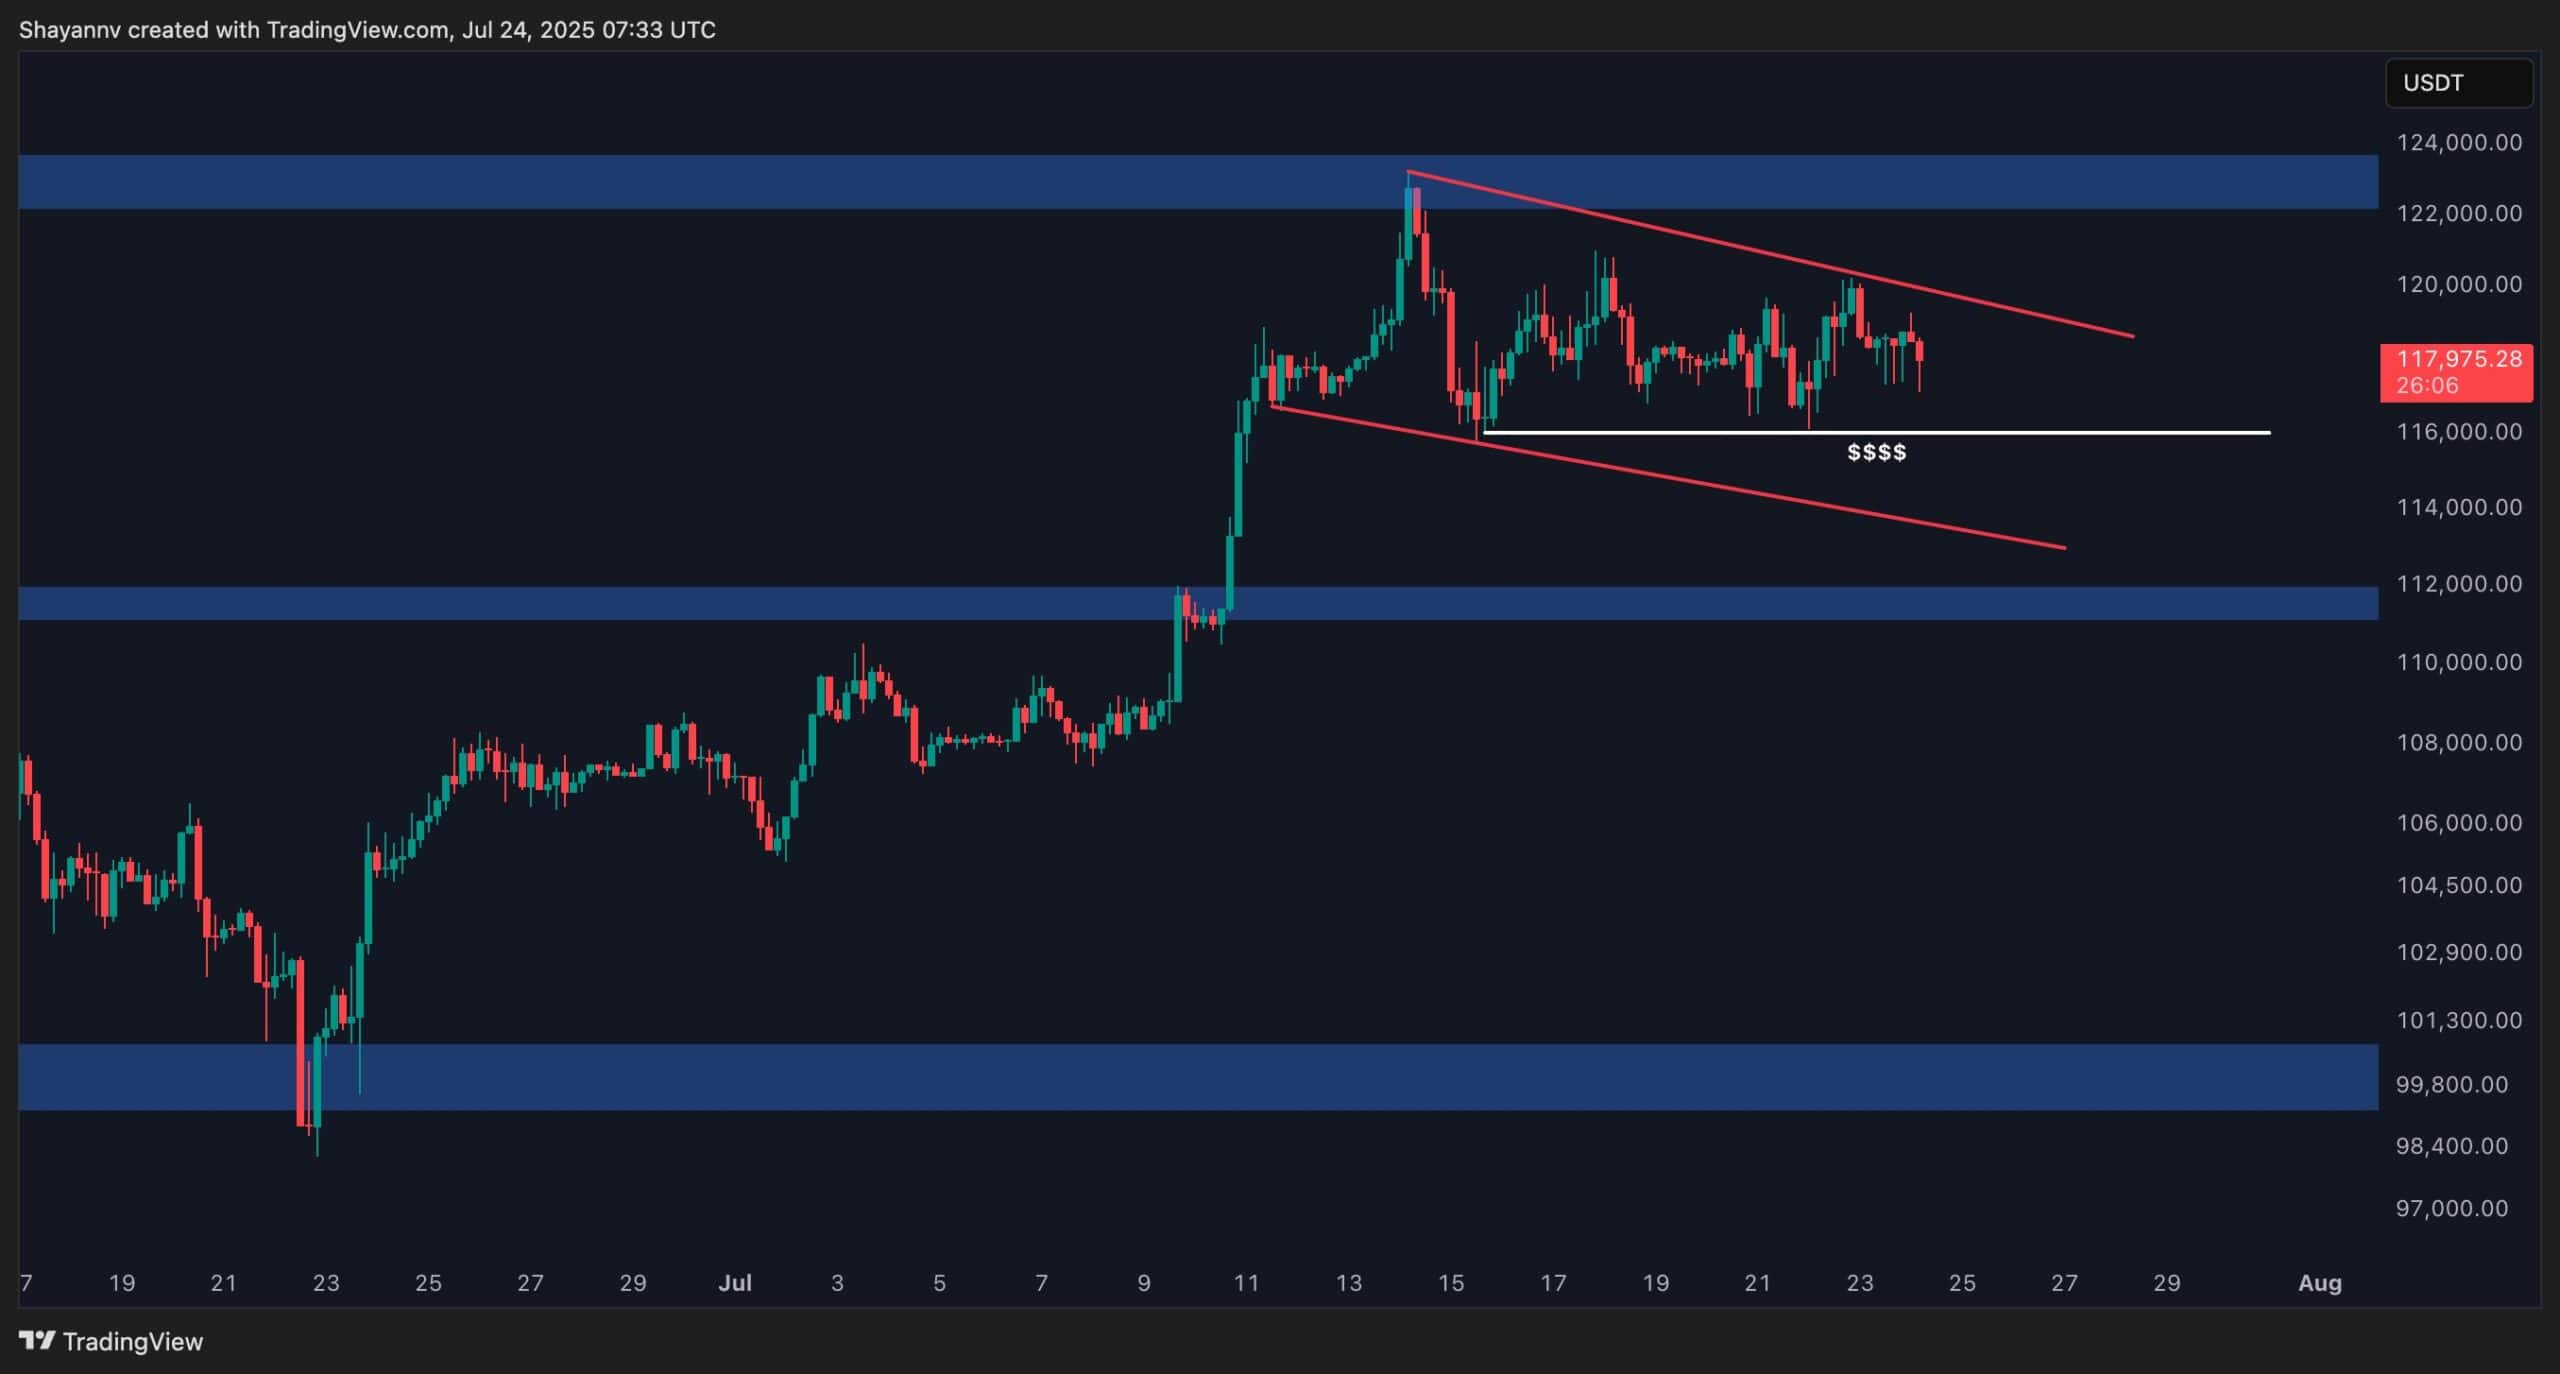
On-chain Analysis
By ShayanMarkets
The Binance BTC/USDT Liquidation Heatmap reveals a critical tug-of-war in the current market structure. Bitcoin’s price is currently trapped between two major liquidity clusters, with significant liquidation pools above $120K and below $116K.
These zones represent a high concentration of Leveraged futures positions, making them prime targets for smart money and market makers seeking liquidity. A price move toward either level could trigger a cascade of liquidations, intensifying volatility and rapidly accelerating price action.
As a result, Bitcoin remains range-bound between these two zones until one side is taken out. A breakout above $120K or a breakdown below $116K will likely lead to a sharp, directional move, fueled by stop-losses and forced liquidations.
Traders should keep a close eye on these levels and prepare for potential whipsaw volatility once either threshold is breached.

Log in to Reply
Log in to comment your thoughtsComments
Related Articles
|Square
Get the BTCC app to start your crypto journey
Get started today Scan to join our 100M+ users