Ethereum Soars: ETH Eyes $4K After Stellar 25% Weekly Rally

Ethereum isn't just climbing—it's moonwalking past resistance levels like they're going out of style. With a 25% weekly pump, the smart contract giant has traders whispering 'bull market' into their overpriced lattes.
The $4K psychological magnet
That four-grand price target isn't just a number—it's a flashing neon sign for institutional bagholders who missed the last train. ETH's chart looks cleaner than a Swiss bank's ledger, and the momentum? Let's just say even Bitcoin maximalists are sneaking glances.
Liquidity hunters on the prowl
Market makers are circling like sharks in a DeFi yield pool, hungry for that sweet, sweet volatility. Meanwhile, Wall Street's still trying to figure out if Ethereum is a stock, a bond, or that intern's NFT side project.
One thing's certain—when ETH moves, it moves fast. Whether this rally sustains or becomes another 'buy the rumor, sell the news' classic remains to be seen. But for now? The bulls are running—and they're not asking for permission.
The Daily Chart
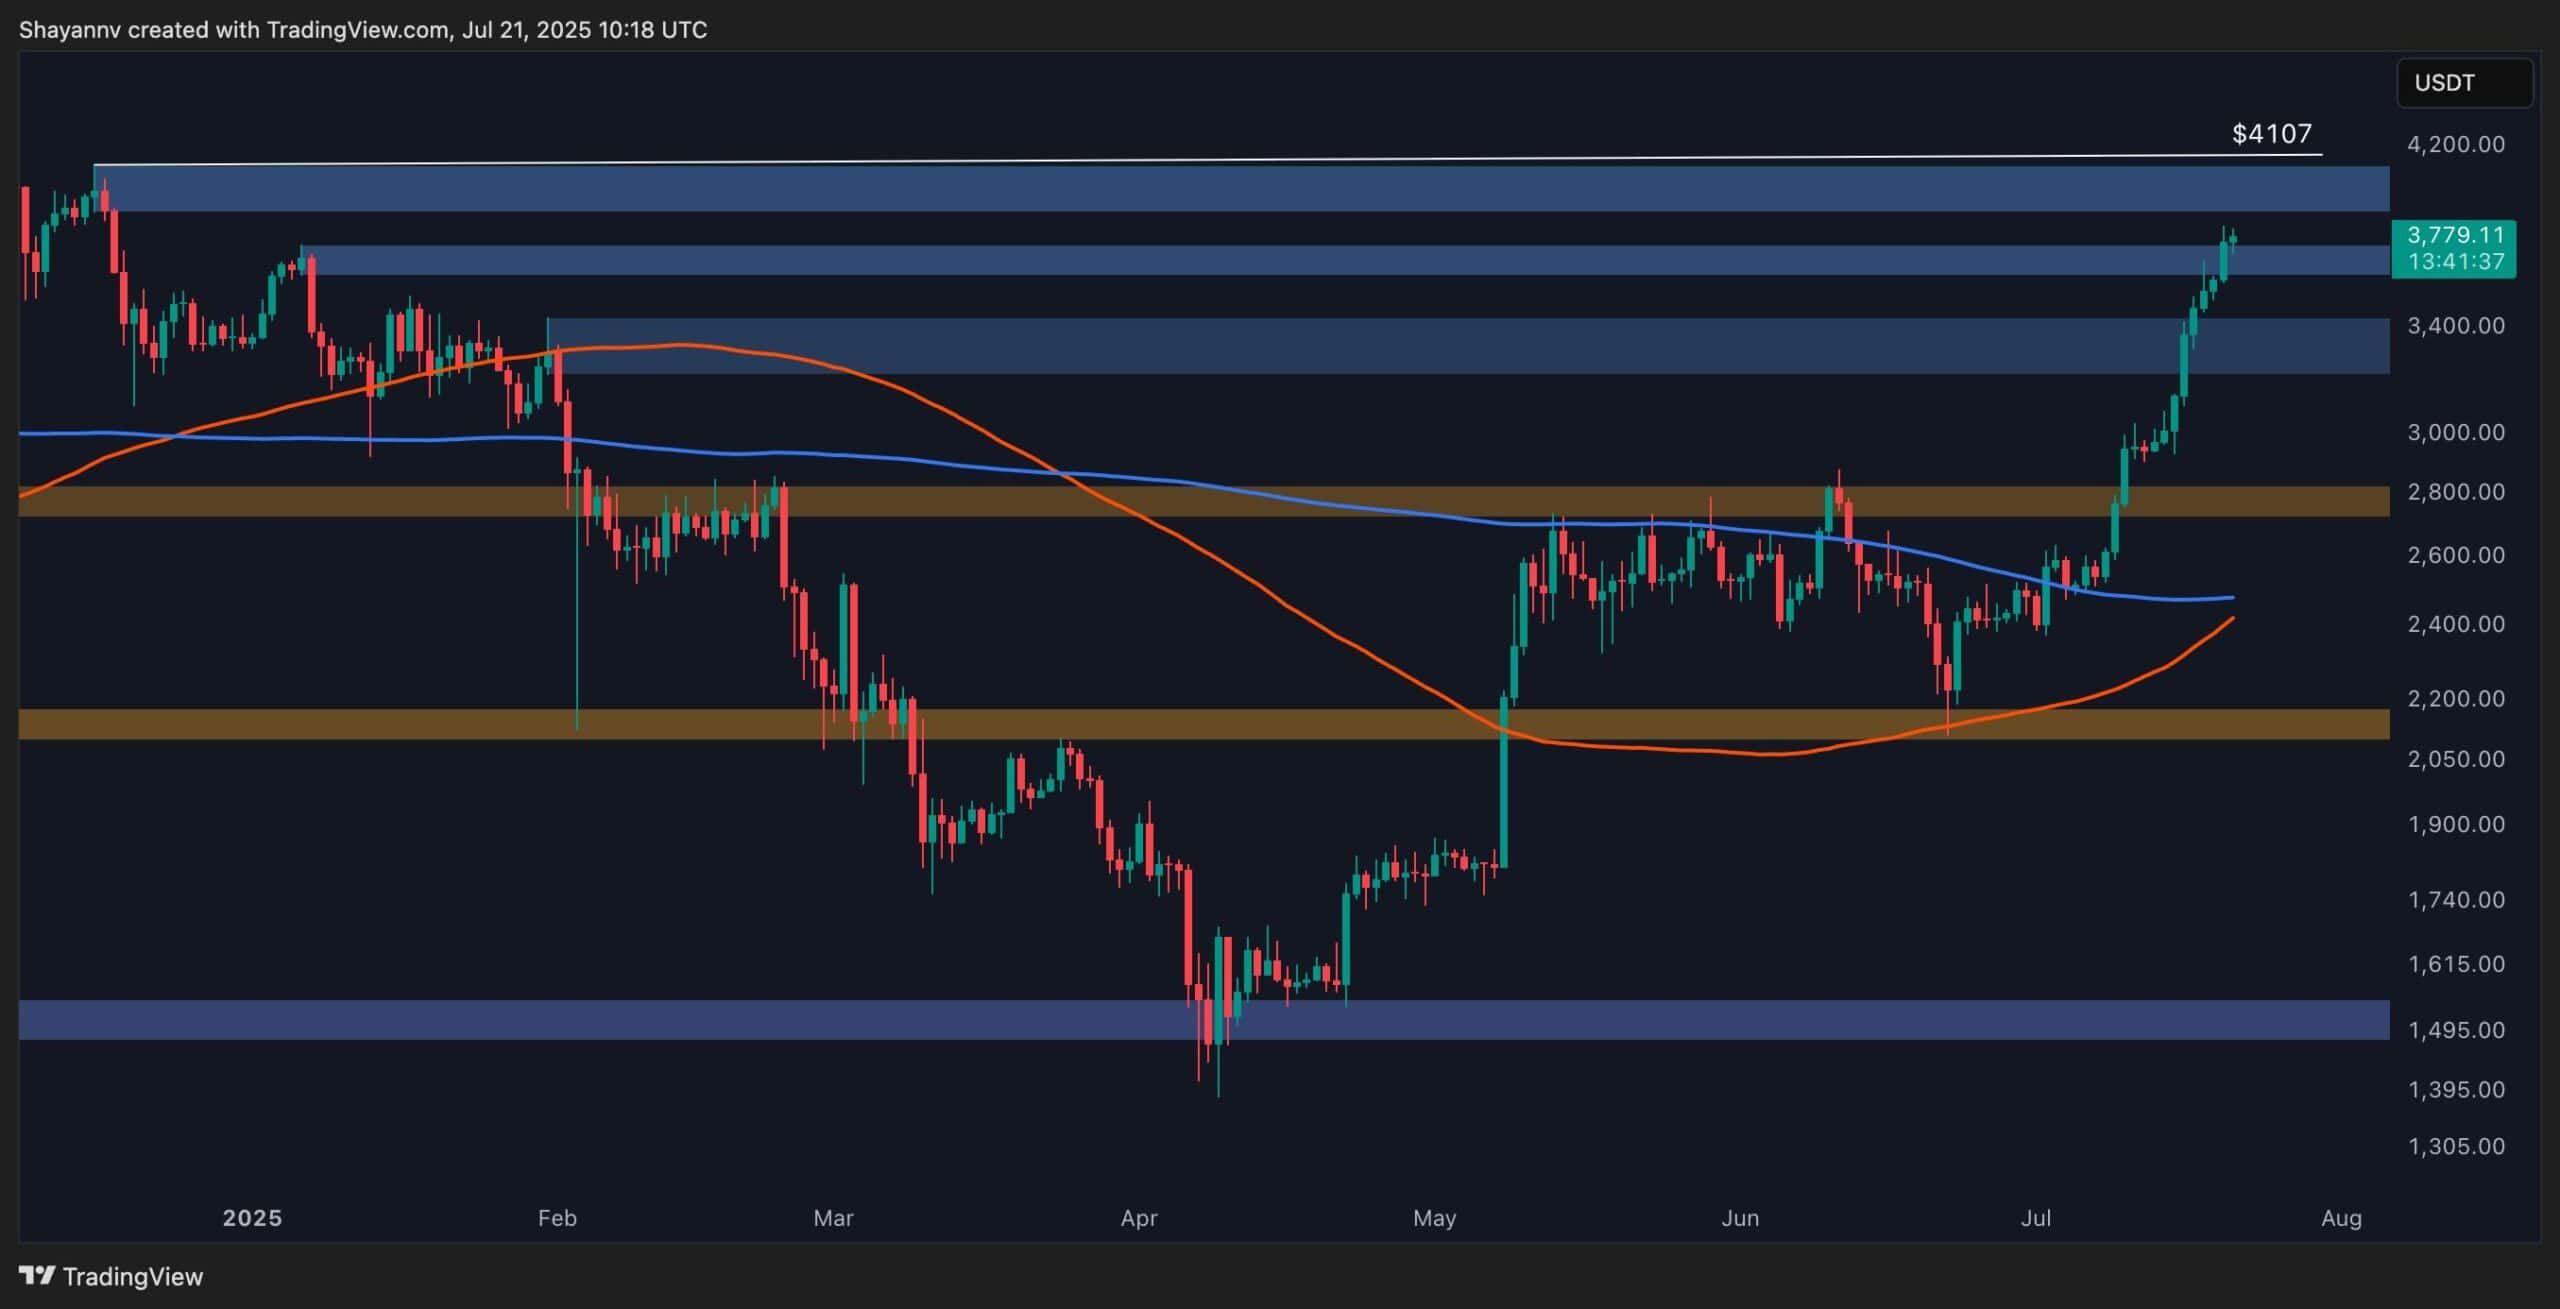
Ethereum has pushed aggressively through the $2,800 and $3,400 resistance levels over the past two weeks, showing very strong bullish structure. The 100 and 200-day moving averages are now on the verge of making a bullish crossover NEAR the $2,500 mark, acting as dynamic support during this impulse move.
The price has now entered a major supply zone between $3,700 and $4,100, an area containing a cluster of bearish order blocks. If buyers maintain control, the next major target sits at $4,107, which is the last price high created in early 2024.
However, the buyers should be cautious of potential profit-taking in this zone. This is especially important if the price begins to stall around the current resistance range.
The 4-Hour Chart
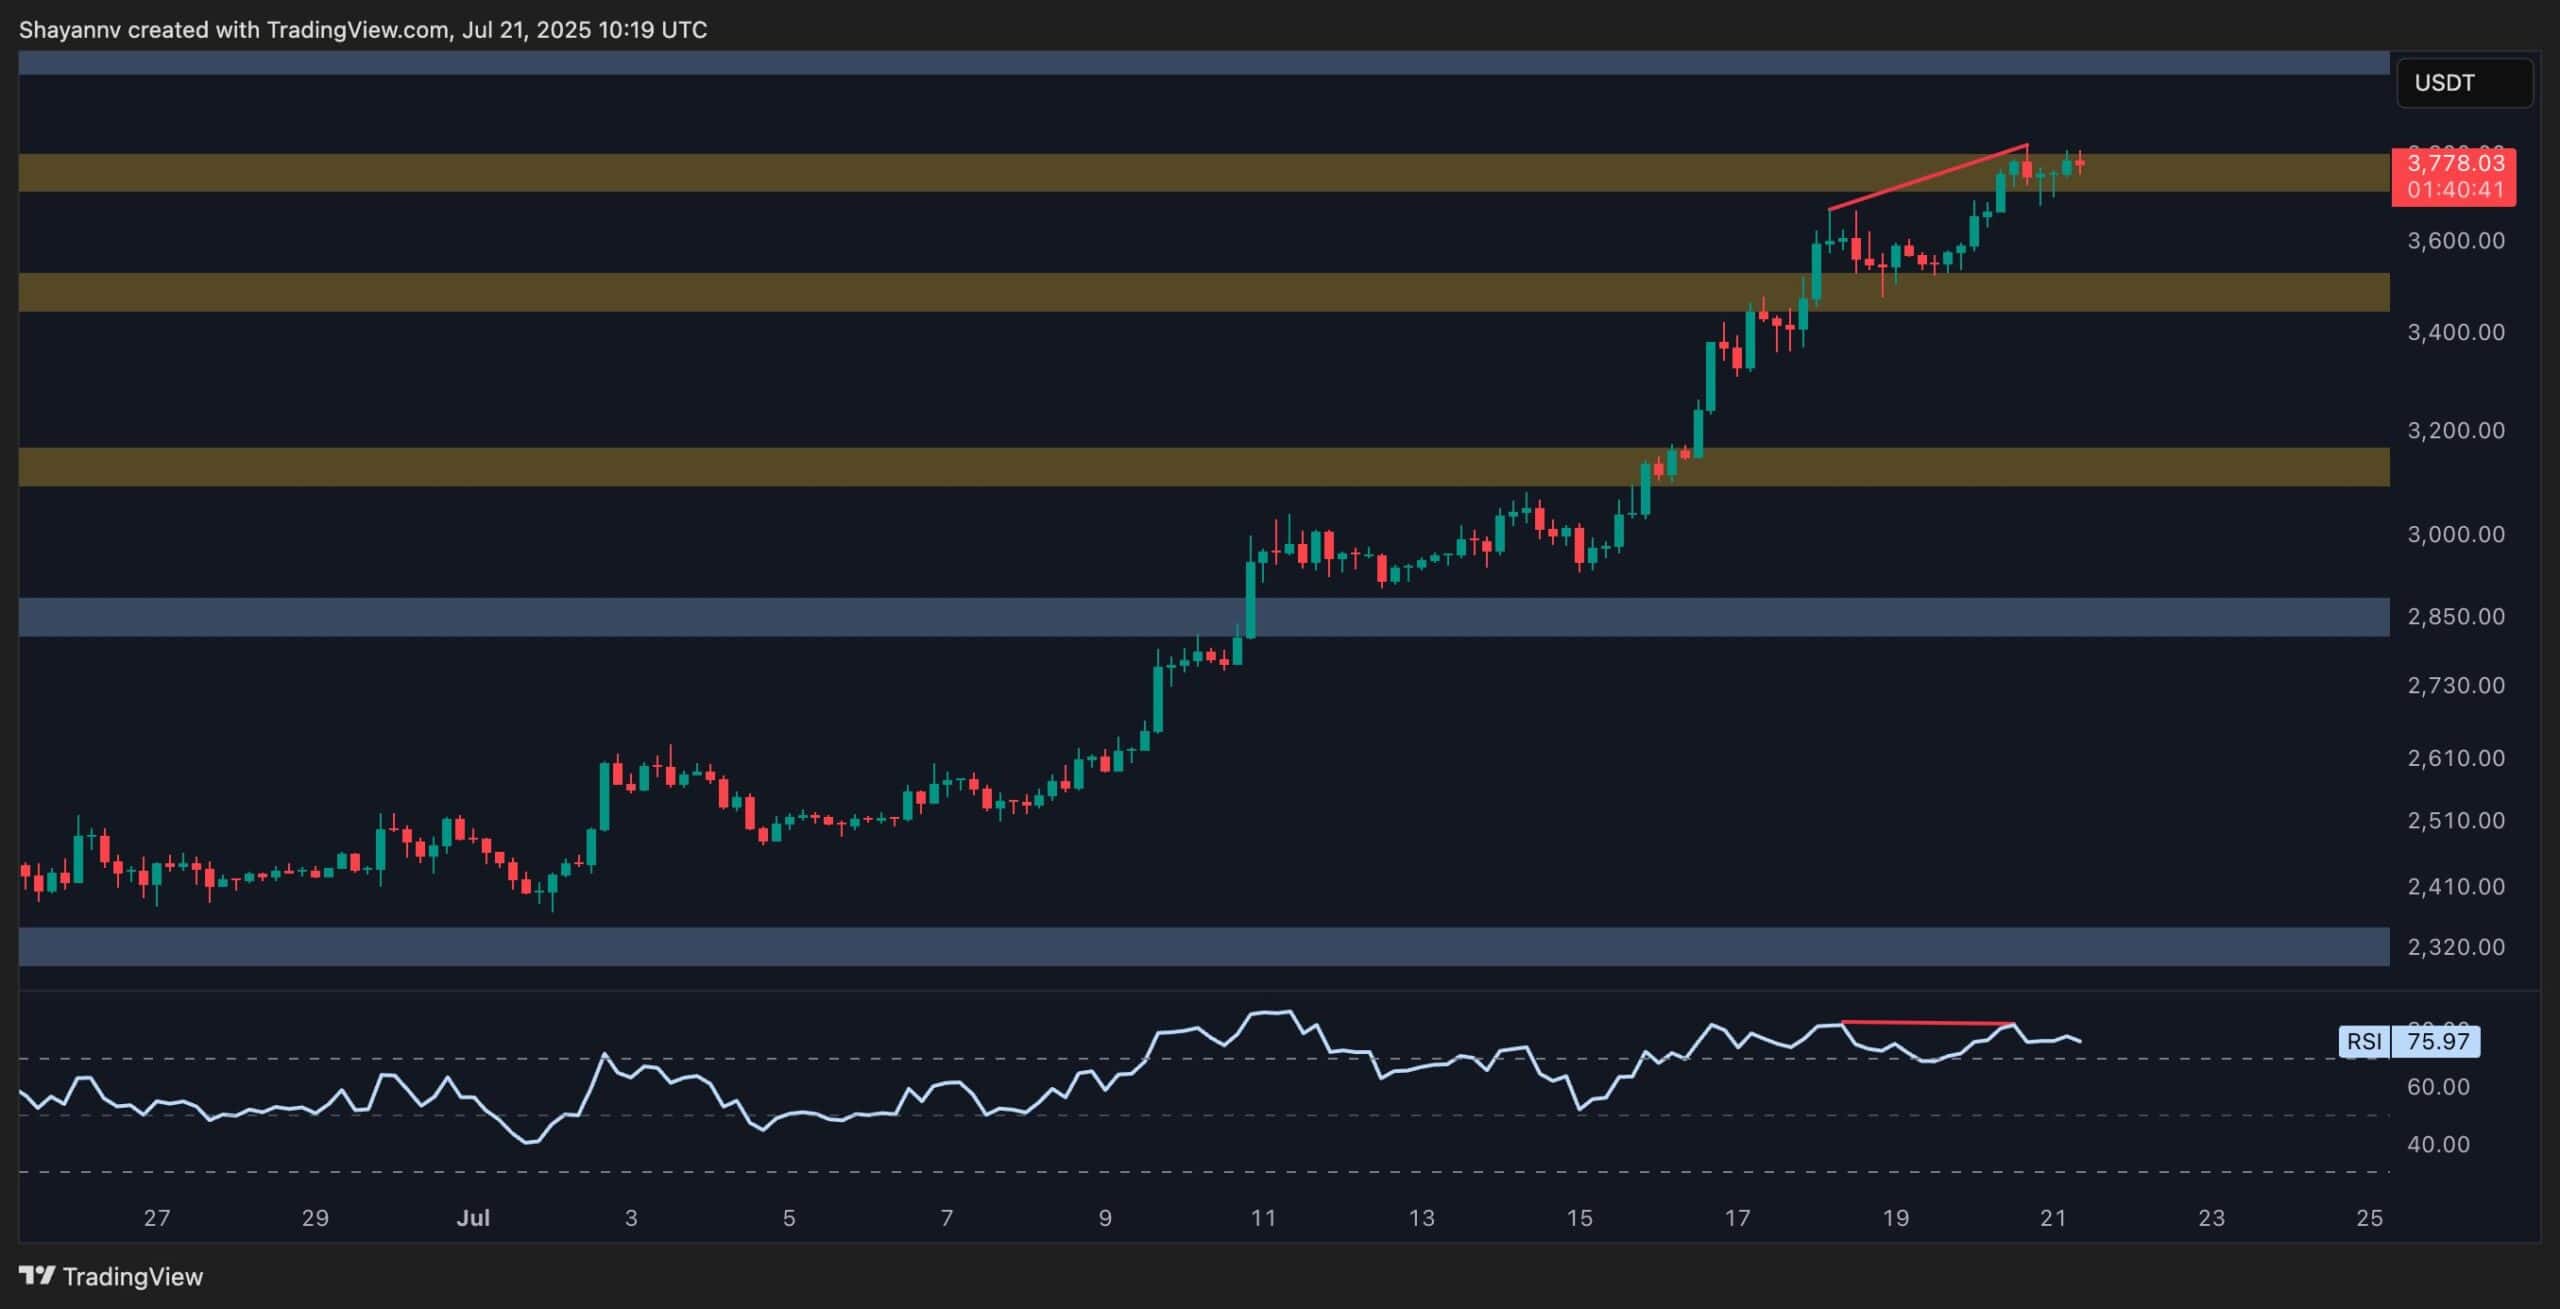
On the 4H timeframe, ETH remains in a strong uptrend, but signs of weakening momentum are emerging. A bearish divergence has formed between the price and RSI: while the price made a new high around $3,780, the RSI failed to follow through.
This could be an early warning of a local top forming. A clean break below $3,500 could trigger a pullback into the $3,200 support zone, which is now structurally significant.
Still, until that occurs, ETH remains bullish on this timeframe. The trend is supported by a healthy structure of higher highs and higher lows, and volume has remained elevated. Traders should keep a close eye on how ETH behaves in the $3,800–$4,100 zone. A breakout here opens the door to a full continuation move, while rejection and bearish follow-through WOULD signal a cooling-off period.
Ethereum Open Interest
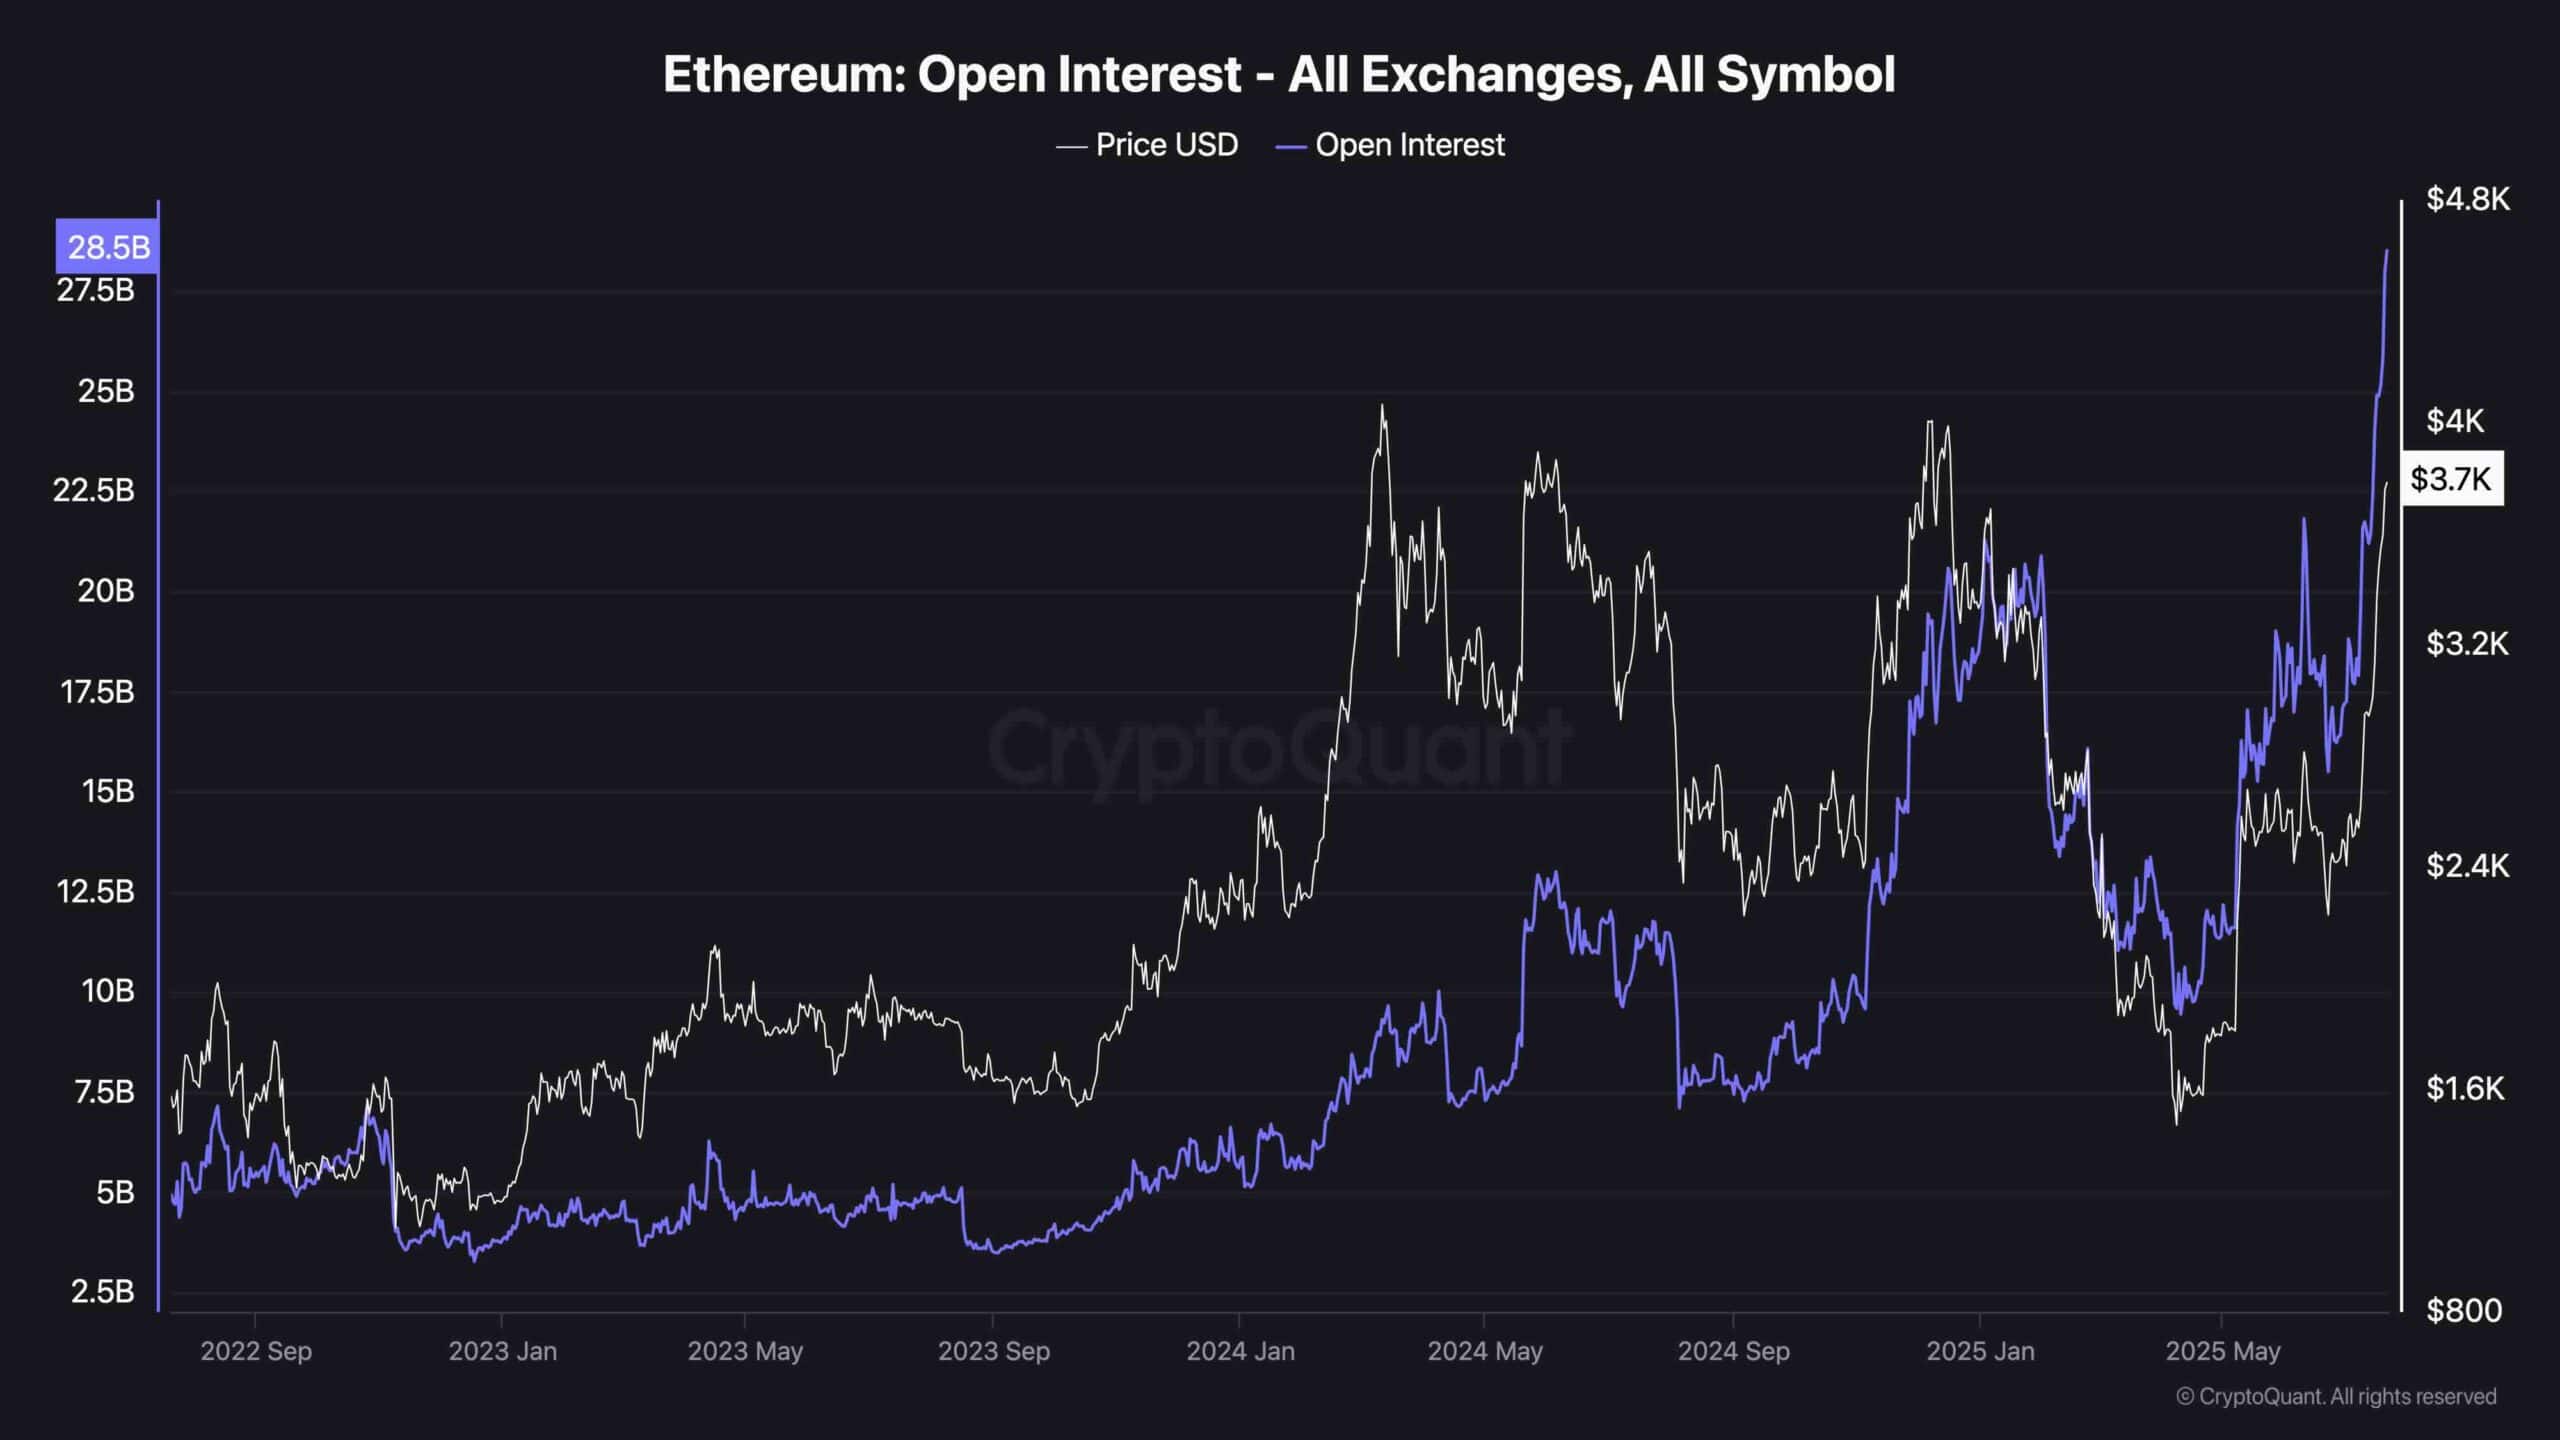
The Open Interest chart paints a clear picture of growing market participation. OI has surged to its highest level over the past few years, now sitting above $28B.
What makes this spike notable is that it comes during a strong price breakout, indicating the rally is being driven not just by spot buying, but also heavily by Leveraged positions. This can be both a bullish and risky sign.
As OI climbs in step with price, it’s critical to monitor for any signs of long liquidations or sudden deleveraging. If ETH stalls or rejects from resistance and open interest remains high, the market could be vulnerable to a sharp flush. For now, however, this data confirms strong bullish sentiment and sustained speculative interest in ETH’s breakout.

Log in to Reply
Log in to comment your thoughtsComments
Related Articles
|Square
Get the BTCC app to start your crypto journey
Get started today Scan to join our 100M+ users