Veteran Trader Peter Brandt Doubles Down on Bitcoin (BTC) – But Here’s the Fine Print

Bitcoin bulls just got heavyweight backing. Legendary trader Peter Brandt—the chart whisperer who called Bitcoin's 2018 bottom—is publicly long BTC again. But before you ape in...
The Catch You Can't Afford to Miss
Brandt's latest analysis suggests a looming volatility bomb. His proprietary models show Bitcoin flirting with a make-or-break logarithmic trendline—the same one that preceded both the 2020 halving rally and 2022's brutal 75% crash.
Wall Street's Worst-Kept Secret
Institutional inflows hit $1.2B last week despite the SEC's best efforts to kill the ETF hype. Meanwhile, BlackRock's IBIT now holds more BTC than MicroStrategy—because nothing says 'adoption' like traditional finance cannibalizing its own crypto critics.
This isn't your 2017 moonboy narrative. Brandt's track record suggests either a generational buying opportunity...or proof that even pros get rekt when leverage meets irrational markets. Place your bets.
Watch Out for This Level
Several hours ago, Bitcoin (BTC) made history by tapping a new all-time high price of over $112,000. One prominent figure in the crypto industry who has commented on the asset’s recent performance is Peter Brandt.
The veteran trader spotted the formation of an expanding inverted triangle on BTC’s price chart, arguing that it has “a higher rate of morphing or mortality” than a pattern like the horizontal pennant.
Nonetheless, Brandt remains long on the asset, setting short-term targets of $120,958 and $134,886. Investors, though, should be cautious because, according to the trader, a decline under $107,000 “would suggest morphology.”
An expanding inverted triangle is a pattern where price fluctuations become wider over time, forming higher highs and lower lows in a megaphone shape. It’s generally considered bearish, as it signals market instability and could result in a breakdown.
On the contrary, a horizontal pennant is a consolidation pattern where the asset’s valuation drifts sideways after a significant move. It’s usually viewed as a bullish signal, assuming it follows an upward trend.
Brandt is known as a proponent of the primary cryptocurrency. Just a few weeks ago, he recommended that people make monthly investments and allocate 80% of the capital to SPY (the ETF that tracks the S&P 500 Index) and the remaining 20% to BTC.
Other Forecasts
The X user CRYPTOWZRD is also optimistic that BTC could post additional gains in the NEAR future, envisioning a rally to $132,500 based on the potential formation of an inverse head-and-shoulders pattern. KALEO was even more optimistic, predicting a price explosion to $500,000.
#Bitcoin / $BTC
$500K IS A MAGNET pic.twitter.com/ni2oFVs9hf
— K A L E O (@CryptoKaleo) July 9, 2025
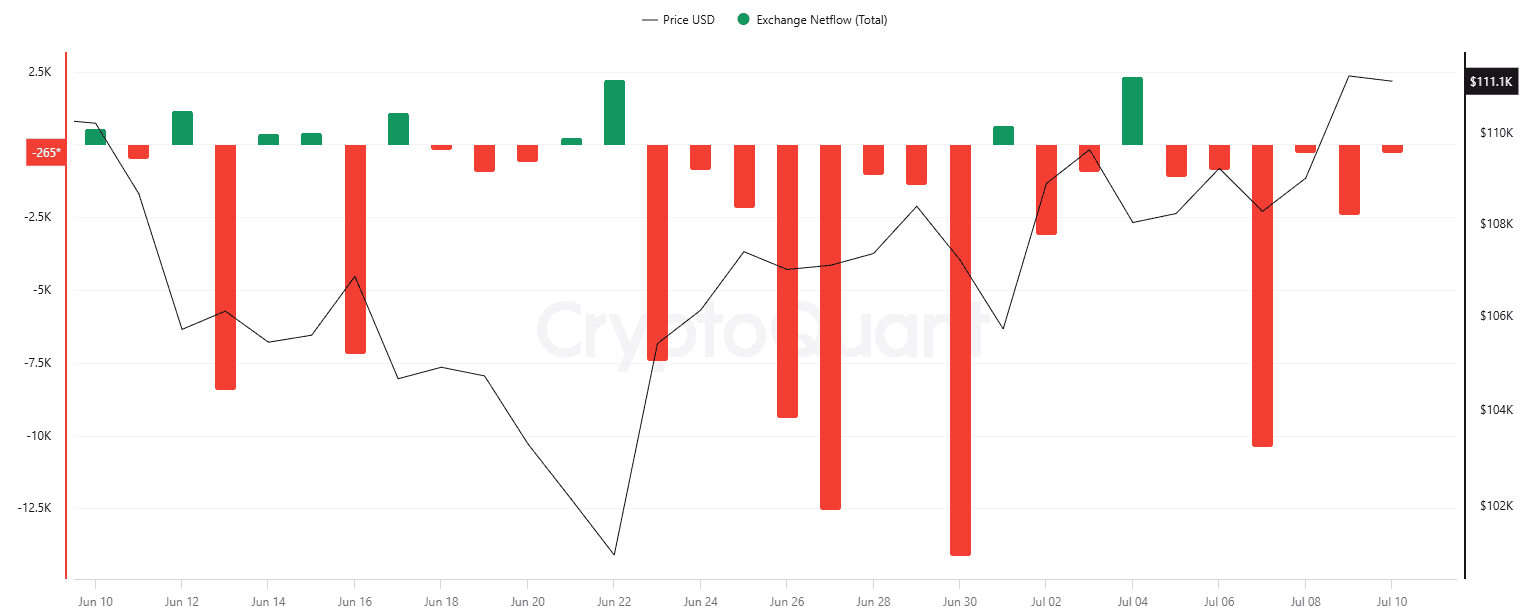
Some indicators support the bullish theories. BTC’s exchange netflow has been predominantly negative over the last month, signaling a shift from centralized exchanges to self-custody methods, which reduces the immediate selling pressure.
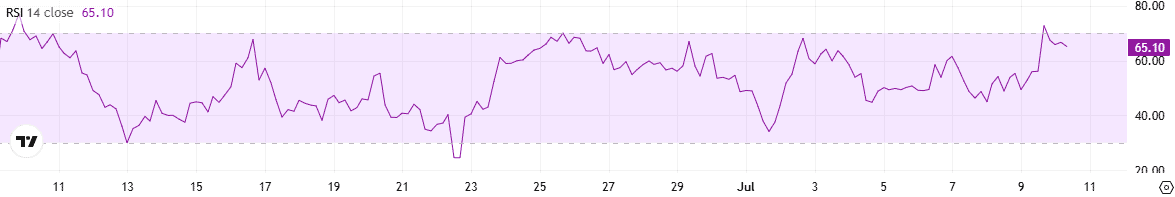
On the other hand, the asset’s Relative Strength Index (RSI) is quite close to the bearish zone of 70. Such readings show that the price has increased too rapidly over a short period of time and might be due for a short-term pullback.