Ethereum Breaks $2.5K: Is This the Start of a Major Rally?

Ethereum just smashed through the $2.5K barrier—now traders are eyeing the next target. Here’s what the charts say.
The Bull Case: Momentum Builds
ETH’s surge past $2.5K wasn’t a fluke. Liquidation clusters cleared, derivatives heat up, and spot buying accelerates. The crowd’s leaning greedy—but is it justified?
Watch These Levels
Hold above $2.4K, and the path to $3K looks plausible. Break below? A retest of $2.2K support looms. Classic crypto: high stakes, higher volatility.
The Elephant in the Room
Institutional money’s playing nice—for now. Just don’t mention the last time Wall Street ‘adopted’ crypto and left retail holding the bag. *Cough* 2021 *cough*.
Technical Analysis
By ShayanMarkets
The Daily Chart
After a period of consolidation between the 100-day and 200-day moving averages, ETH successfully broke above the 200-day MA at $2.5K, followed by a pullback. While this MOVE is typically viewed as a bullish signal, ETH has failed to demonstrate strong follow-through, indicating weak market participation and insufficient bullish momentum.
As a result, the likelihood of continued sideways consolidation has increased. Currently, the price remains trapped between the 200-day MA and the critical $2.8K resistance level, with a decisive breakout in either direction needed to establish the next major trend.
The 4-Hour Chart
On the lower timeframe, Ethereum’s recent rally was halted at a key bearish order block between $2,625 and $2,670, a zone that has consistently attracted selling pressure. The rejection has led to a retracement toward the $2.5K support level — a historically significant zone where buyers have previously stepped in.
As anticipated, ETH found temporary support here and attempted a minor rebound. However, the current lack of trading volume and diminished bullish momentum suggests the potential for another rejection at the overhead resistance. Until a breakout above $2,670 or below $2.5K occurs, ethereum is expected to remain range-bound.
Sentiment Analysis
By ShayanMarkets
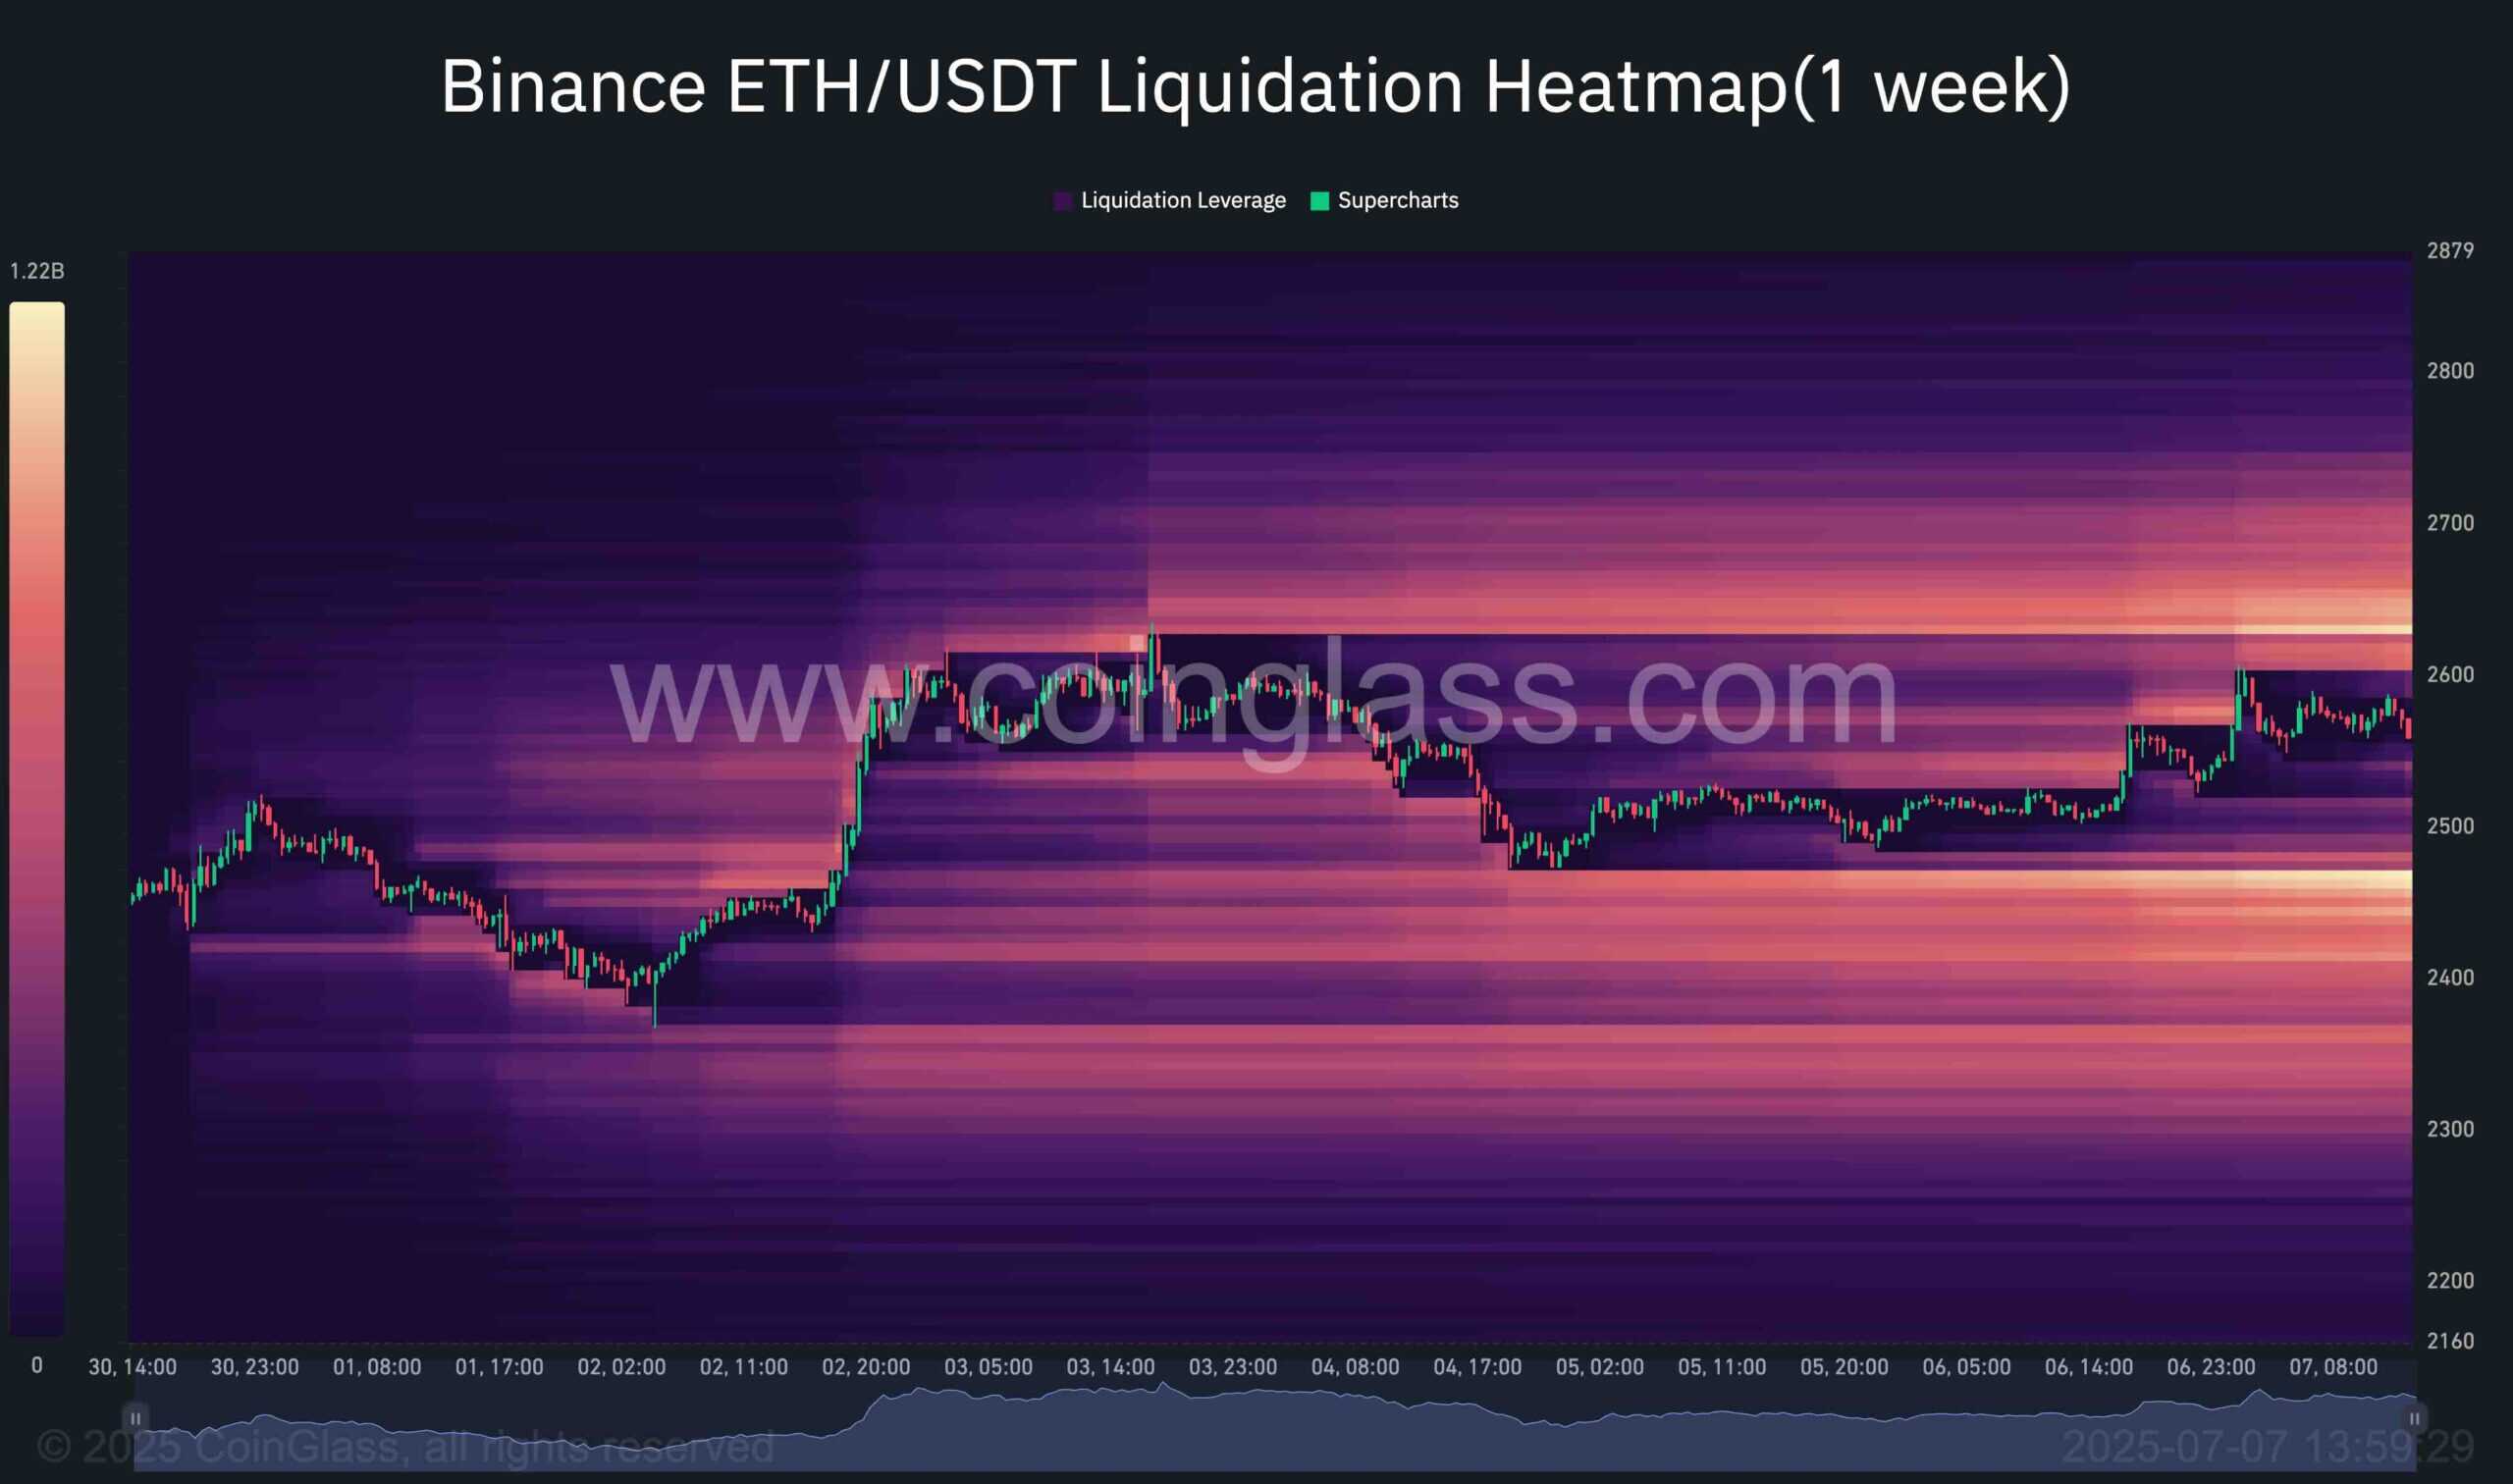
This chart presents the Binance Liquidation Heatmap, highlighting zones where significant liquidation events are likely to occur. These areas often act as liquidity magnets, attracting price action due to the concentration of Leveraged positions. Large market participants, commonly referred to as whales, tend to exploit these zones to enter or exit positions efficiently.
Currently, a prominent cluster of liquidation levels is situated just above the $2.6K mark, suggesting a strong likelihood that Ethereum’s price could gravitate toward this region. If reached, it may trigger a short-squeeze, fueling further upward momentum and potentially propelling ETH toward new local highs.
Conversely, another substantial liquidity pool resides below the $2.5K level, implying the possibility of a downward move to tap into this zone. As a result, Ethereum remains confined within a tight range between these liquidity clusters, awaiting a decisive breakout to determine the next directional move.