Ethereum’s Make-or-Break Moment: Will ETH Soar to $2.7K or Crash to $2.2K This Week?

Ethereum teeters on the edge—bulls and bears are locked in a high-stakes duel. This week's price action could send ETH rocketing to $2.7K or tumbling down to $2.2K. Here's what you need to know.
Technical Breakdown: The Charts Don't Lie
Key support and resistance levels are flashing warning signs—or opportunities, depending on which side of the trade you're on. Forget the 'fundamentals'—right now, it's all about momentum and market psychology.
The Institutional Wildcard
Whales are circling, and retail traders are either about to feast or become dinner. As usual, Wall Street's algo-traders will probably front-run everyone anyway.
Bottom Line: Buckle Up
ETH's next move will either trigger euphoric FOMO or a cascade of liquidations. Either way, someone's getting rich—and it's probably not you.
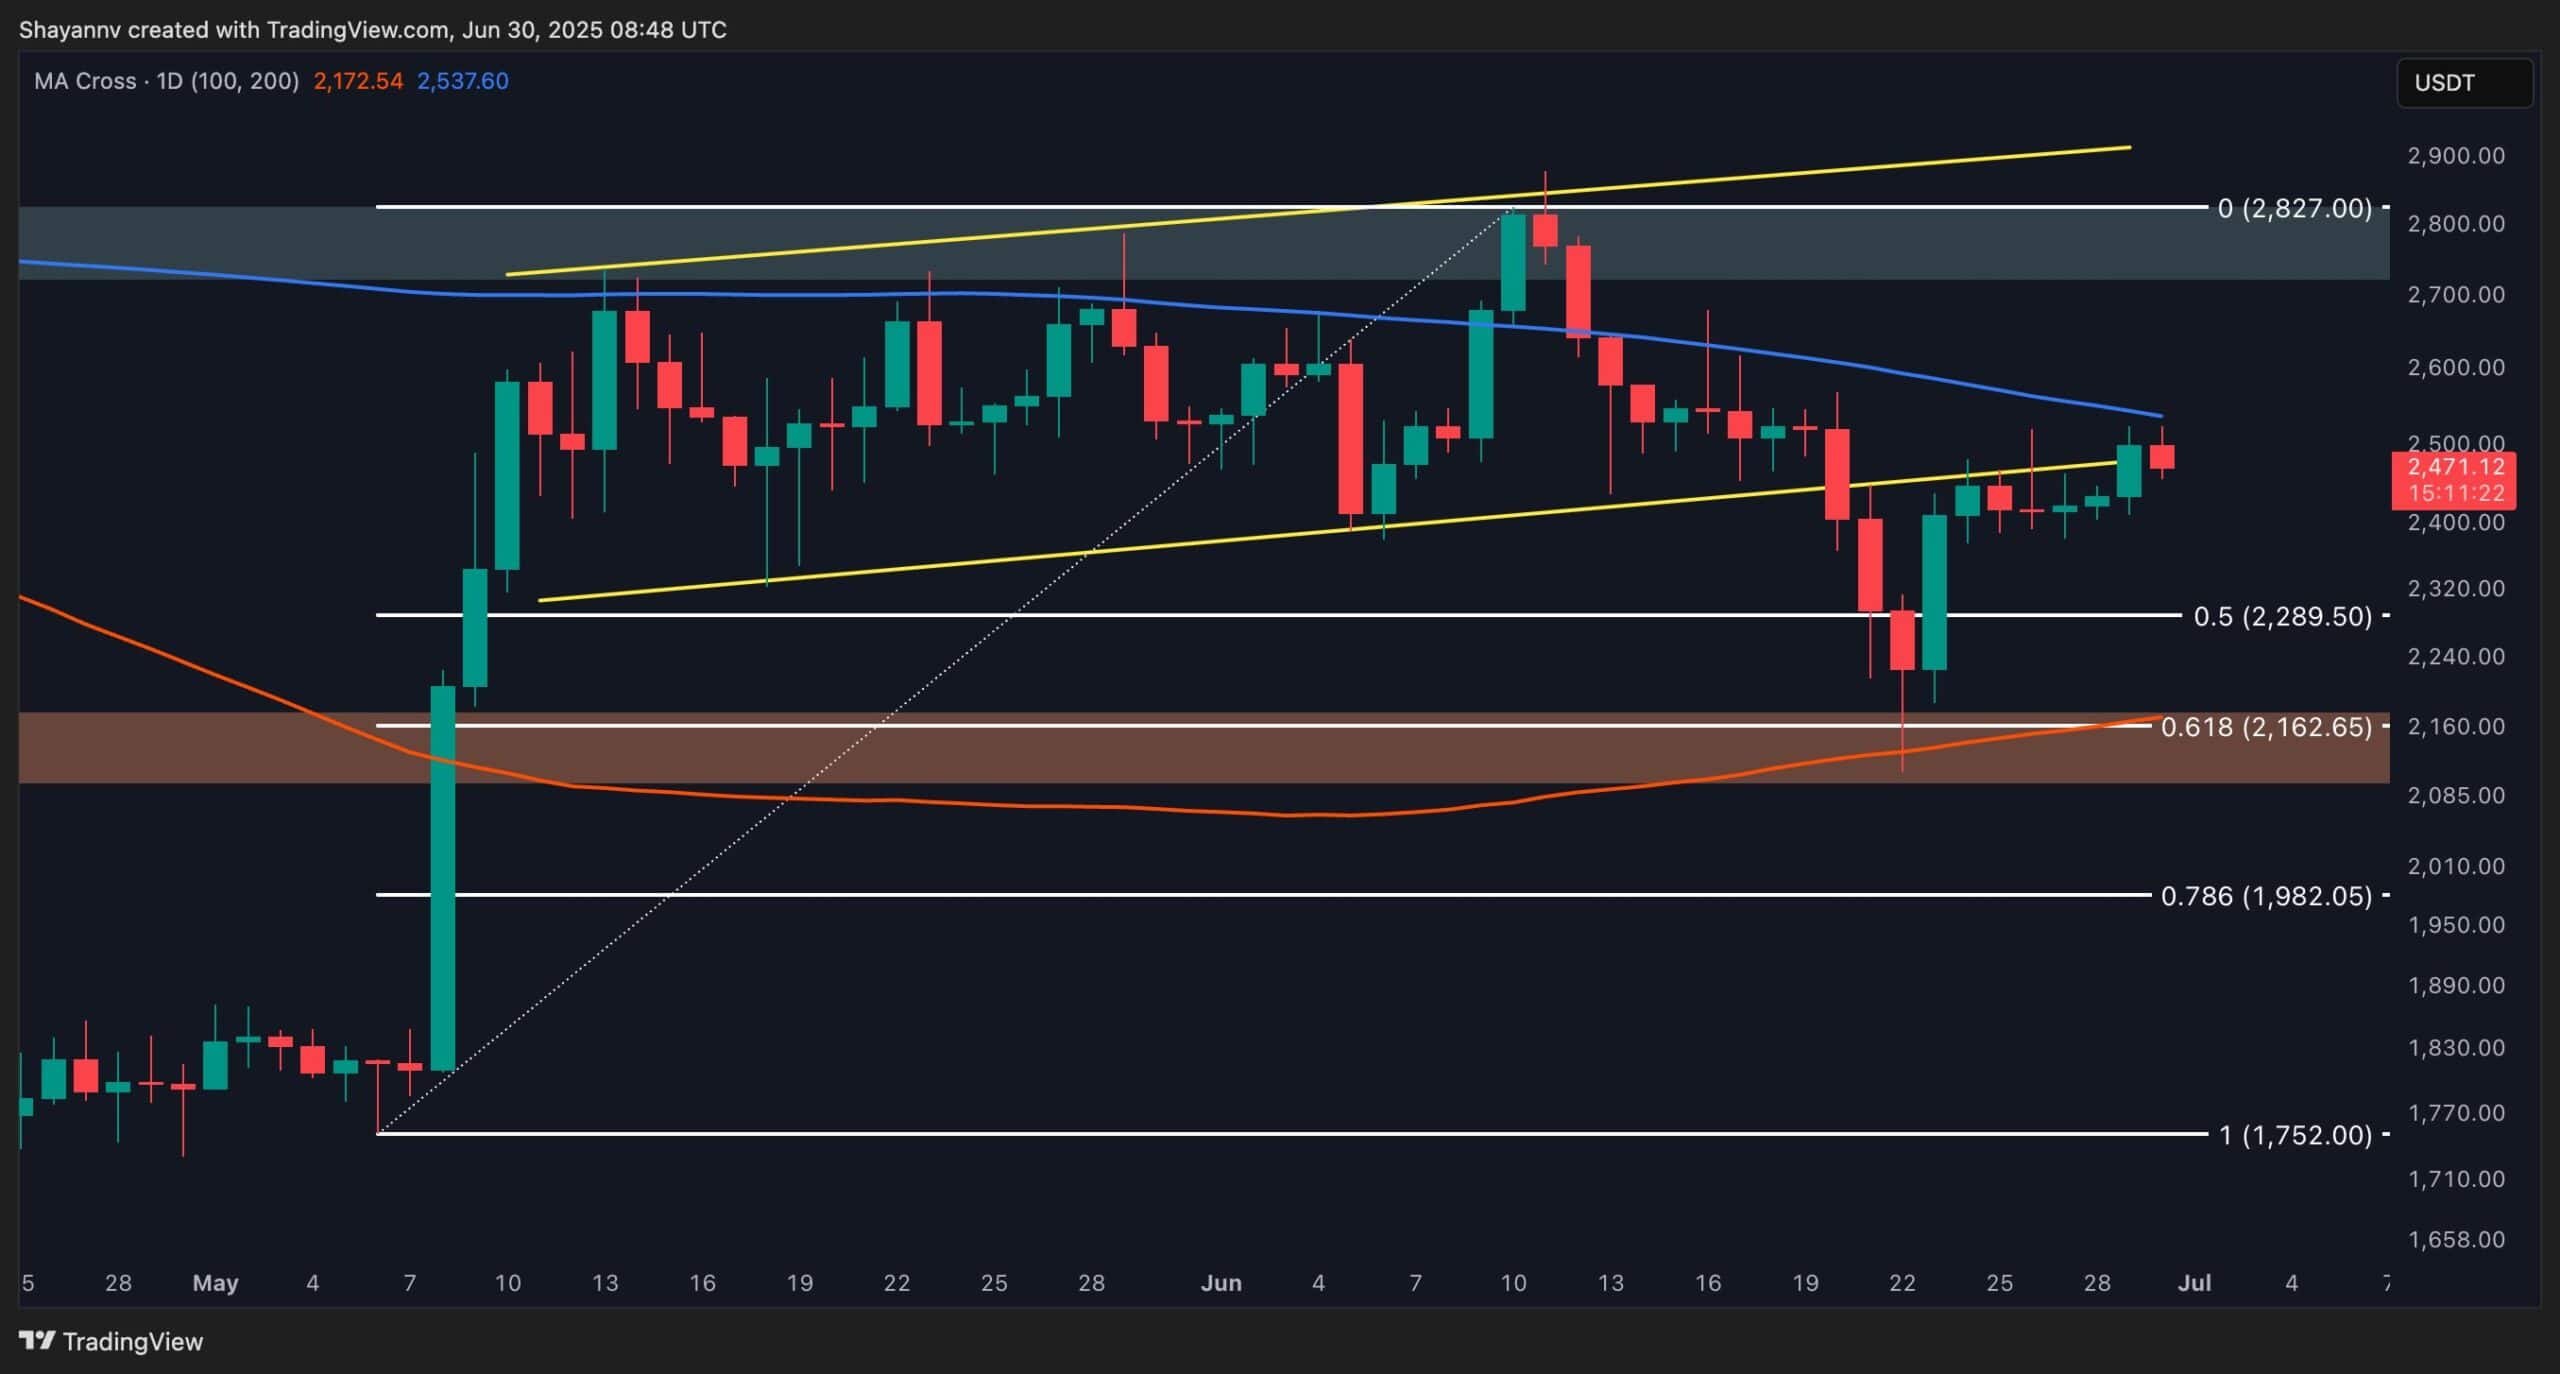
The Daily Chart
ETH is currently exhibiting muted trading activity and compressed volatility just below a critical resistance zone at $2,500.
After rebounding strongly from the 0.5–0.618 Fibonacci support band between $2.2K and $2.1K, the price encountered a confluence of technical barriers, namely, the 200-day moving average and the underside of the previously broken wedge pattern.
This confluence has stalled upward momentum, suggesting that market participants are in equilibrium, with neither buyers nor sellers in control.
As a result, ETH is at a critical juncture: if selling pressure intensifies, a rejection from this level could trigger a more significant correction. Conversely, should bulls force a breakout above this resistance, a short squeeze may follow, propelling the price toward the $2.7K mark.
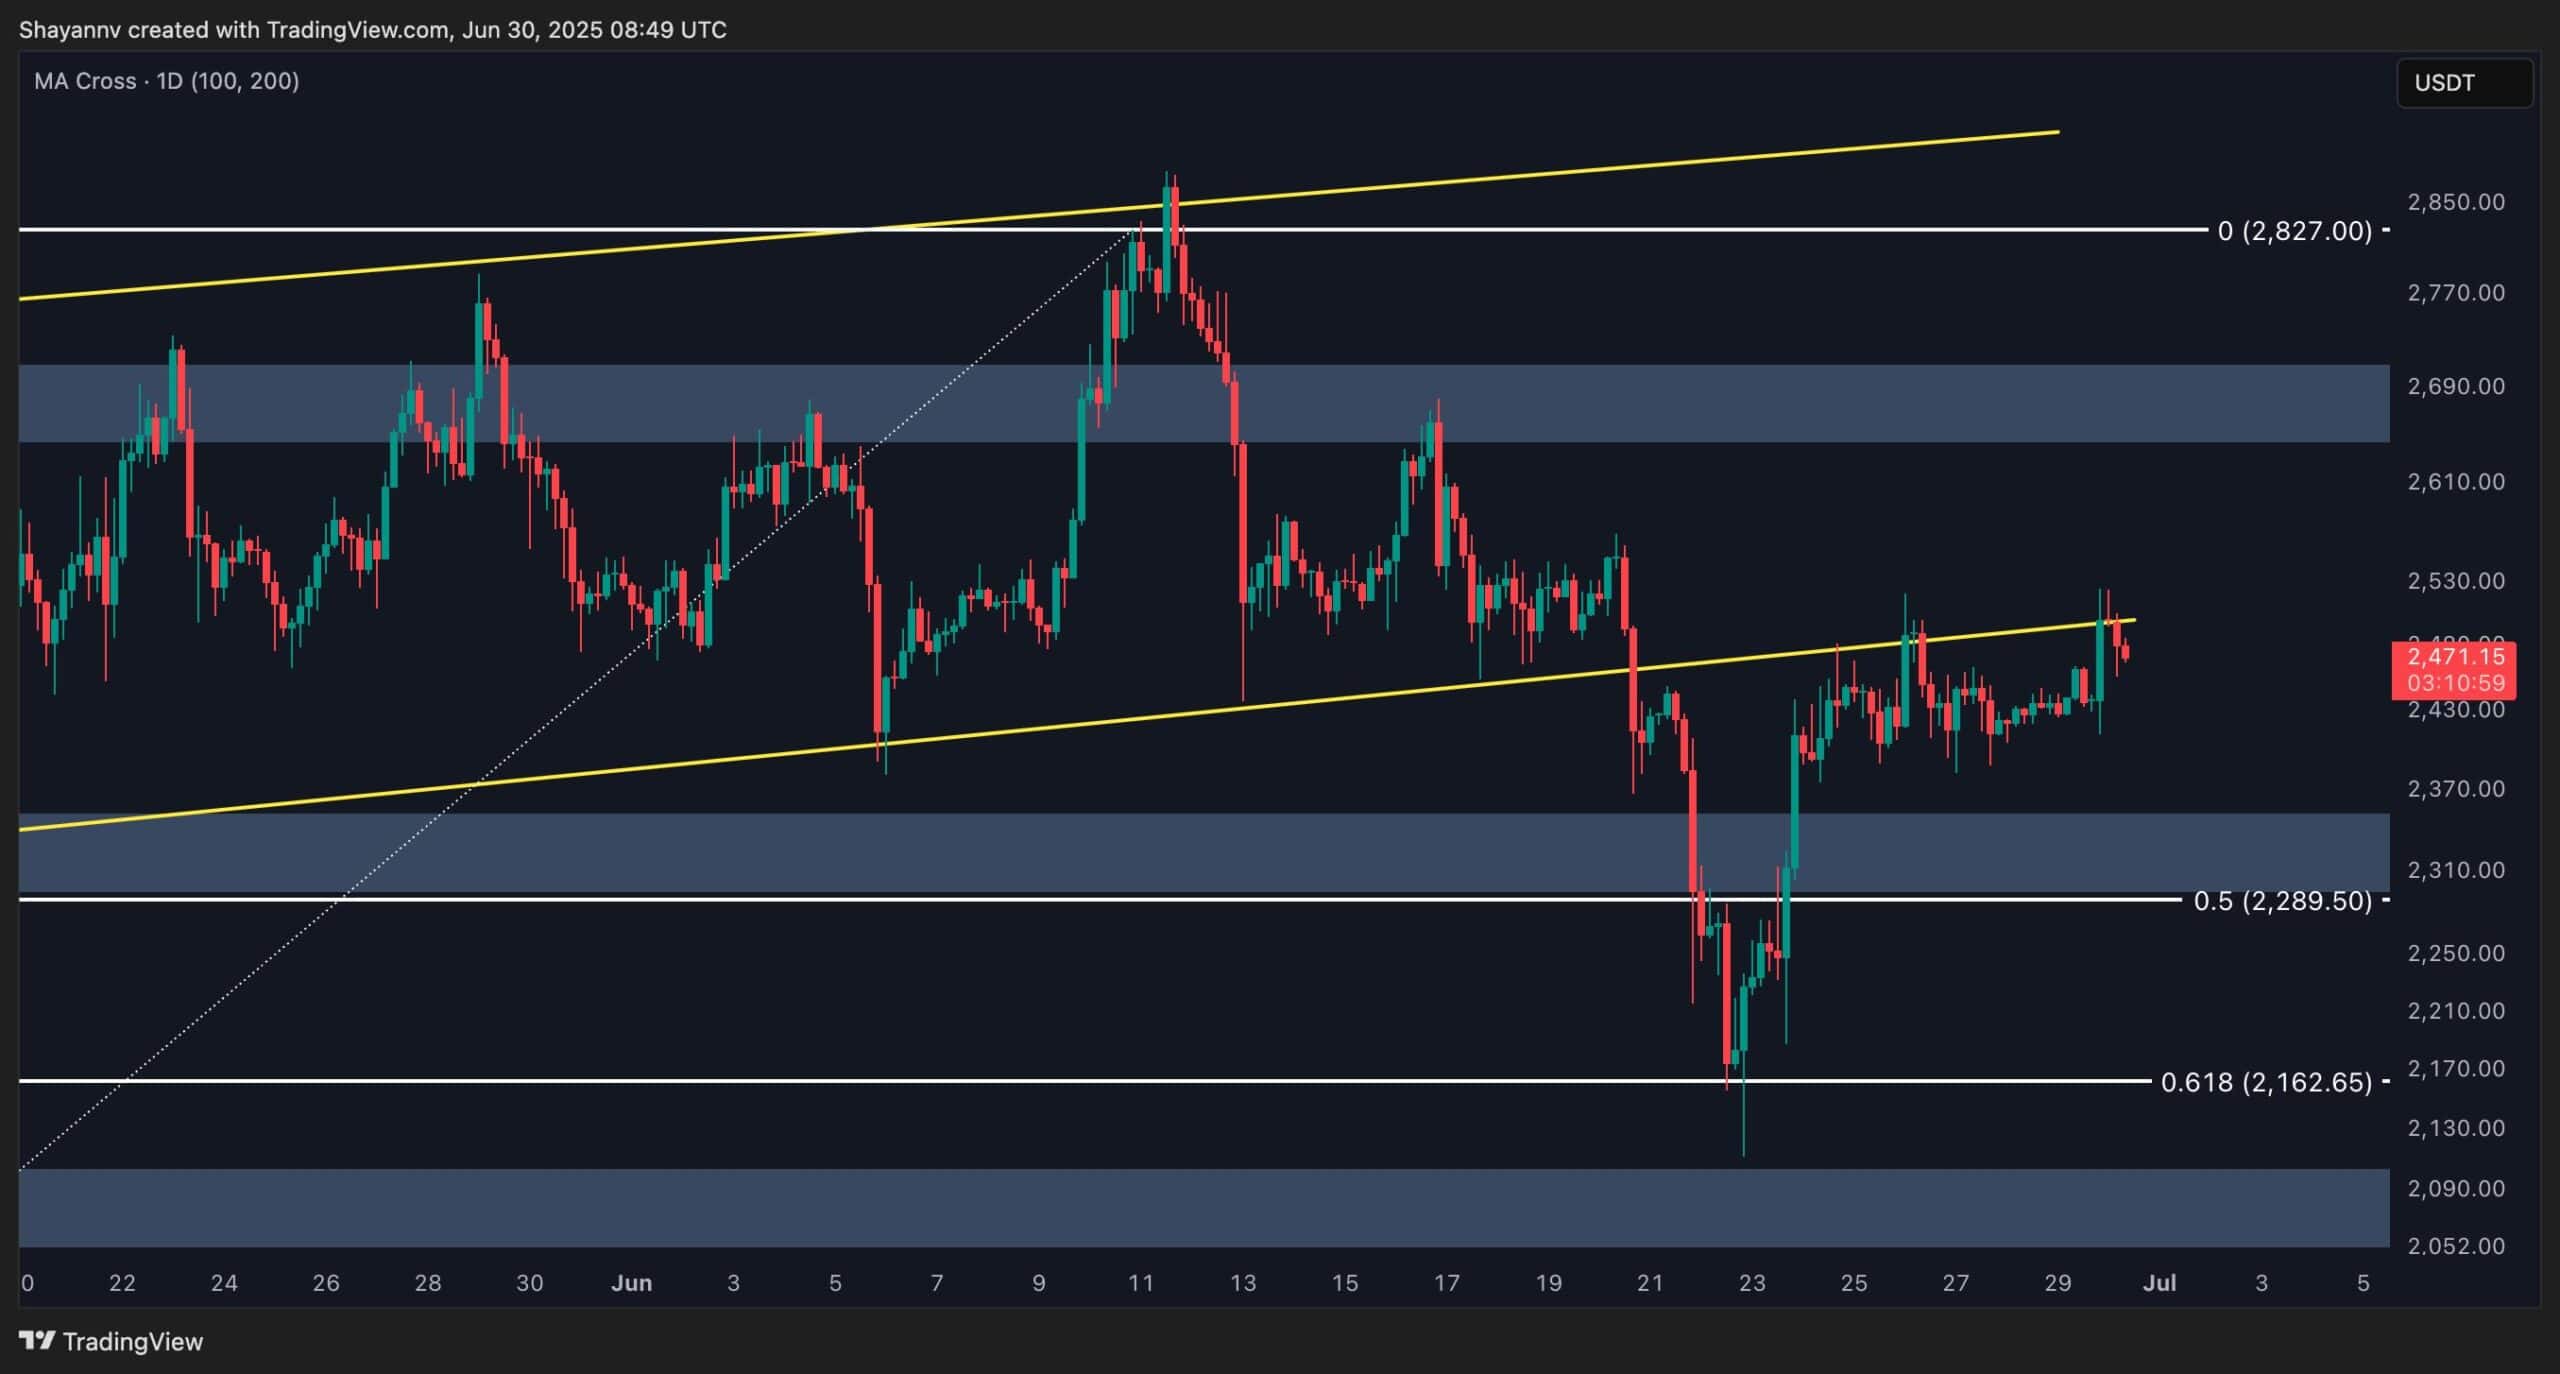
The 4-Hour Chart
On the lower timeframe, ETH remains trapped in a narrow consolidation band, with minimal volatility and directionless movement. The fair value gap between $2.3K and $2.39K has been acting as support, while the resistance aligns with the broken wedge’s lower boundary.
This technical deadlock could soon be resolved, as a breakout from either side is likely to trigger a decisive move.
Notably, the early formation of a head and shoulders pattern at this inflection zone suggests increased probability of a bearish breakdown. Should this pattern confirm, a decline toward the $2K psychological support becomes increasingly plausible.
By Shayan
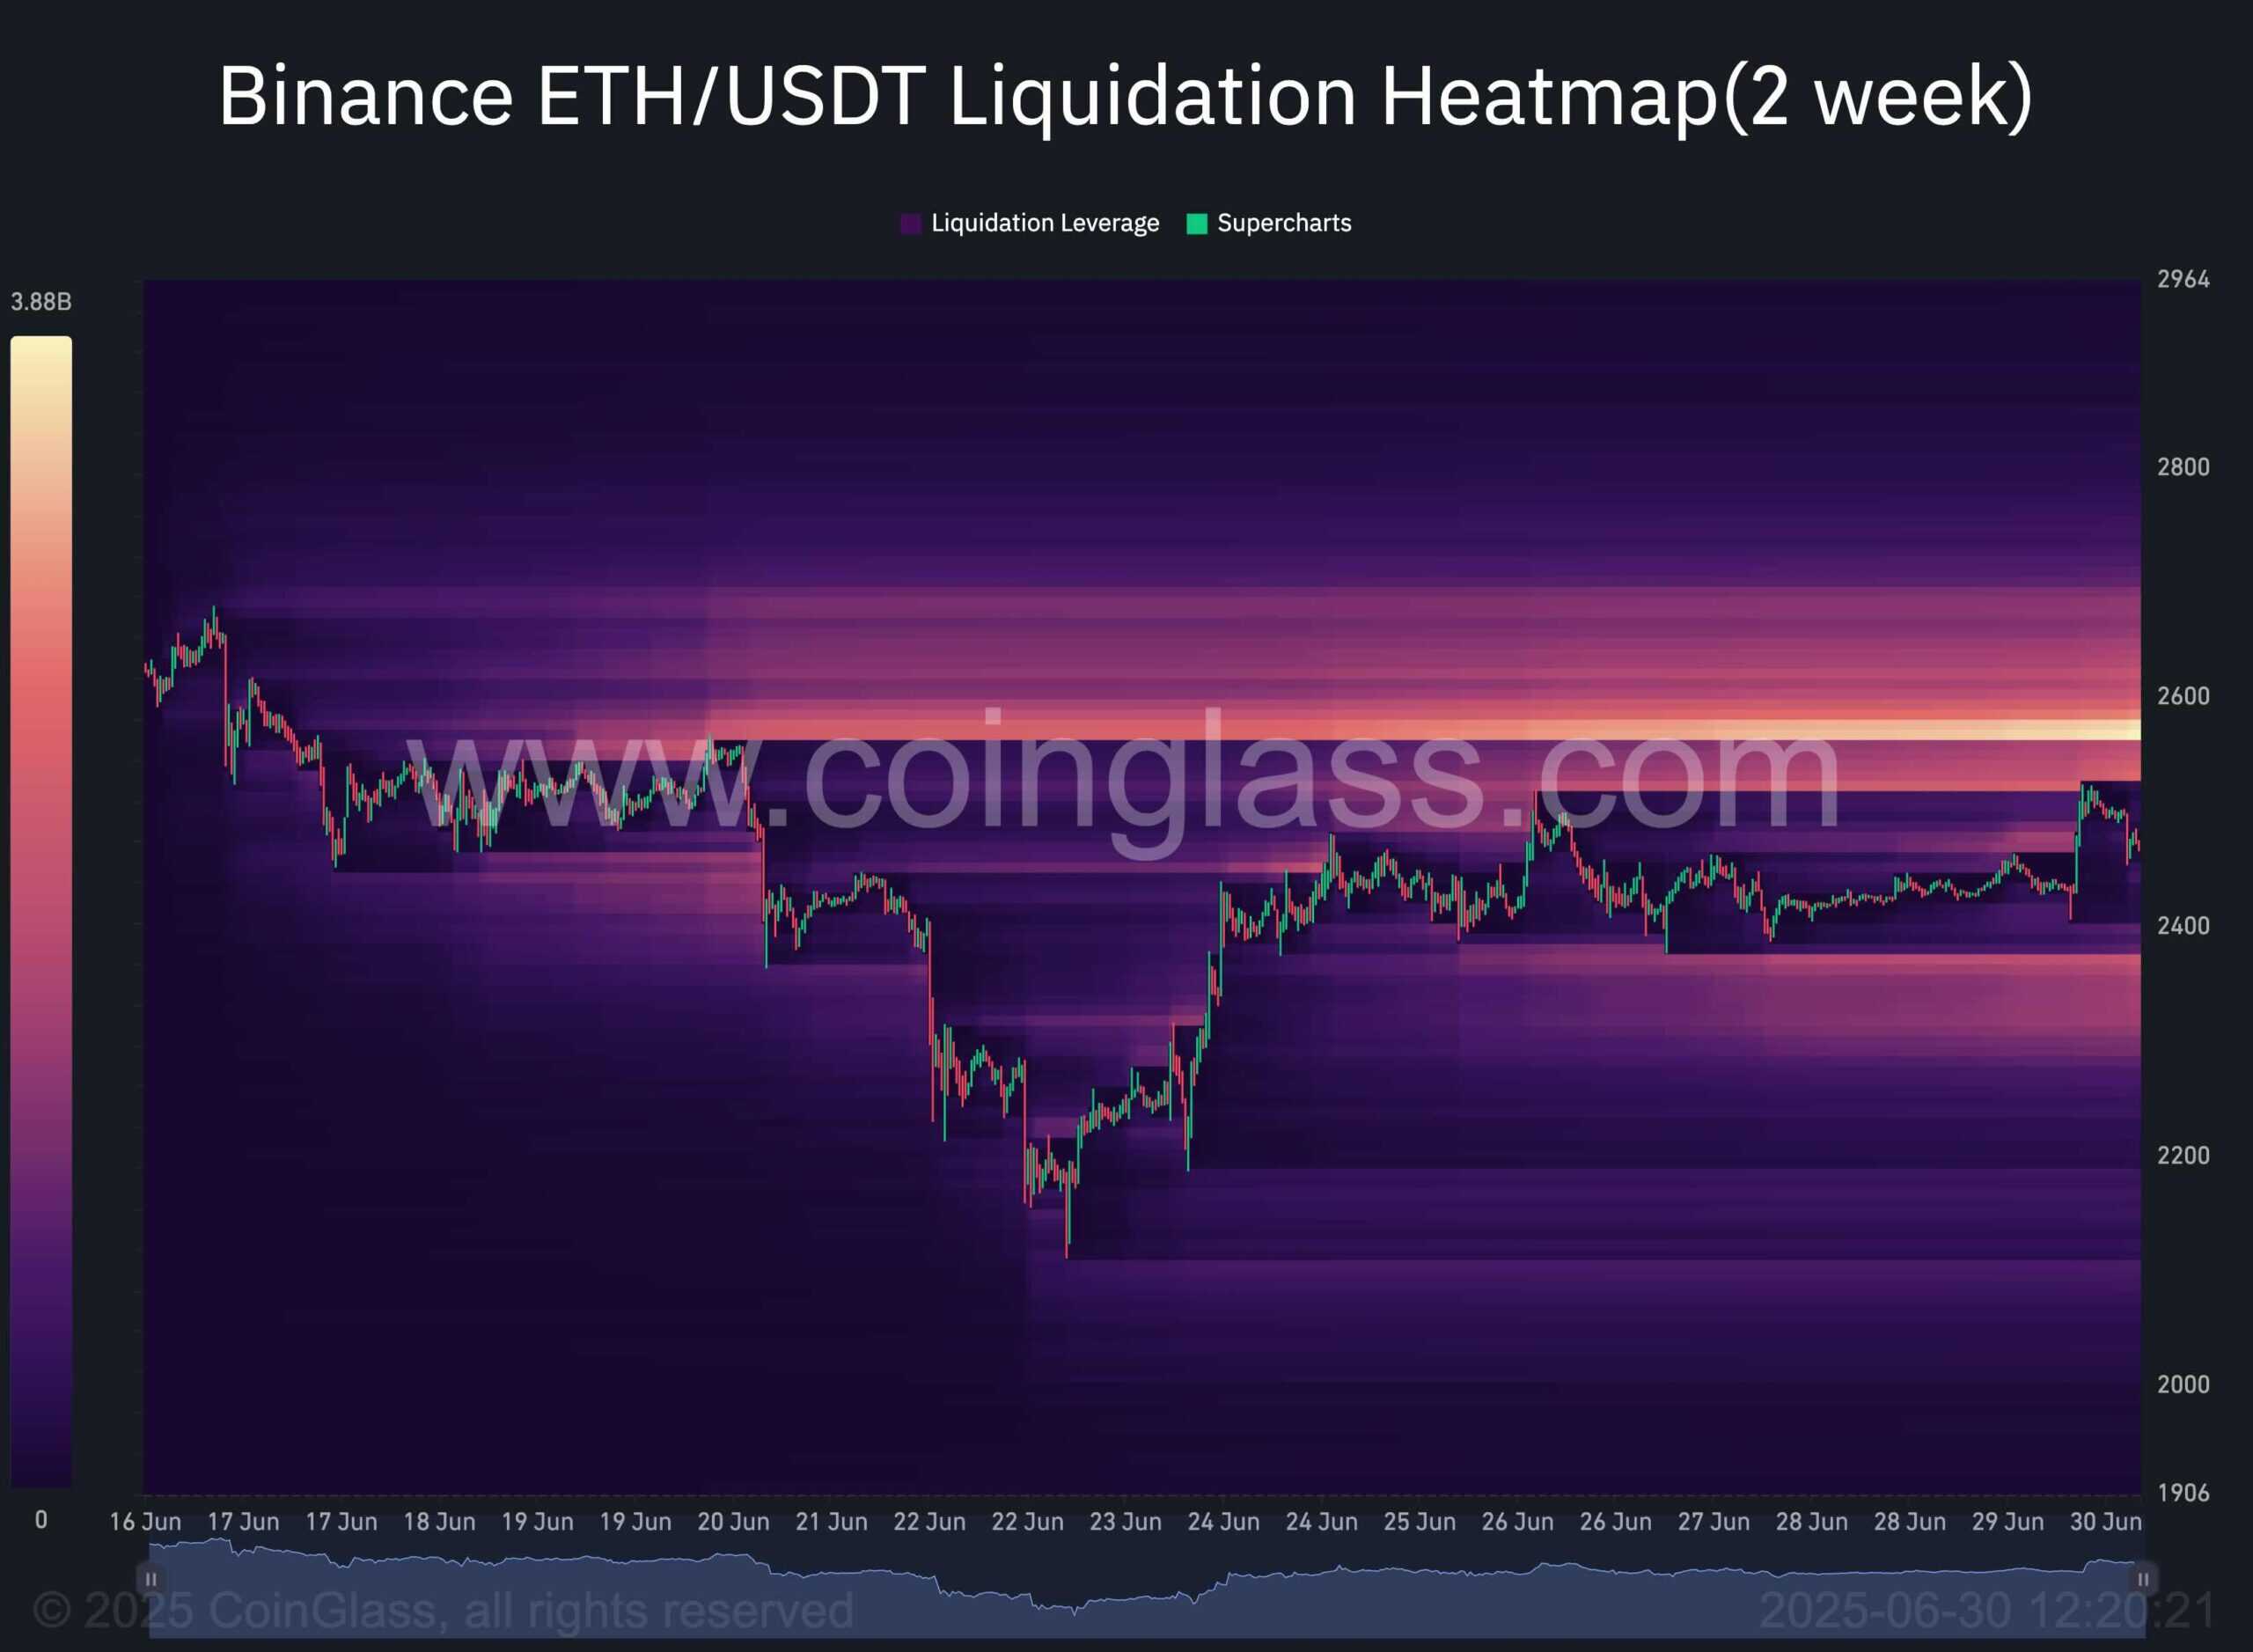
This chart illustrates the Binance Liquidation Heatmap, highlighting areas where significant liquidation events are likely to occur.
High concentrations of potential liquidation levels often act as magnets for price, as large traders, commonly referred to as “whales”, capitalize on these liquidity zones to execute orders efficiently. Once these orders are filled, price direction can swiftly reverse.
Currently, a substantial liquidity cluster is present just above the critical $2.5K level, suggesting the possibility of a price move toward this zone, which could potentially trigger a short squeeze. However, this also underscores persistent selling pressure NEAR the current price, emphasizing the presence of active sellers. As such, the $2.5K level remains a key resistance, and the next decisive move, whether a breakout or rejection, will likely shape Ethereum’s short-term trajectory.