Pi Network Price Forecast: Will PI Coin Surge or Stumble This Week?

Pi Network’s price action heats up as traders brace for volatility. Here’s what the charts scream ahead.
Bullish or Bust? The PI Coin Dilemma
PI’s recent moves defy lazy predictions—no sugarcoating here. The token dances between resistance levels like a crypto ballerina, teasing breakout potential. But watch those volume spikes; thin liquidity turns rallies into trapdoors.
Whispers from the mining crowd suggest Mainnet hype could fuel a 20% pump. Yet veteran traders eye that descending wedge—classic make-or-break territory. Either PI slingshots past $32.50 or gets dumped back to support.
Regulatory ghosts linger too. SEC chair’s latest ‘meme token’ jab? Probably not targeting Pi… but in crypto, uncertainty cuts deeper than FUD.
Bottom line: This week separates Pi’s believers from bagholders. Just remember—in decentralized dreams, even ‘community-driven’ projects answer to whales first.
PI Price Predictions to Watch This Week
1. Sellers Dominate
Even if buyers attempted to stop the ongoing downtrend with a strong relief bounce to 67 cents, sellers immediately returned and reversed the recent gains in full. This is a bearish signal and the price is now found around $0.50. If this key psychological level is lost as well, then Pi could make new lows.

2. Downtrend Continues
The strongest support on the chart is found at 40 cents. This level is quite some distance away from the current level, but if buyers fail to hold the price above $0.50, then a test of this support becomes likely. In the past, this price point was tested on June 13th when the conflict in the Middle East escalated.

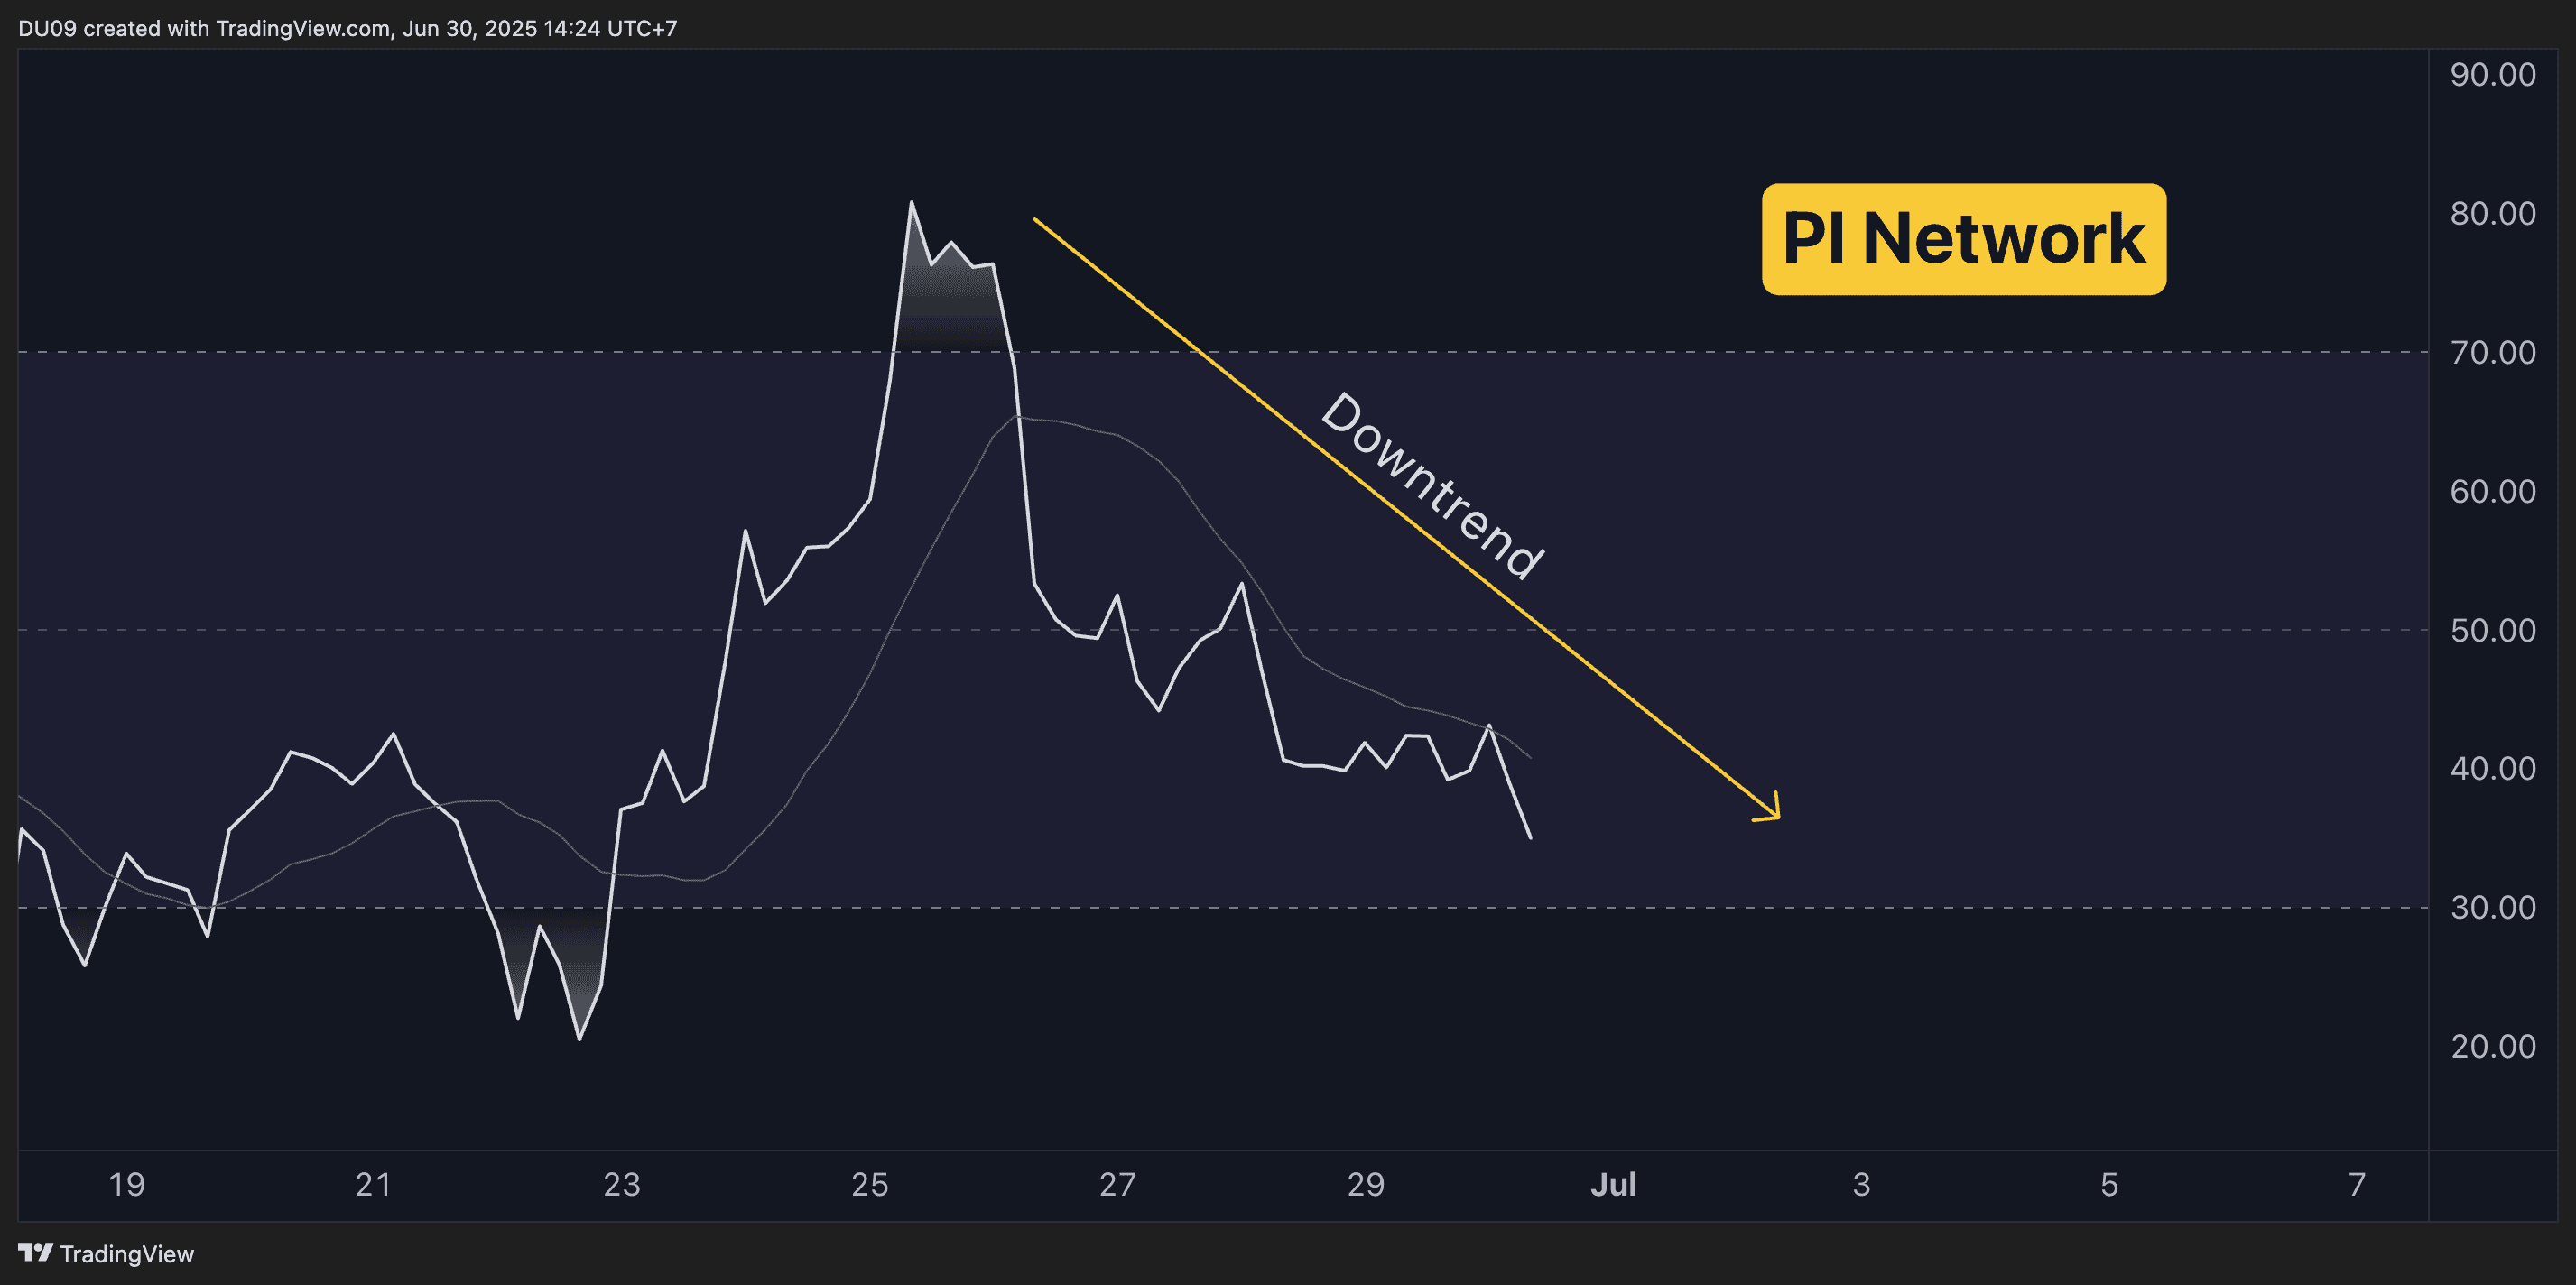
3. RSI Lower Lows
Another way to look at the current downtrend is to use the 4H RSI. This shows a clear downtrend with lower lows and lower highs. There are no signs of a possible reversal yet which suggested the price is likely to continue down in the coming days. Buyers may not return until the RSI reaches the oversold area under 30 points.