Ethereum at a Crossroads: Will ETH Surge to $2.8K or Plummet to $2K?

Ethereum's price action is tightening like a coiled spring—but which way will it snap?
Bullish or bearish? The $2.8K vs. $2K showdown
Traders are glued to their screens as ETH teeters between breakout and breakdown. The $2.8K target whispers of renewed institutional interest, while the $2K danger zone reeks of overleveraged degens getting liquidated (again).
Technical indicators paint a conflicting picture: RSI flirts with neutrality while volume patterns hint at accumulation. Meanwhile, Bitcoin's sideways action leaves altcoins to fight for scraps.
One thing's certain—when ETH moves, it'll move fast. Just don't blame us when your 'sure thing' trade gets wrecked by a whale with better algo.
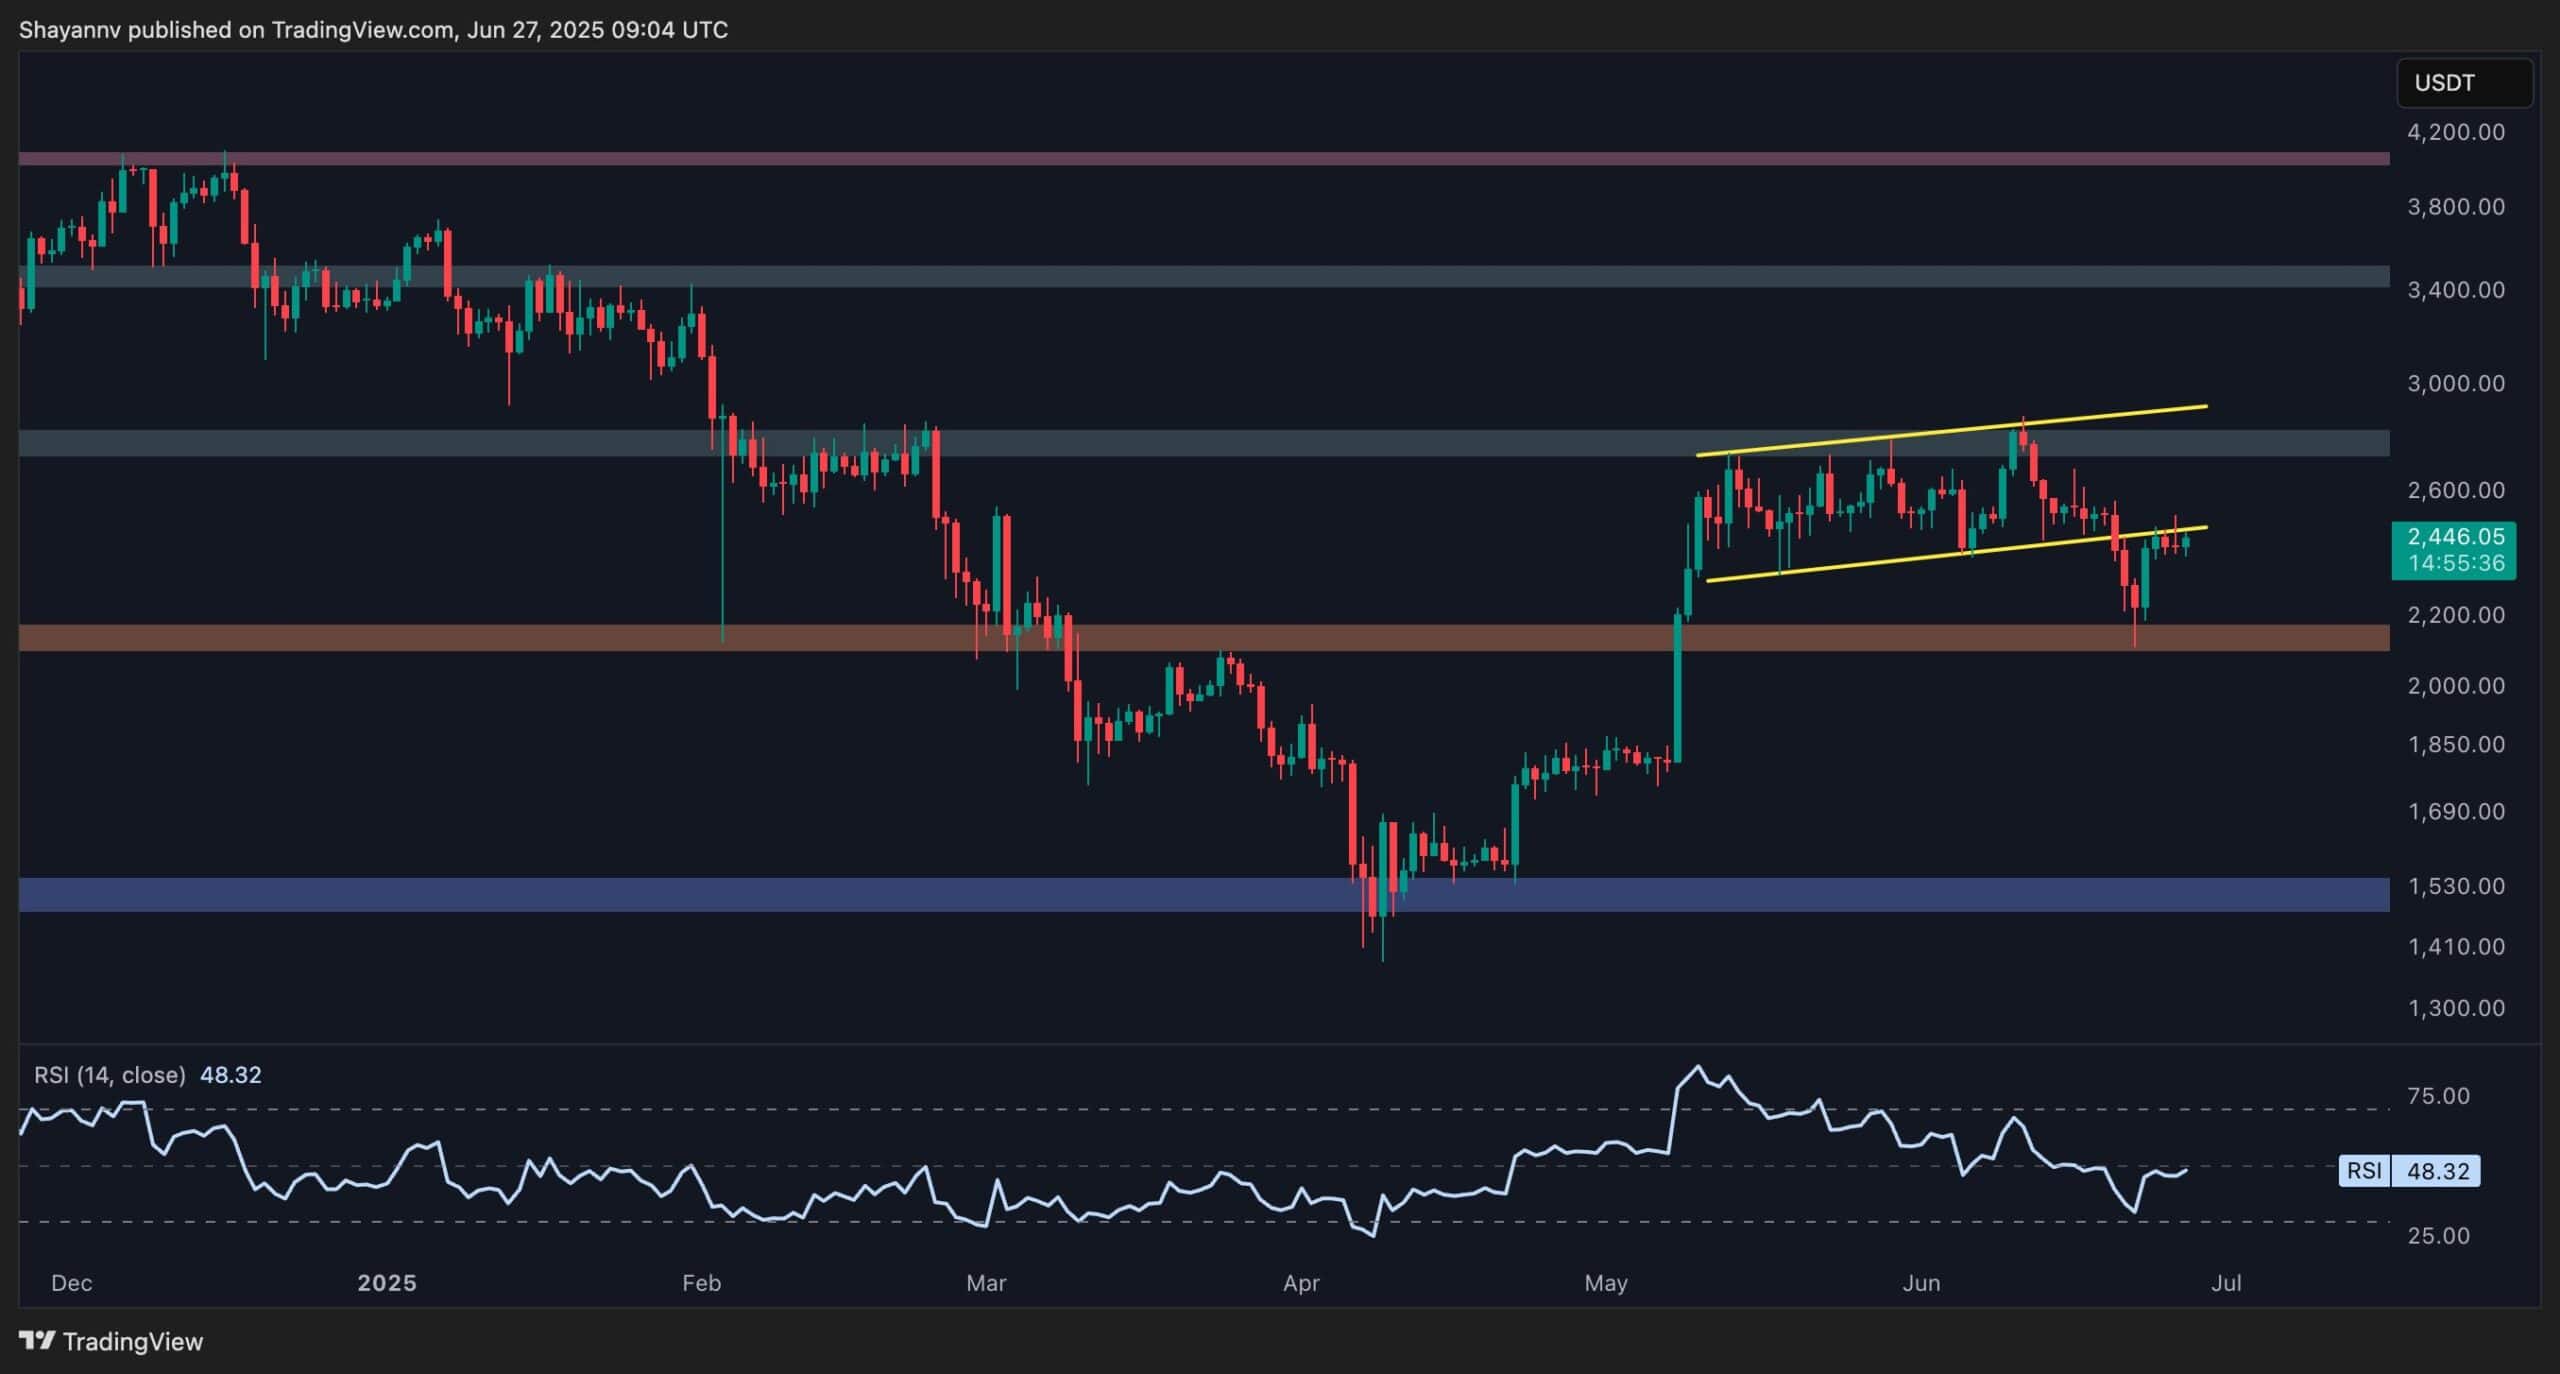
The Daily Chart
ETH recently broke down from its ascending flag pattern, triggering a corrective phase. After finding strong support around the $2.1K level, the cryptocurrency bounced and retraced toward the broken trendline at $2.4K, where it now appears to be encountering resistance.
Despite the rebound, the lack of significant volatility and waning momentum around this key level suggests that buyers are exhausted. If the selling pressure intensifies here, ETH is likely to complete its pullback and extend its correction.
In this case, the $2K mark is emerging as the next key defensive zone where the bulls may attempt to regain control.
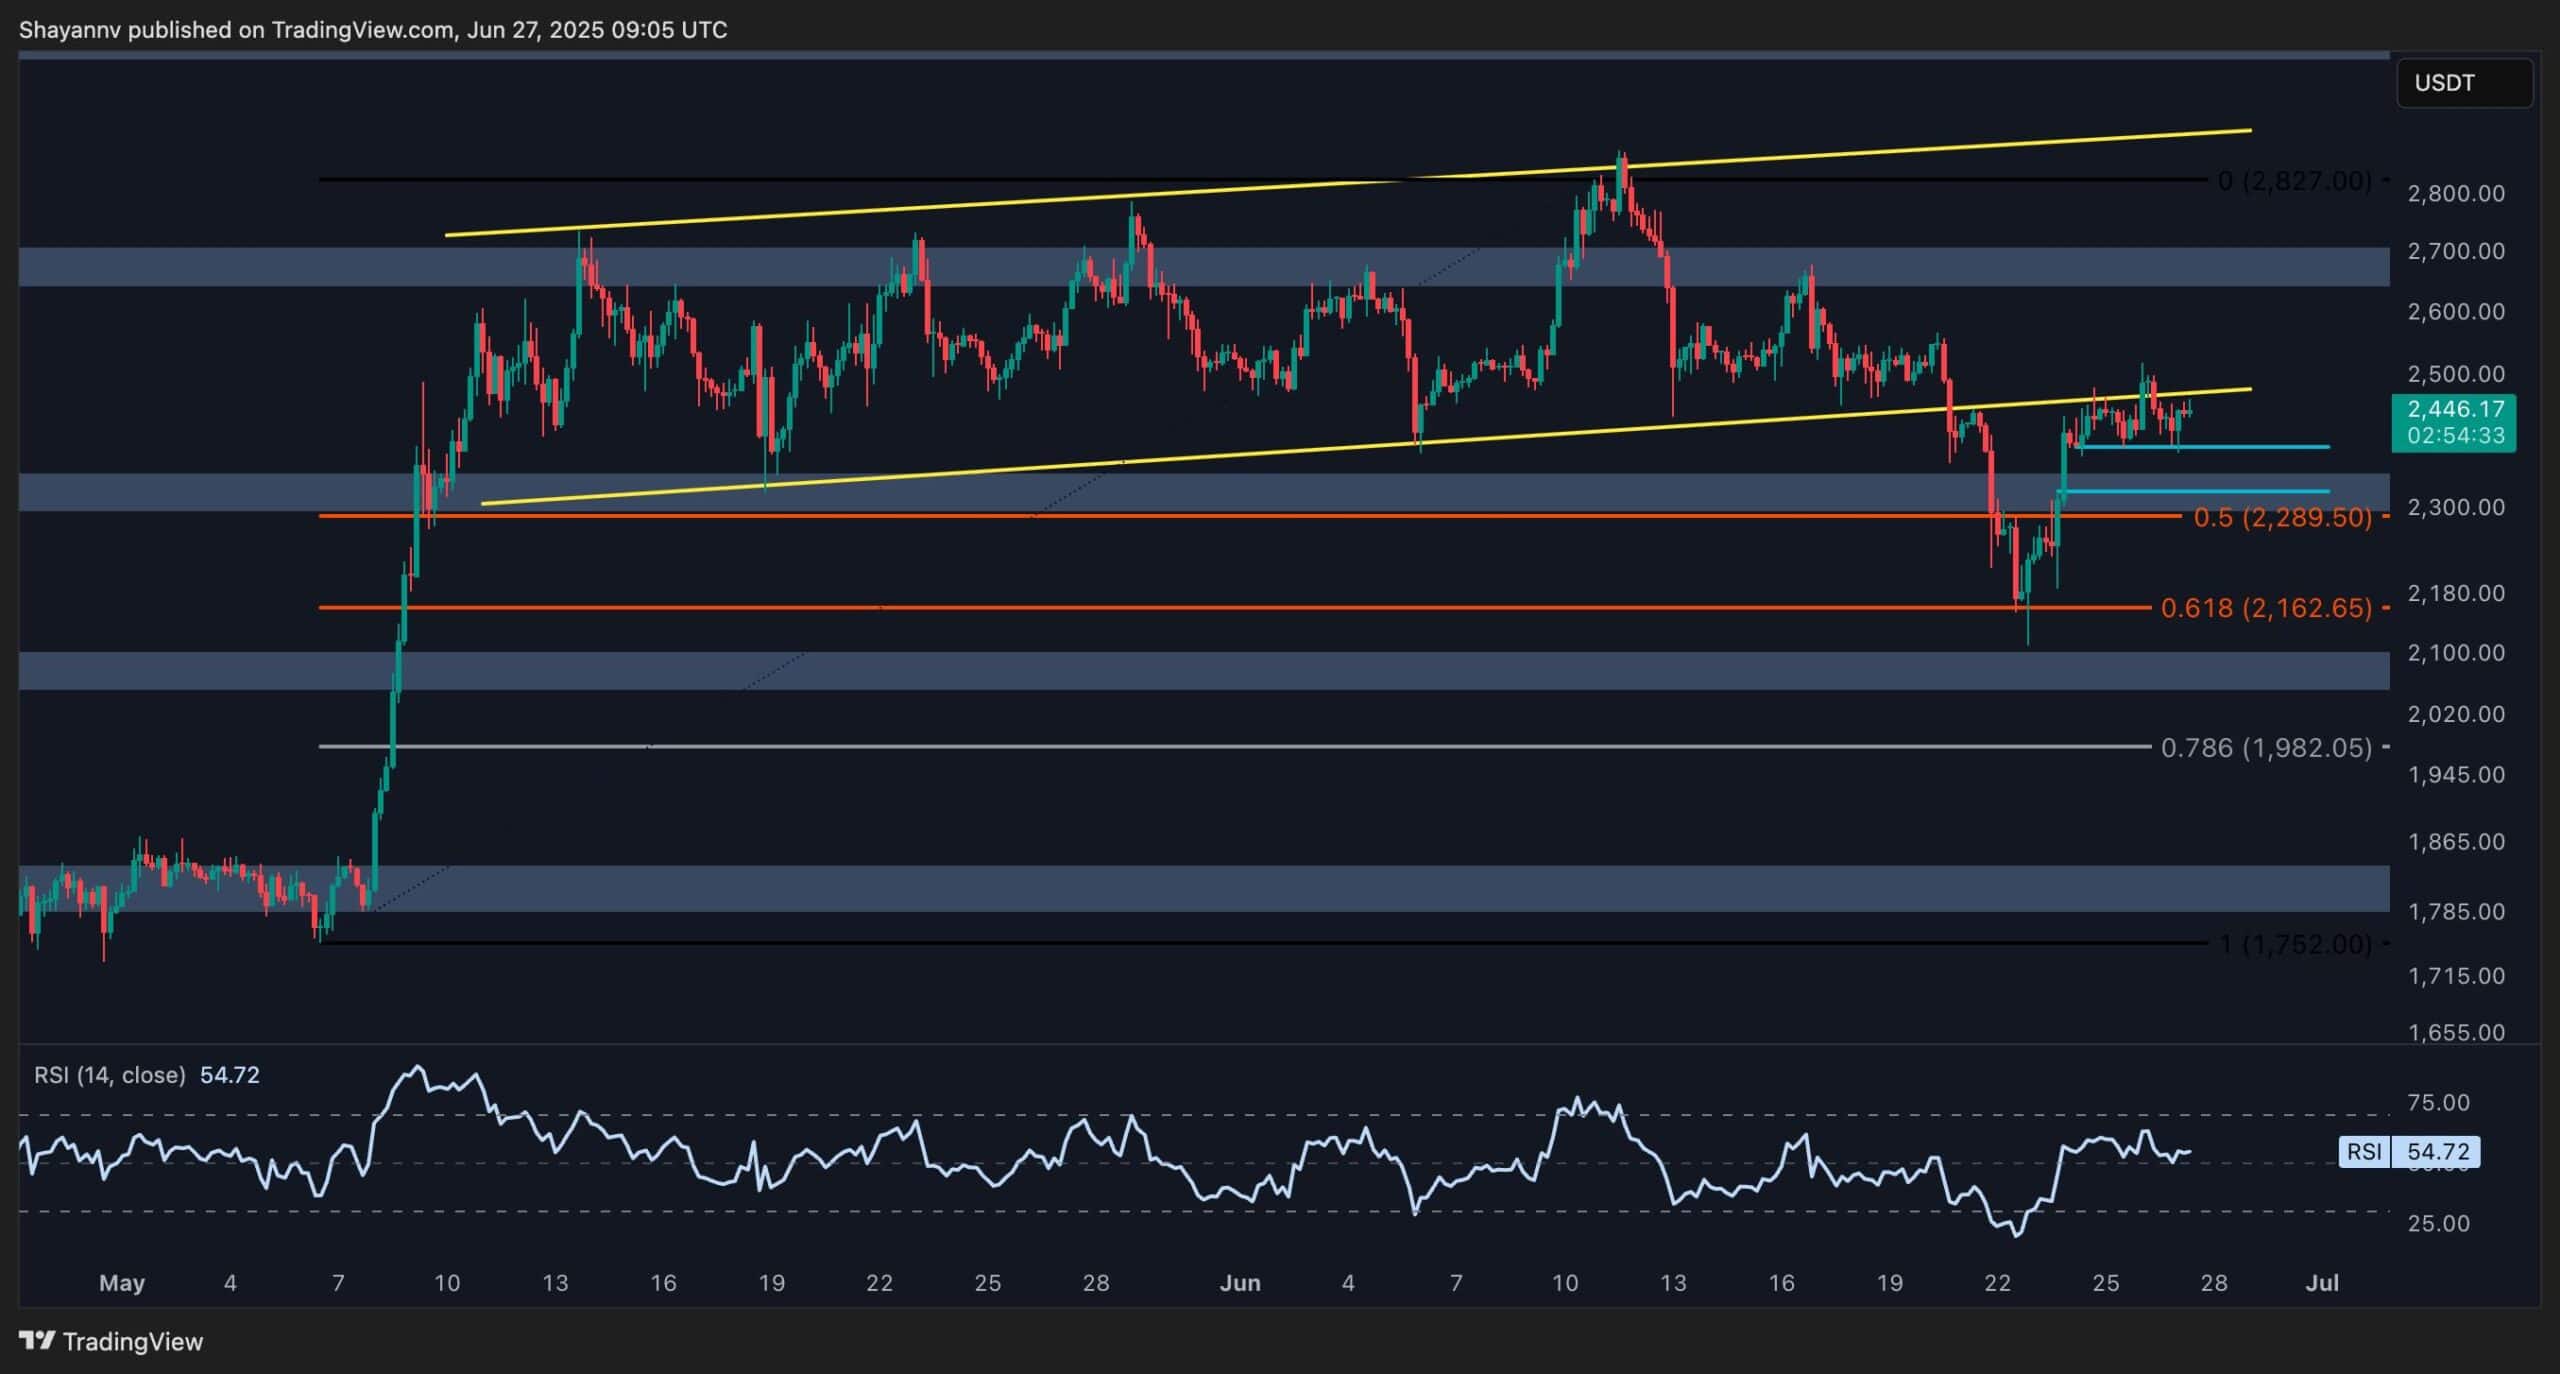
The 4-Hour Chart
Zooming into the 4-hour timeframe, ETH initially found strong support within the 0.5–0.618 Fibonacci retracement zone, a historically reliable level during corrections.
The sharp reaction from this range led to a quick move upward. However, the rally has now stalled precisely at the previous flag’s lower boundary, which currently acts as resistance NEAR $2.4K.
This rejection increases the probability of another downward leg, unless the buyers are able to swiftly reclaim control. The $2.1K zone, which overlaps with the Fib support, remains a key battleground.
As long as this area holds, the market structure retains a bullish bias. If breached, however, it may pave the way for a deeper decline toward $2,000.
By Shayan
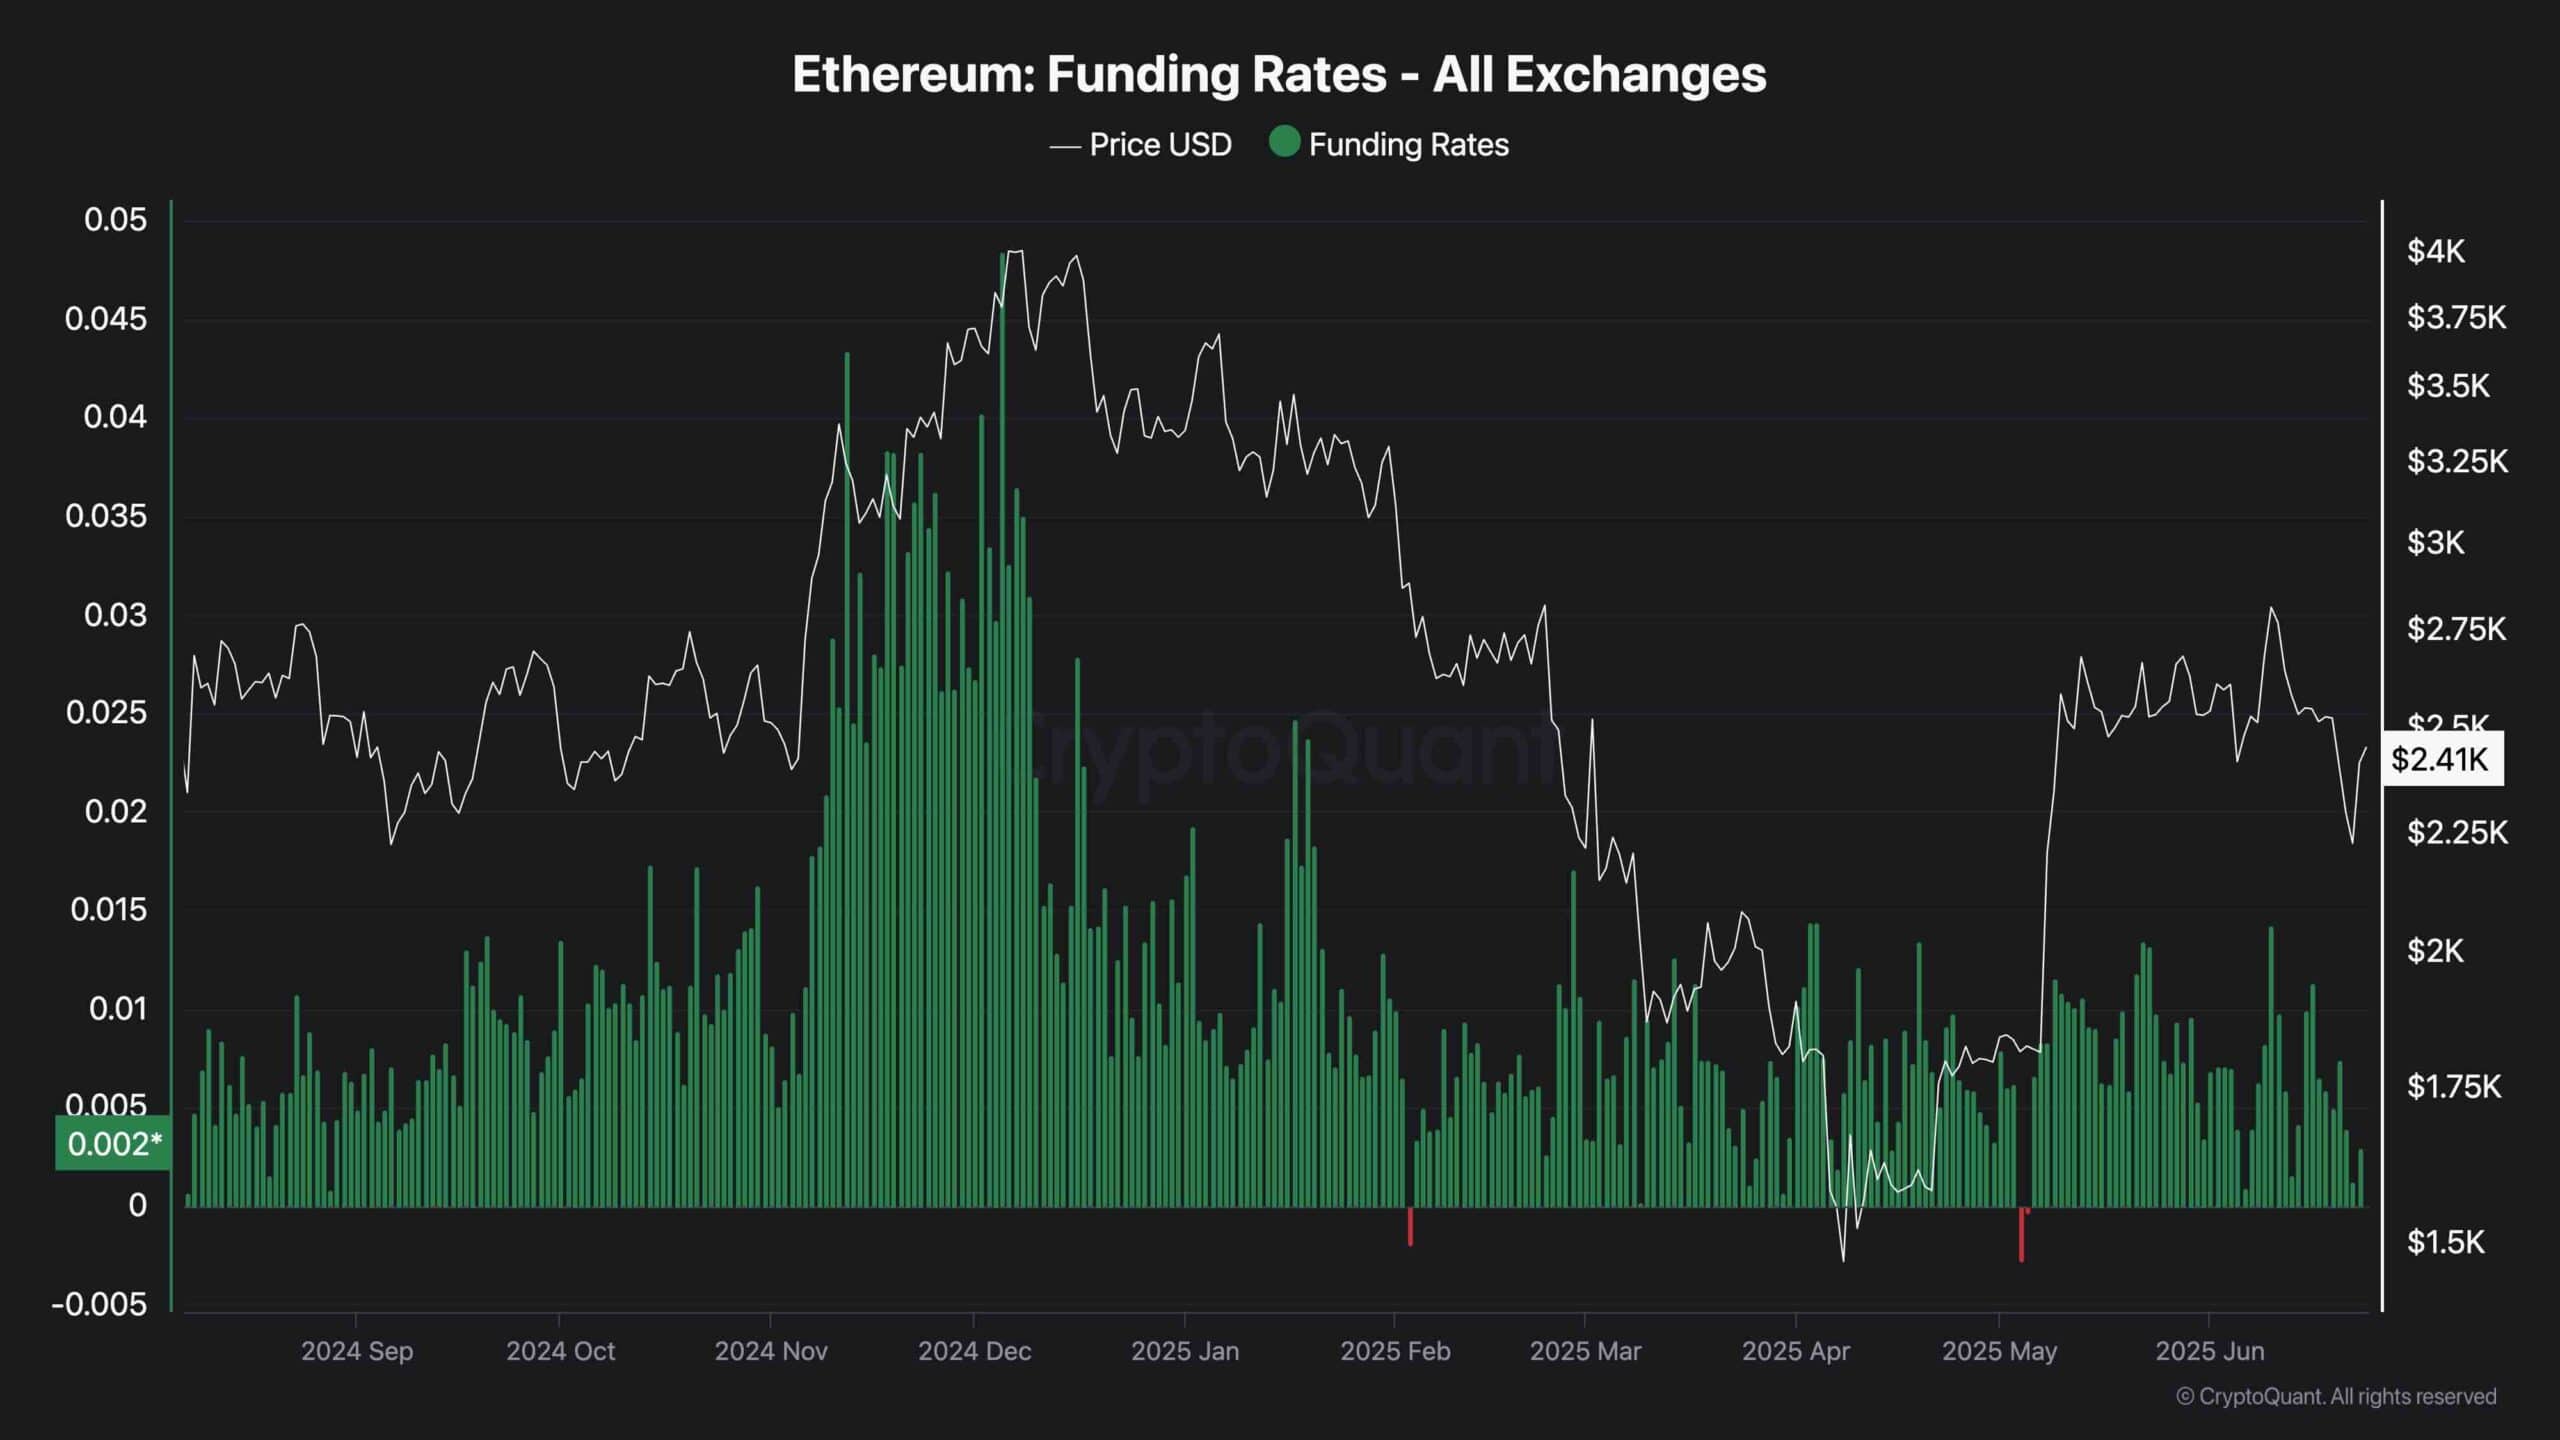
The funding rate metric serves as a crucial gauge of trader sentiment within the futures market. Typically, in a healthy and sustainable uptrend, funding rates increase steadily, reflecting growing interest from long position traders across both the perpetual futures and spot markets.
However, recent trends reveal a decline in Ethereum’s funding rates, signalling waning bullish momentum and potential buyer fatigue. This shift raises the probability of a short-term rejection and deeper corrective movement.
That said, as funding rates approach the neutral zone near zero, it may suggest a reset in Leveraged positions, indicating that the market is cooling off. This environment often precedes renewed demand and could pave the way for a strong bullish continuation once the current consolidation phase concludes.