Ethereum Price Alert: ETH Isn’t Safe Yet—Here’s the Key Signal to Watch

Ethereum's price action remains precarious—despite recent bullish whispers, ETH won't confirm a true reversal until it smashes through a critical resistance level. Traders clinging to hopium should temper expectations until the charts scream confirmation.
The make-or-break moment: Watch for a decisive close above $3,800 with volume backing the move. Anything less? Just another fakeout for bagholders.
Why institutions aren't biting: Macro uncertainty and regulatory shadowboxing keep big money sidelined. Meanwhile, retail gets front-run by algo traders—again.
Funny how ETH's 'deflationary' narrative gets quieter when gas fees drop below $1. (Cue the 'adoption' PowerPoint slides.)
Technical Analysis
By ShayanMarkets
The Daily Chart
On the daily chart, ETH recently broke down from an ascending channel formation that had been building for weeks. This pattern, often bearish, played out with a sharp drop that found support at the $2,200 region, a key demand zone marked by previous accumulation and the 100-day moving average.
After tagging this level, ETH bounced aggressively and is now retesting the lower boundary of the channel from below. The 200-day MA is also nearby, located just above the channel’s lower boundary at the $2,550 mark.
The confluence of these resistances makes this zone critical. So far, the price action has shown hesitation, a common characteristic of weak retests. So, if the buyers fail to reclaim this zone convincingly, we could see another leg down below the $2,000 mark. Conversely, a strong daily close above $2,550 WOULD invalidate the bearish structure and open room for a revisit of the $2,800 resistance level and order block.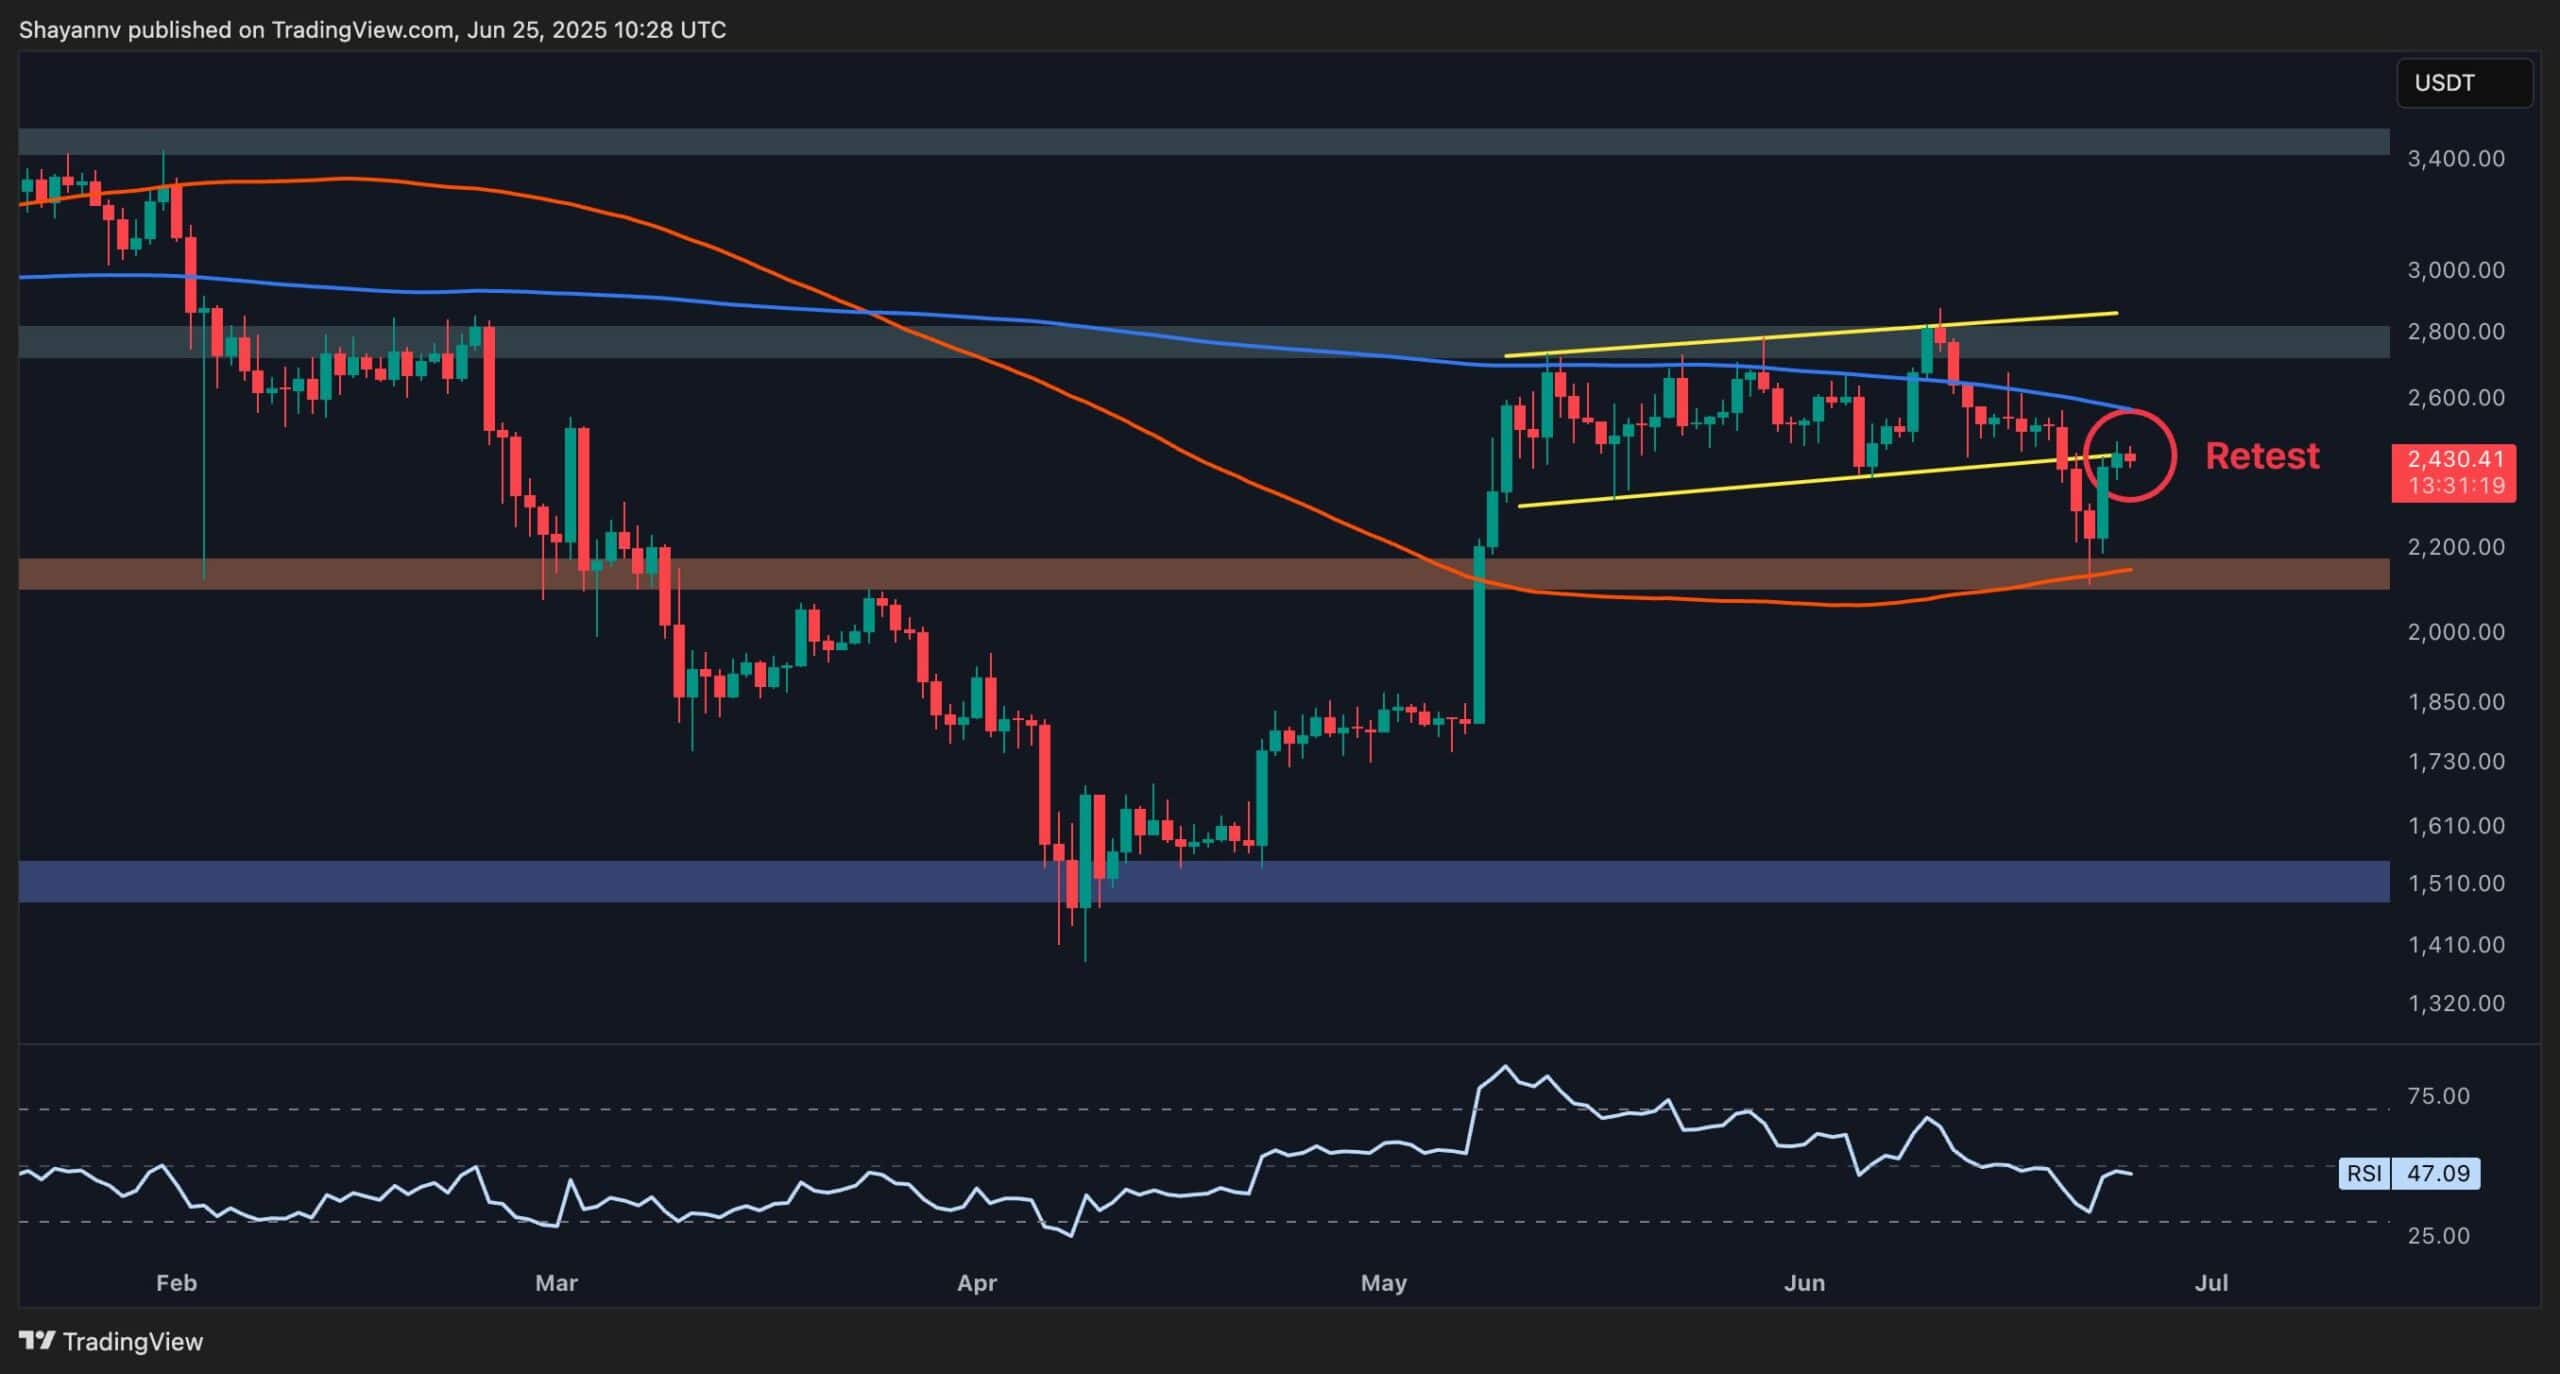
The 4-Hour Chart
As the 4-hour timeframe shows, ethereum tested the bullish Fair Value Gap (FVG) created during the recent bounce, using it as a support to climb higher. The short-term structure will flip bullish if the price breaks back into the channel, invalidating the bearish pattern effectively.
Meanwhile, the RSI has also jumped above 50, indicating that the buyers are in control again on this timeframe, which could lead to a recovery and clear the path for a retest of the $2,800 resistance zone.
On-Chain Analysis
Ethereum Exchange Reserve
Exchange reserve data from CryptoQuant shows that Ethereum holdings on centralized trading platforms have dropped to 18.8 million ETH, the lowest level in recent years. This steady decline reflects reduced selling pressure and a strong preference for self-custody, often interpreted as a bullish long-term signal. When reserves fall, it generally means fewer coins are readily available to sell on exchanges, potentially setting up a supply shock.
However, it’s important to note that while low reserves often accompany major bullish moves, they are not a short-term timing tool. Price can still drop in the NEAR term if demand does not match current supply flows or if broader market conditions remain risk-off. This metric supports long-term strength, but short-term price action remains technically vulnerable.
