Ethereum at a Crossroads: Will ETH Plunge to $1.5K or Defy Gravity?

Ethereum's price teeters on the edge—again. After sliding to a critical support zone, traders are sweating over whether $1.5K is the next stop. Here's the breakdown.
Technical Tug-of-War
ETH's chart paints a messy picture. Bulls cling to key levels like climbers on a crumbling ledge, while bears salivate at the prospect of a sub-$1.5K liquidation party. The last time ETH visited these depths, it sparked a 40% rally—but history doesn't always repeat (just ask the bagholders of 2022).
Market Pulse Check
Volume tells the real story: weak hands are dumping, while OGs accumulate. Classic crypto whipsaw behavior—panic sells followed by regret buys. Meanwhile, institutional players keep stacking ETH futures like it's 2021, because nothing says 'conviction' like leveraged bets with other people's money.
Bottom Line
Either ETH bounces hard from here or becomes another casualty in crypto's endless cycle of hype and heartbreak. One thing's certain: the 'buy the dip' crowd will claim victory no matter where price lands—because in crypto, selective memory is the ultimate trading strategy.
The Daily Chart
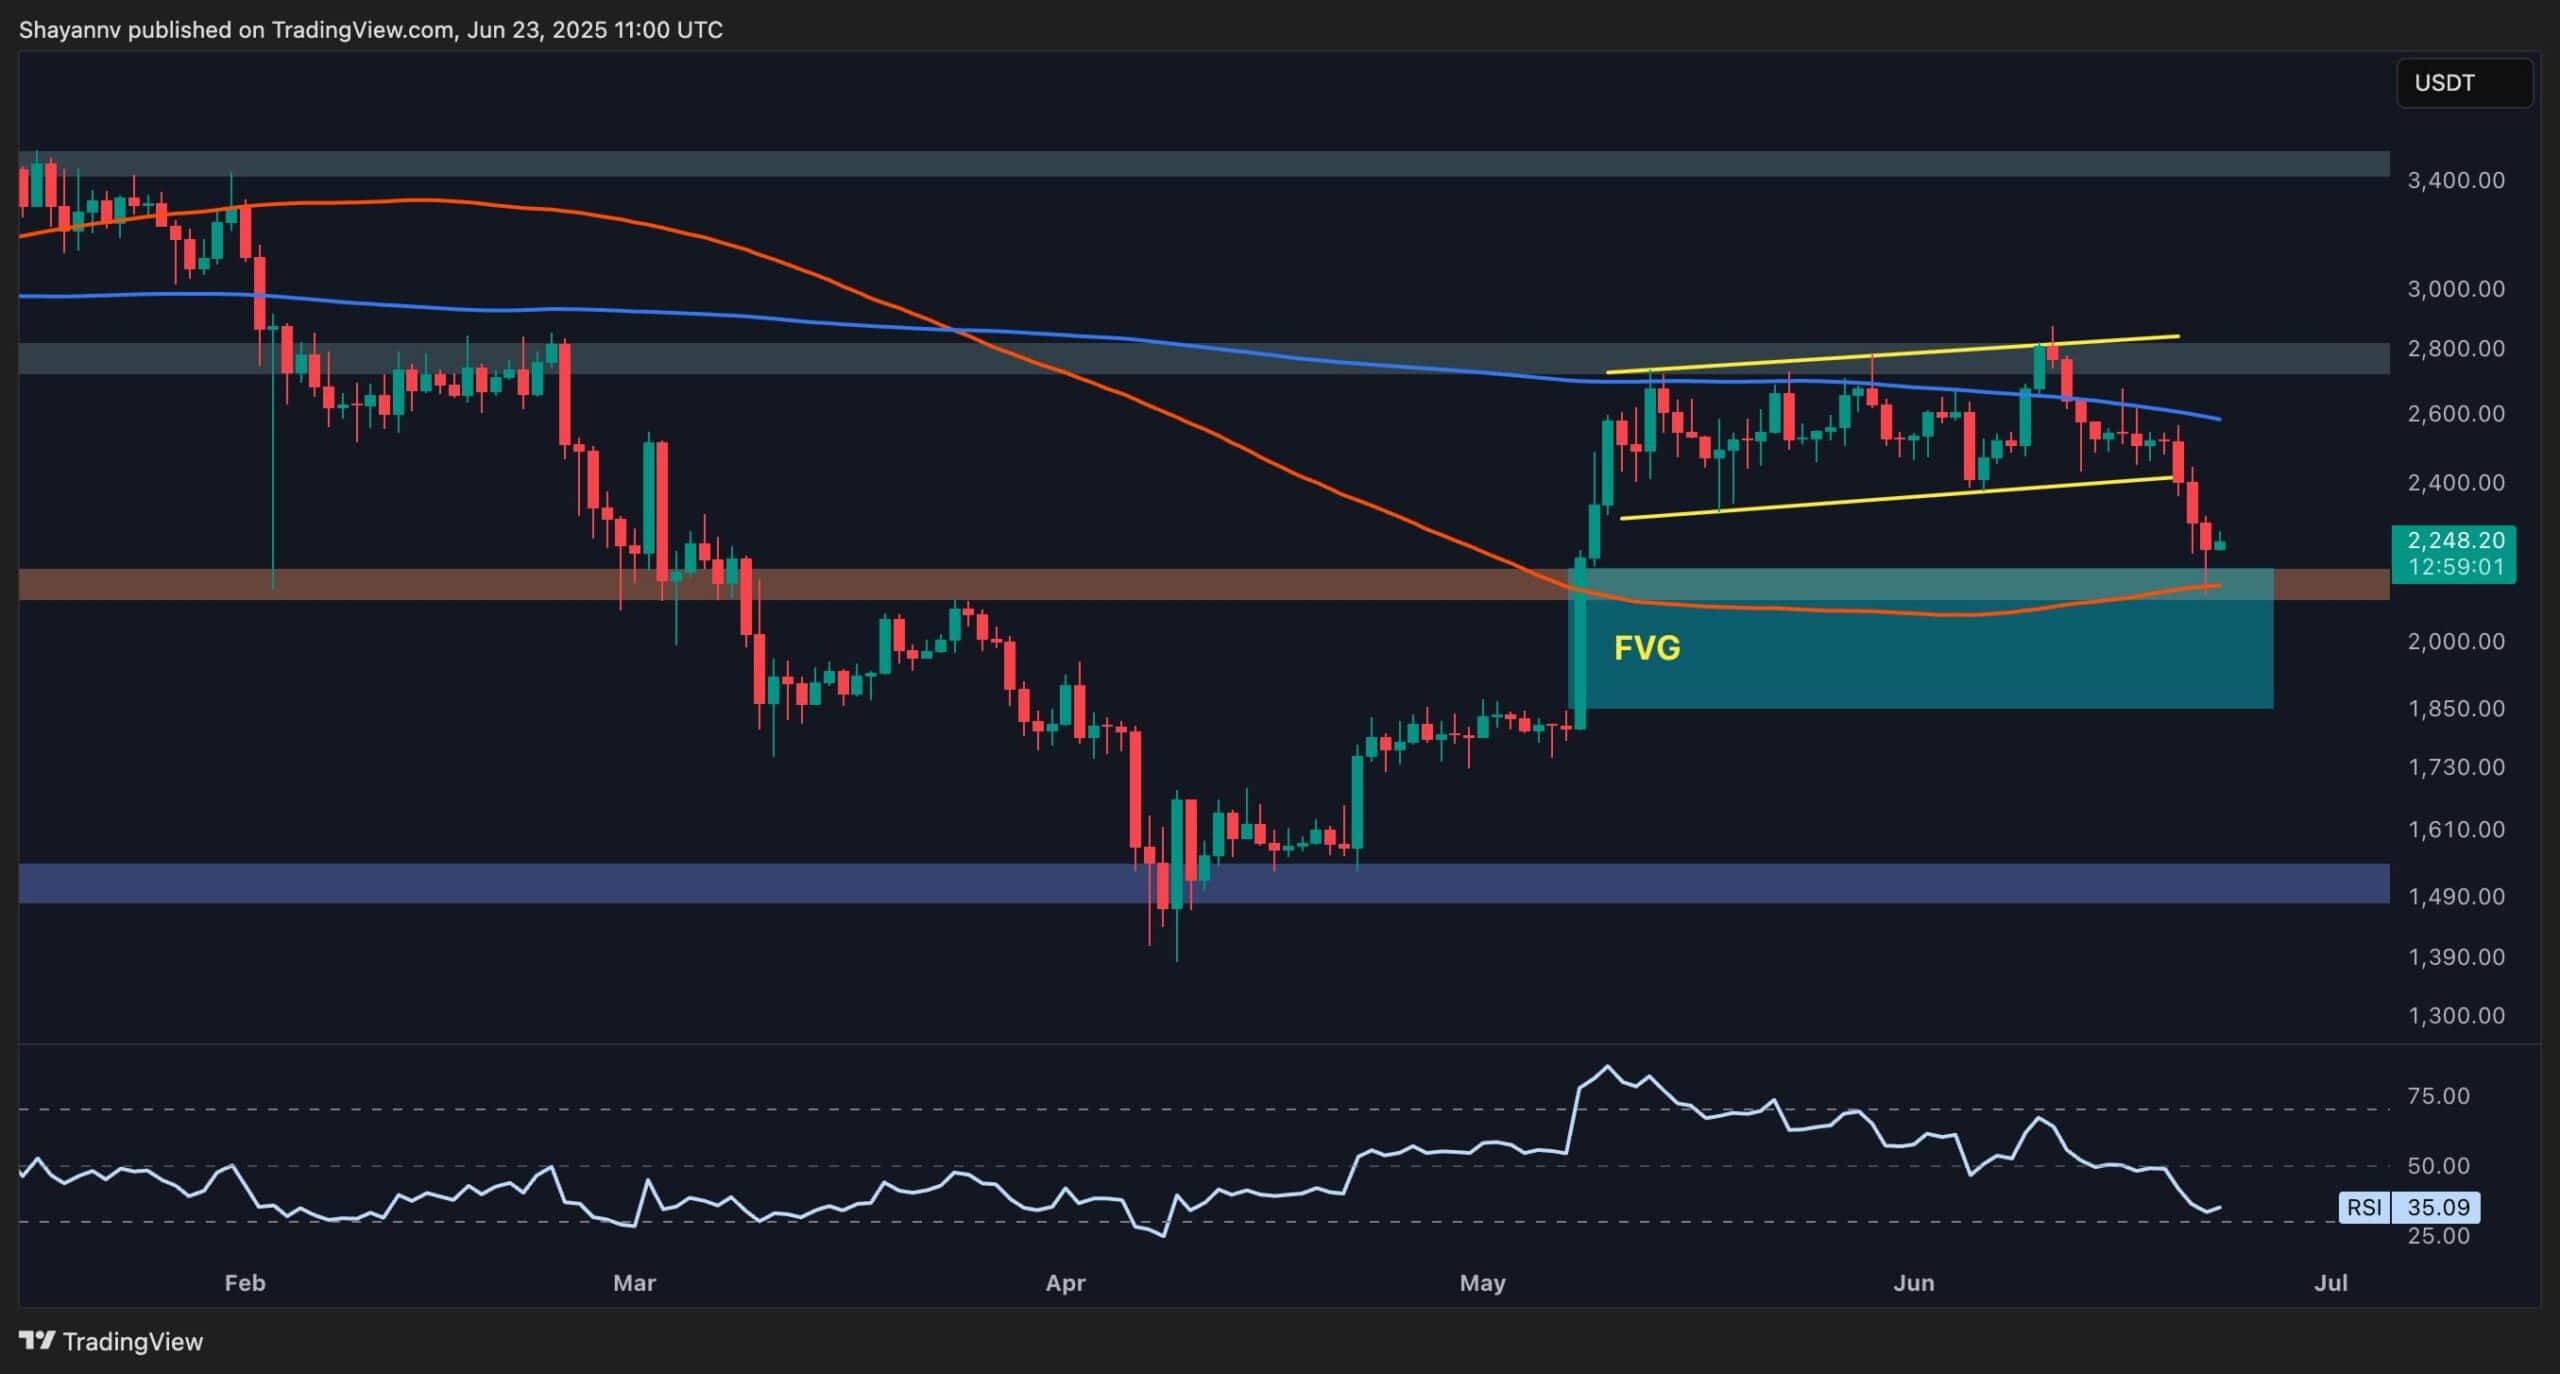
The daily chart shows a clear bearish breakdown from an ascending channel that had been developing since early May.
This pattern played out with high precision, sending ETH down from nearly $2,900 to just above $2,200 within a few days. The price tapped into the large Fair Value Gap (FVG) zone between $1,900–$2,200, where some buyers stepped in. However, despite the wick into the FVG and the bounce from the 200-day moving average, momentum remains weak.
The 100-day moving average, located around the $2,200 mark, is also acting as support. Yet, the rejection from the 200-day MA around the $2,600 mark reinforces the idea that sellers are in control.
Moreover, the RSI is currently around 35, not yet oversold but hovering near critical territory. If the mentioned FVG fails to hold, the next major support zone lies at $1,500, a level that previously served as the base for the April rally. Therefore, the buyers will need to see a reclaim of the 200-day moving average followed by strong volume to consider any meaningful bullish continuation.
The 4-Hour Chart
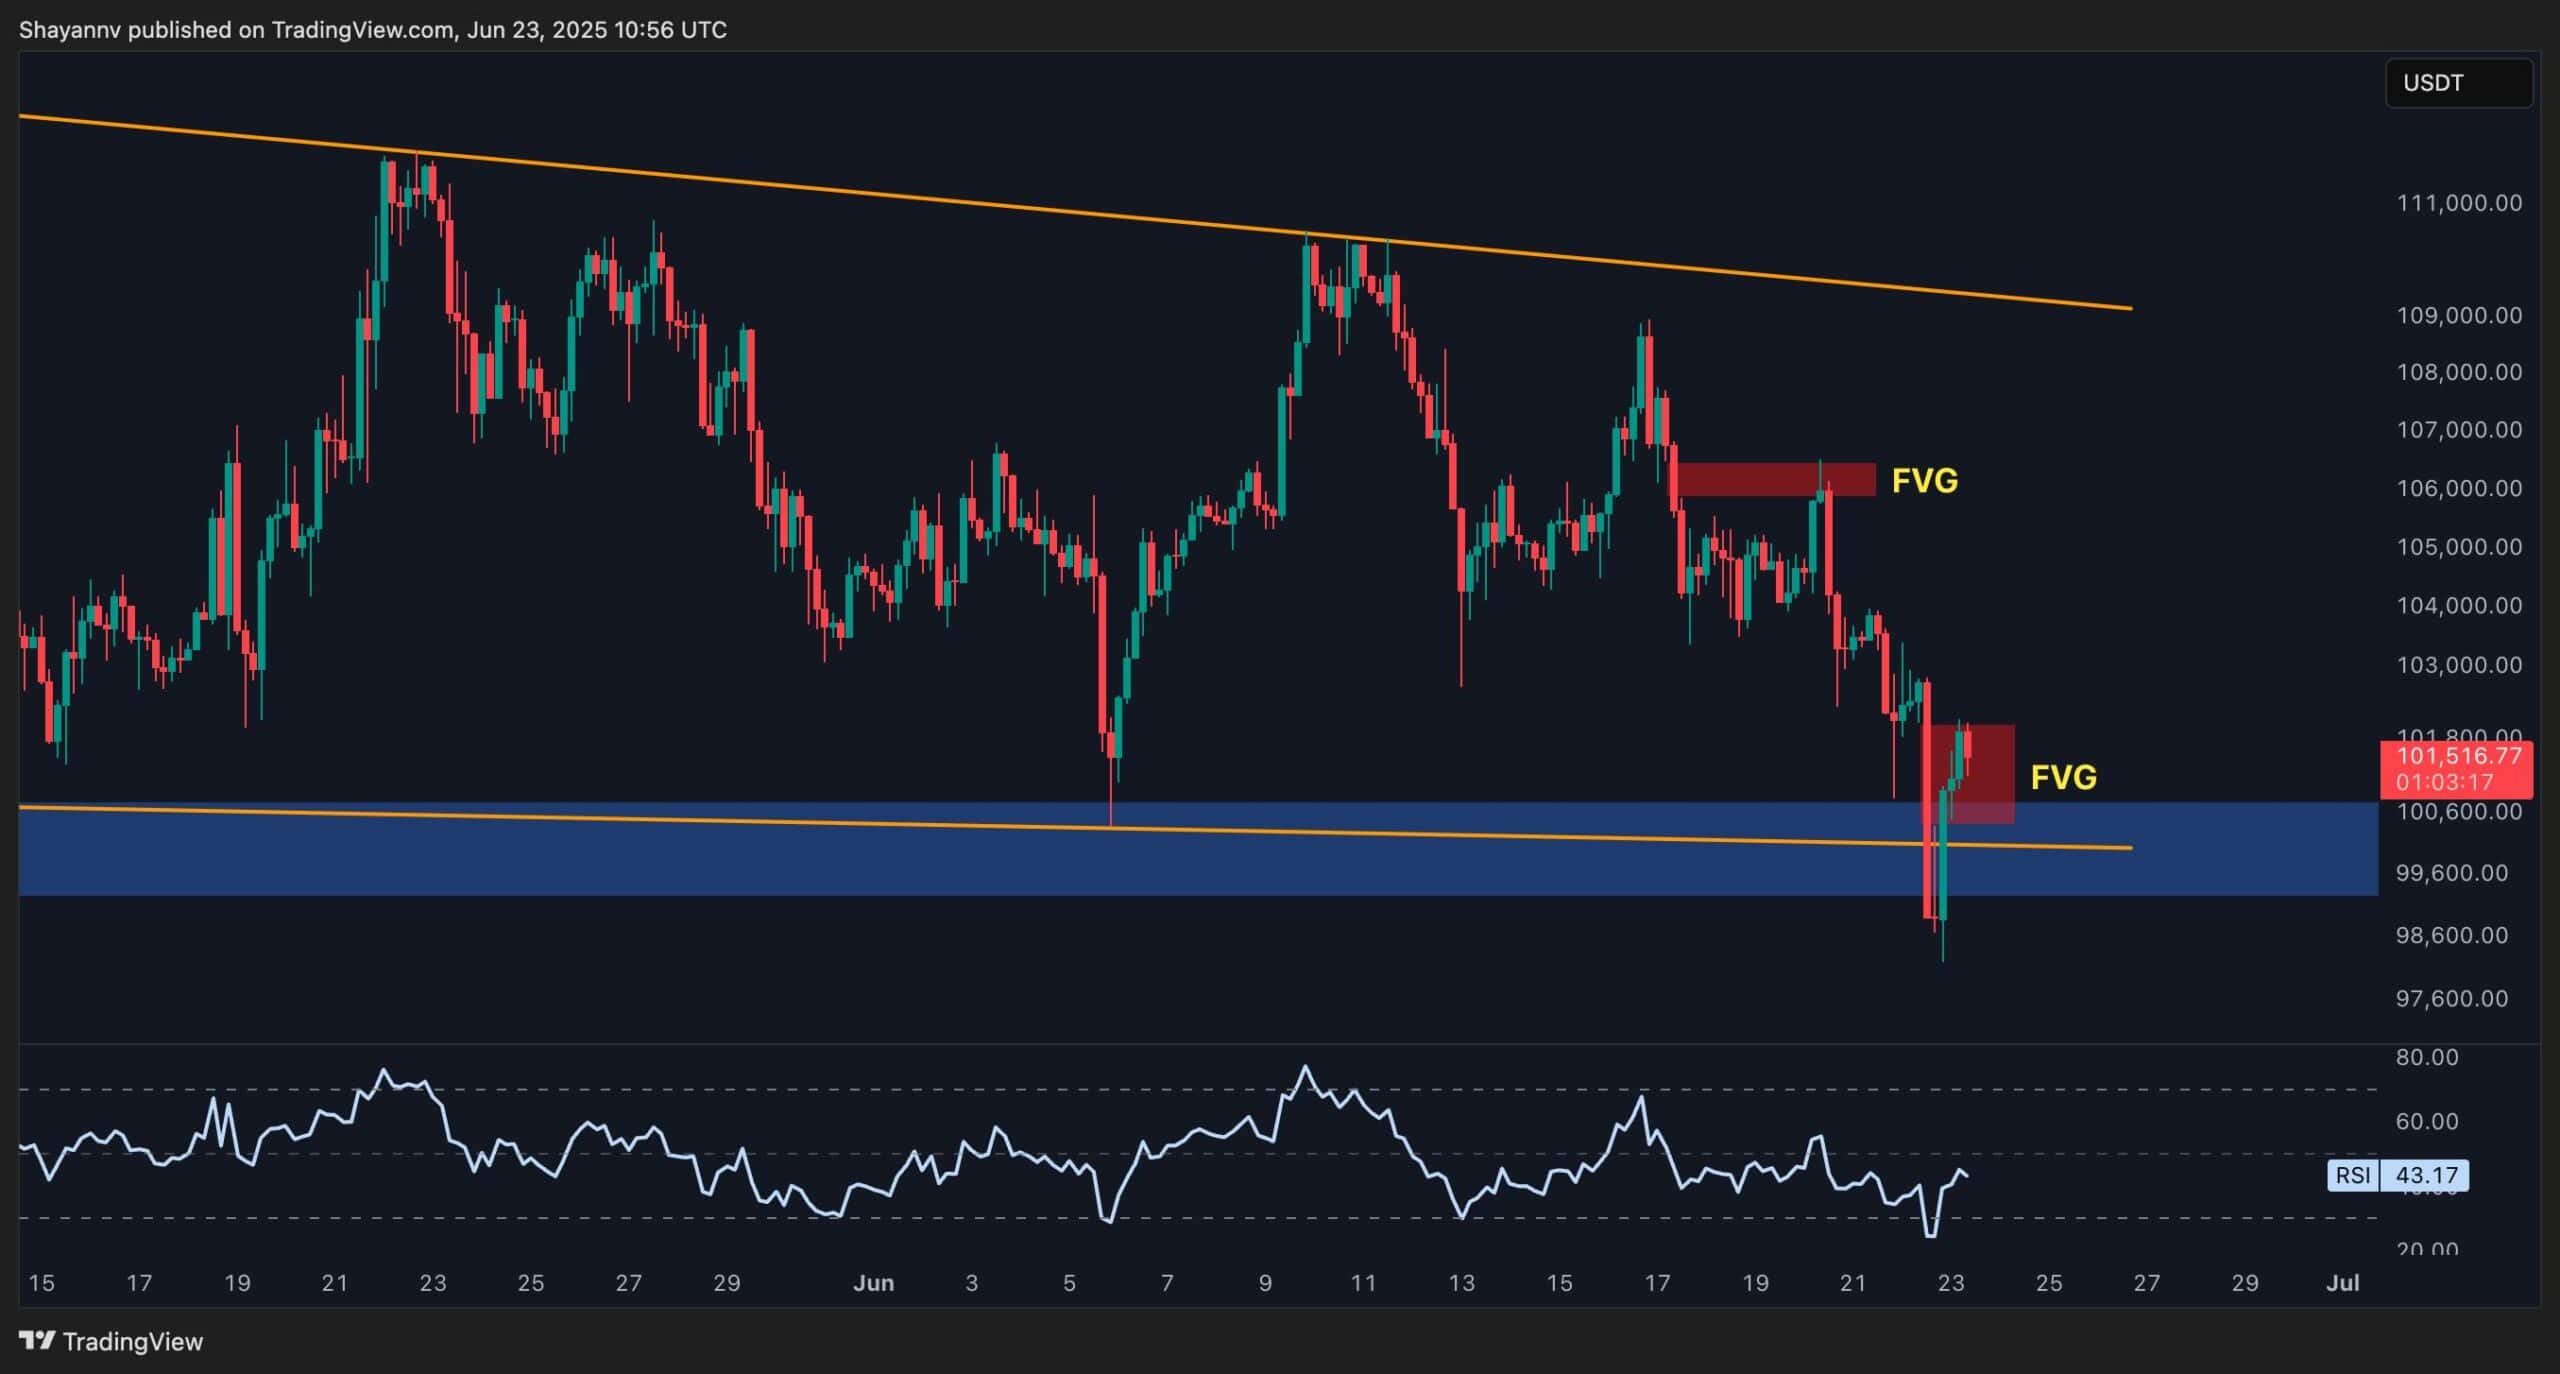
Zooming into the 4-hour timeframe, ETH has been in a steady downtrend since losing the ascending channel support earlier this month. After breaking down, the price retested the lower boundary of the channel and failed to reclaim it, leading to a swift drop toward the $2,100 area. This level has provided temporary relief, but the bounce appears weak and corrective.
There is a visible bearish structure forming with lower highs and lower lows. The RSI on this timeframe is around 34, echoing the bearish momentum and lack of strength in bullish attempts. Unless ethereum can recover above $2,300 and hold that level as new support, the current selling pressure could lead to another leg down toward the $2,000 level. If the selloff intensifies, the next significant demand zone lies near $1,800.
Ethereum Long Liquidations
The liquidation chart reveals a massive spike in long liquidations over the past few days, corresponding with Ethereum’s aggressive MOVE down to $2,200. This uptick indicates that many late long positions entered around the $2,600–$2,800 levels were wiped out during this drop.
These liquidations can temporarily exaggerate downside movements, especially in highly Leveraged environments, and that seems to be what played out here.
The total long liquidations reached levels not seen in several months, showing how crowded the bullish trade had become.
While this could reduce some sell-side pressure in the short term, as the most vulnerable positions have been cleared, it also reflects a shift in sentiment from bullish to defensive. With confidence shaken and many traders underwater, any rebound attempts might be met with selling pressure from participants eager to exit or short any lower high.

