Ripple Price Alert: XRP Hits $2 – How Far Will the Drop Go?

XRP just kissed $2 before stumbling—now traders brace for the plunge.
Bullish momentum or bear trap?
The sixth-largest crypto by market cap flashed bullish signals earlier this week, briefly touching the $2 threshold before retreating. But with Ripple's ongoing SEC lawsuit still looming, skepticism runs high.
Technical indicators suggest...
• Immediate support at $1.80 looks shaky
• If broken, $1.50 becomes the next battleground
• Volume patterns hint at whale accumulation—or distribution
Meanwhile, Bitcoin maximalists are (predictably) calling this 'proof' of XRP's inevitable demise. Because nothing says 'sound analysis' like schadenfreude dressed as TA.
One thing's certain: In crypto, even the steepest drops can reverse faster than a Wall Street analyst changing their price target.
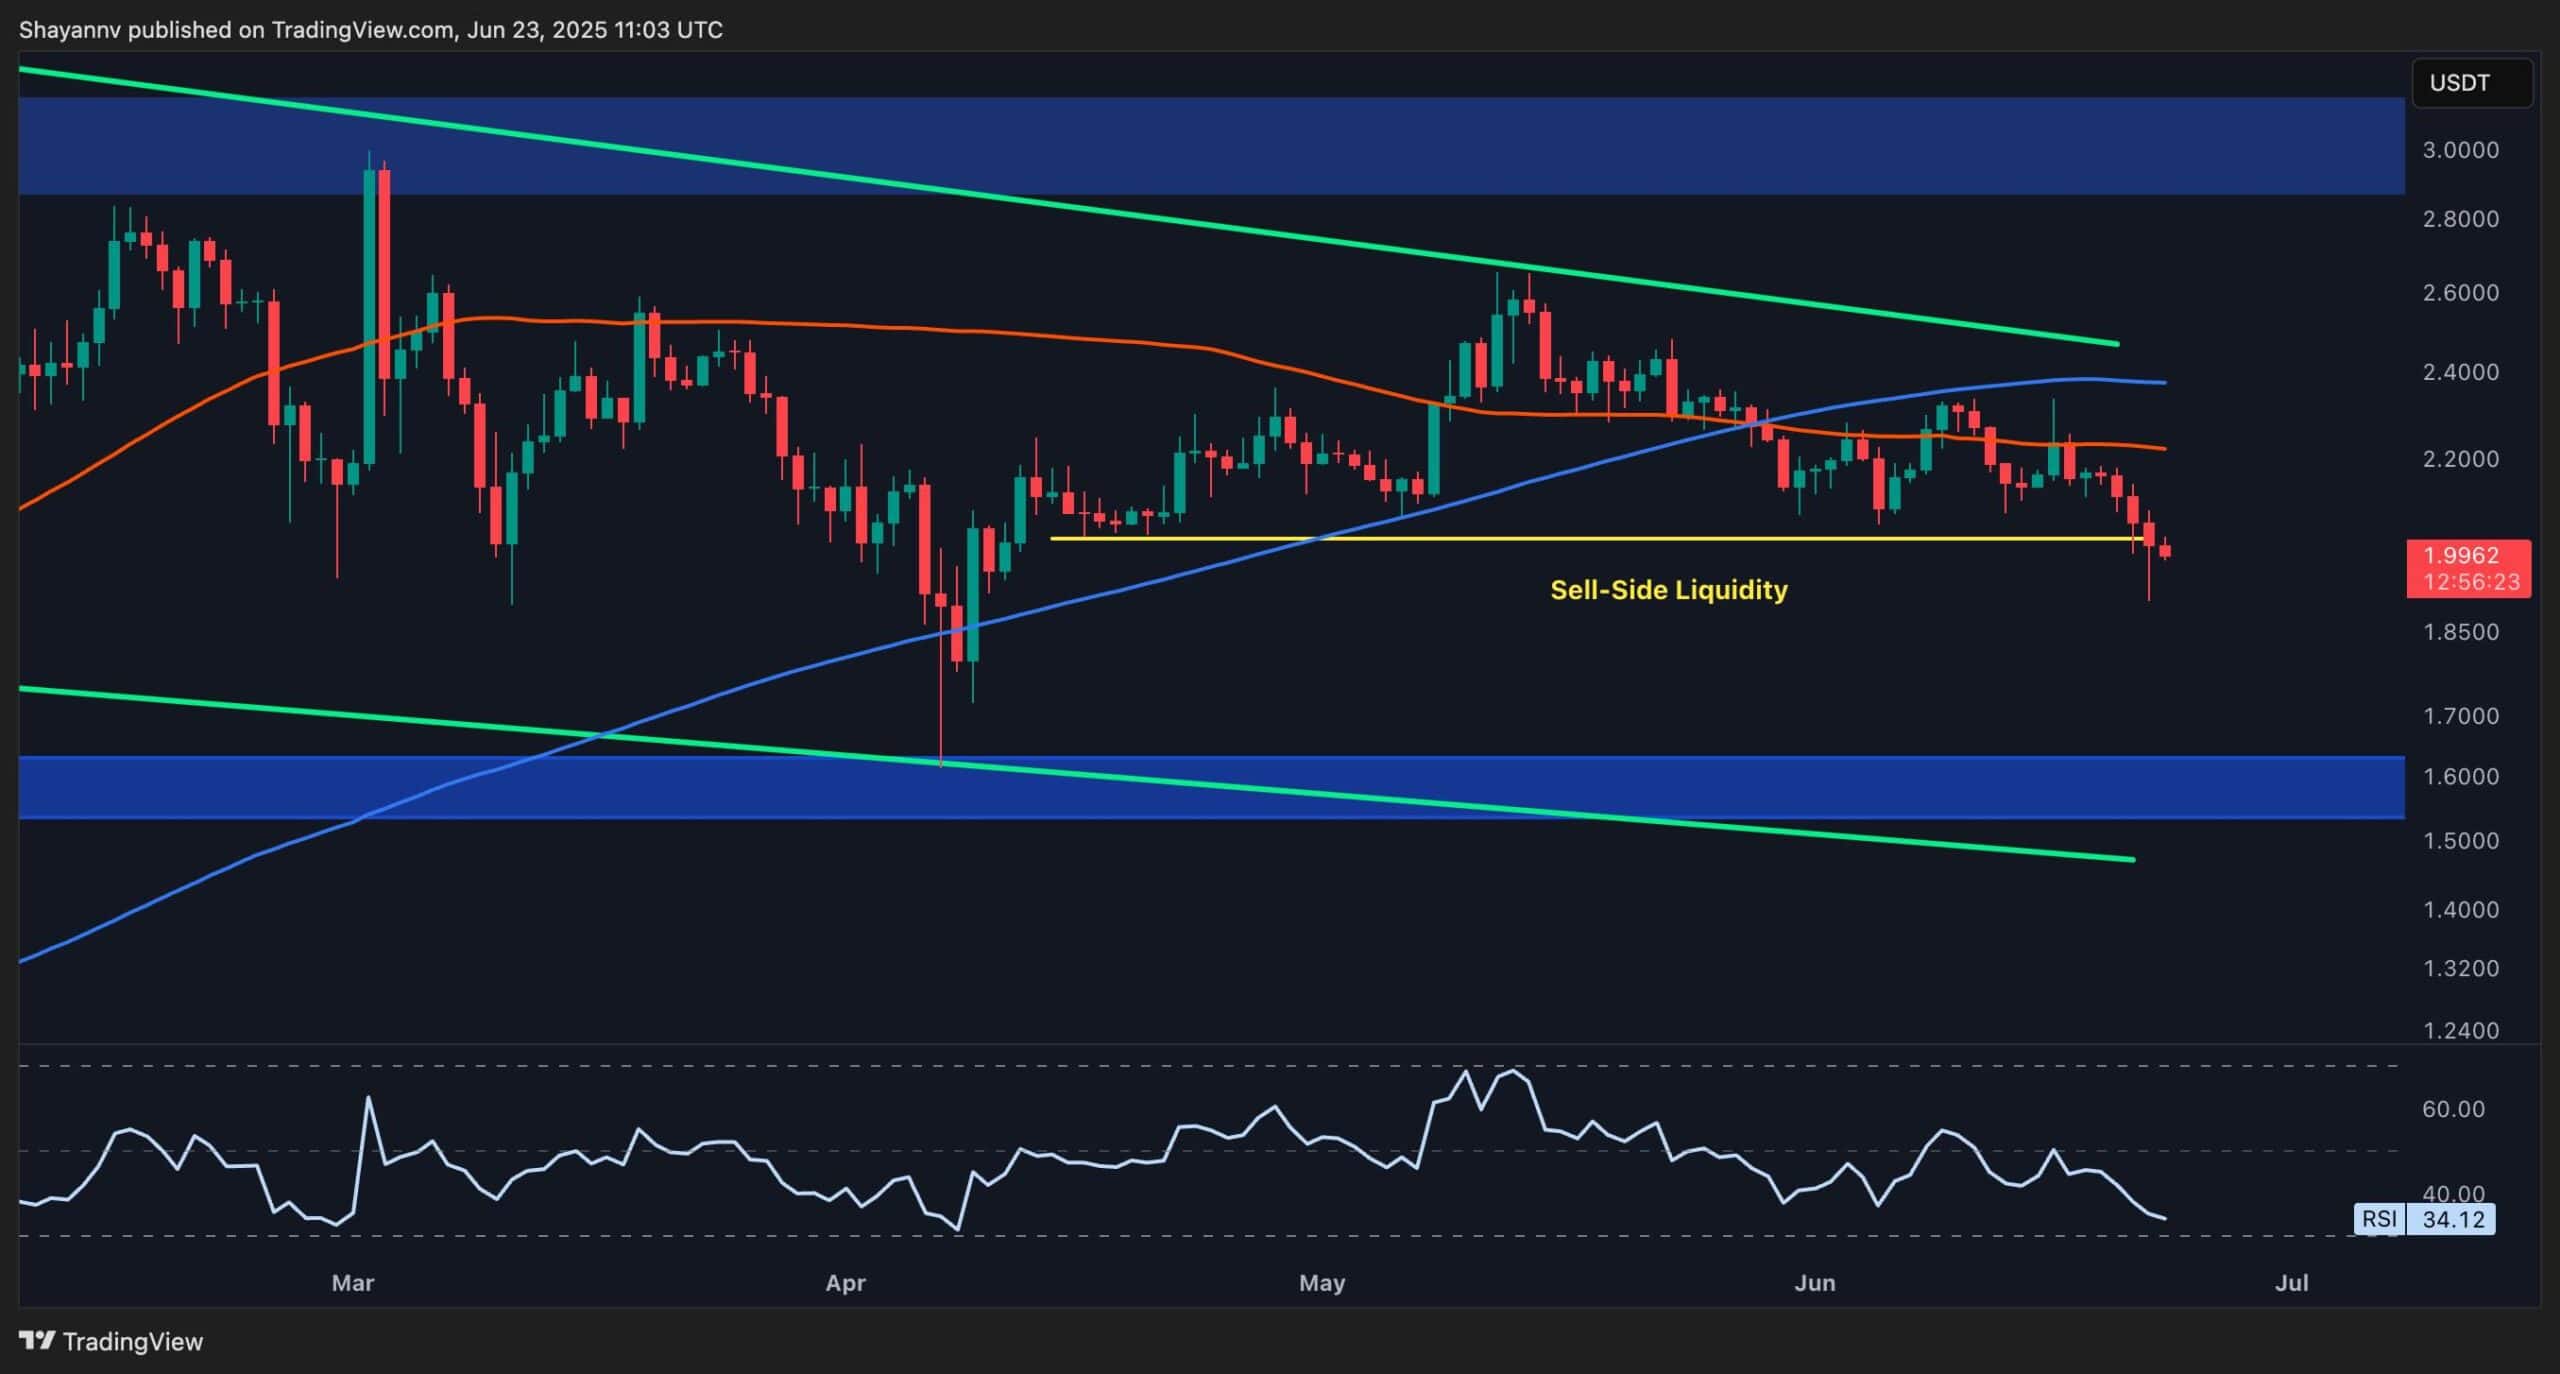
The USDT Pair
On the daily chart, XRPUSDT remains compressed within a long-term descending channel pattern, bounded by a descending trendline from the yearly highs and a horizontal support NEAR $1.60.
Tons of sell-side liquidity resting below the $2 level have been swept today, as the pair is currently trading below both the 100 and 200 moving averages, which are located in the $2.20-$.240 range. The RSI is also hovering near 34, indicating the lack of momentum and confirming the range-bound behaviour. If sellers manage to breach $1.95, the next logical demand zone lies around $1.6.
Meanwhile, upside resistance remains at the upper bound of the channel near $2.40 and the moving averages mentioned earlier. A clean break and daily close above these resistance elements WOULD potentially confirm a bullish rally, with the target being around $3. Until then, this is still a neutral to slightly bearish structure favouring range traders rather than trend-followers.
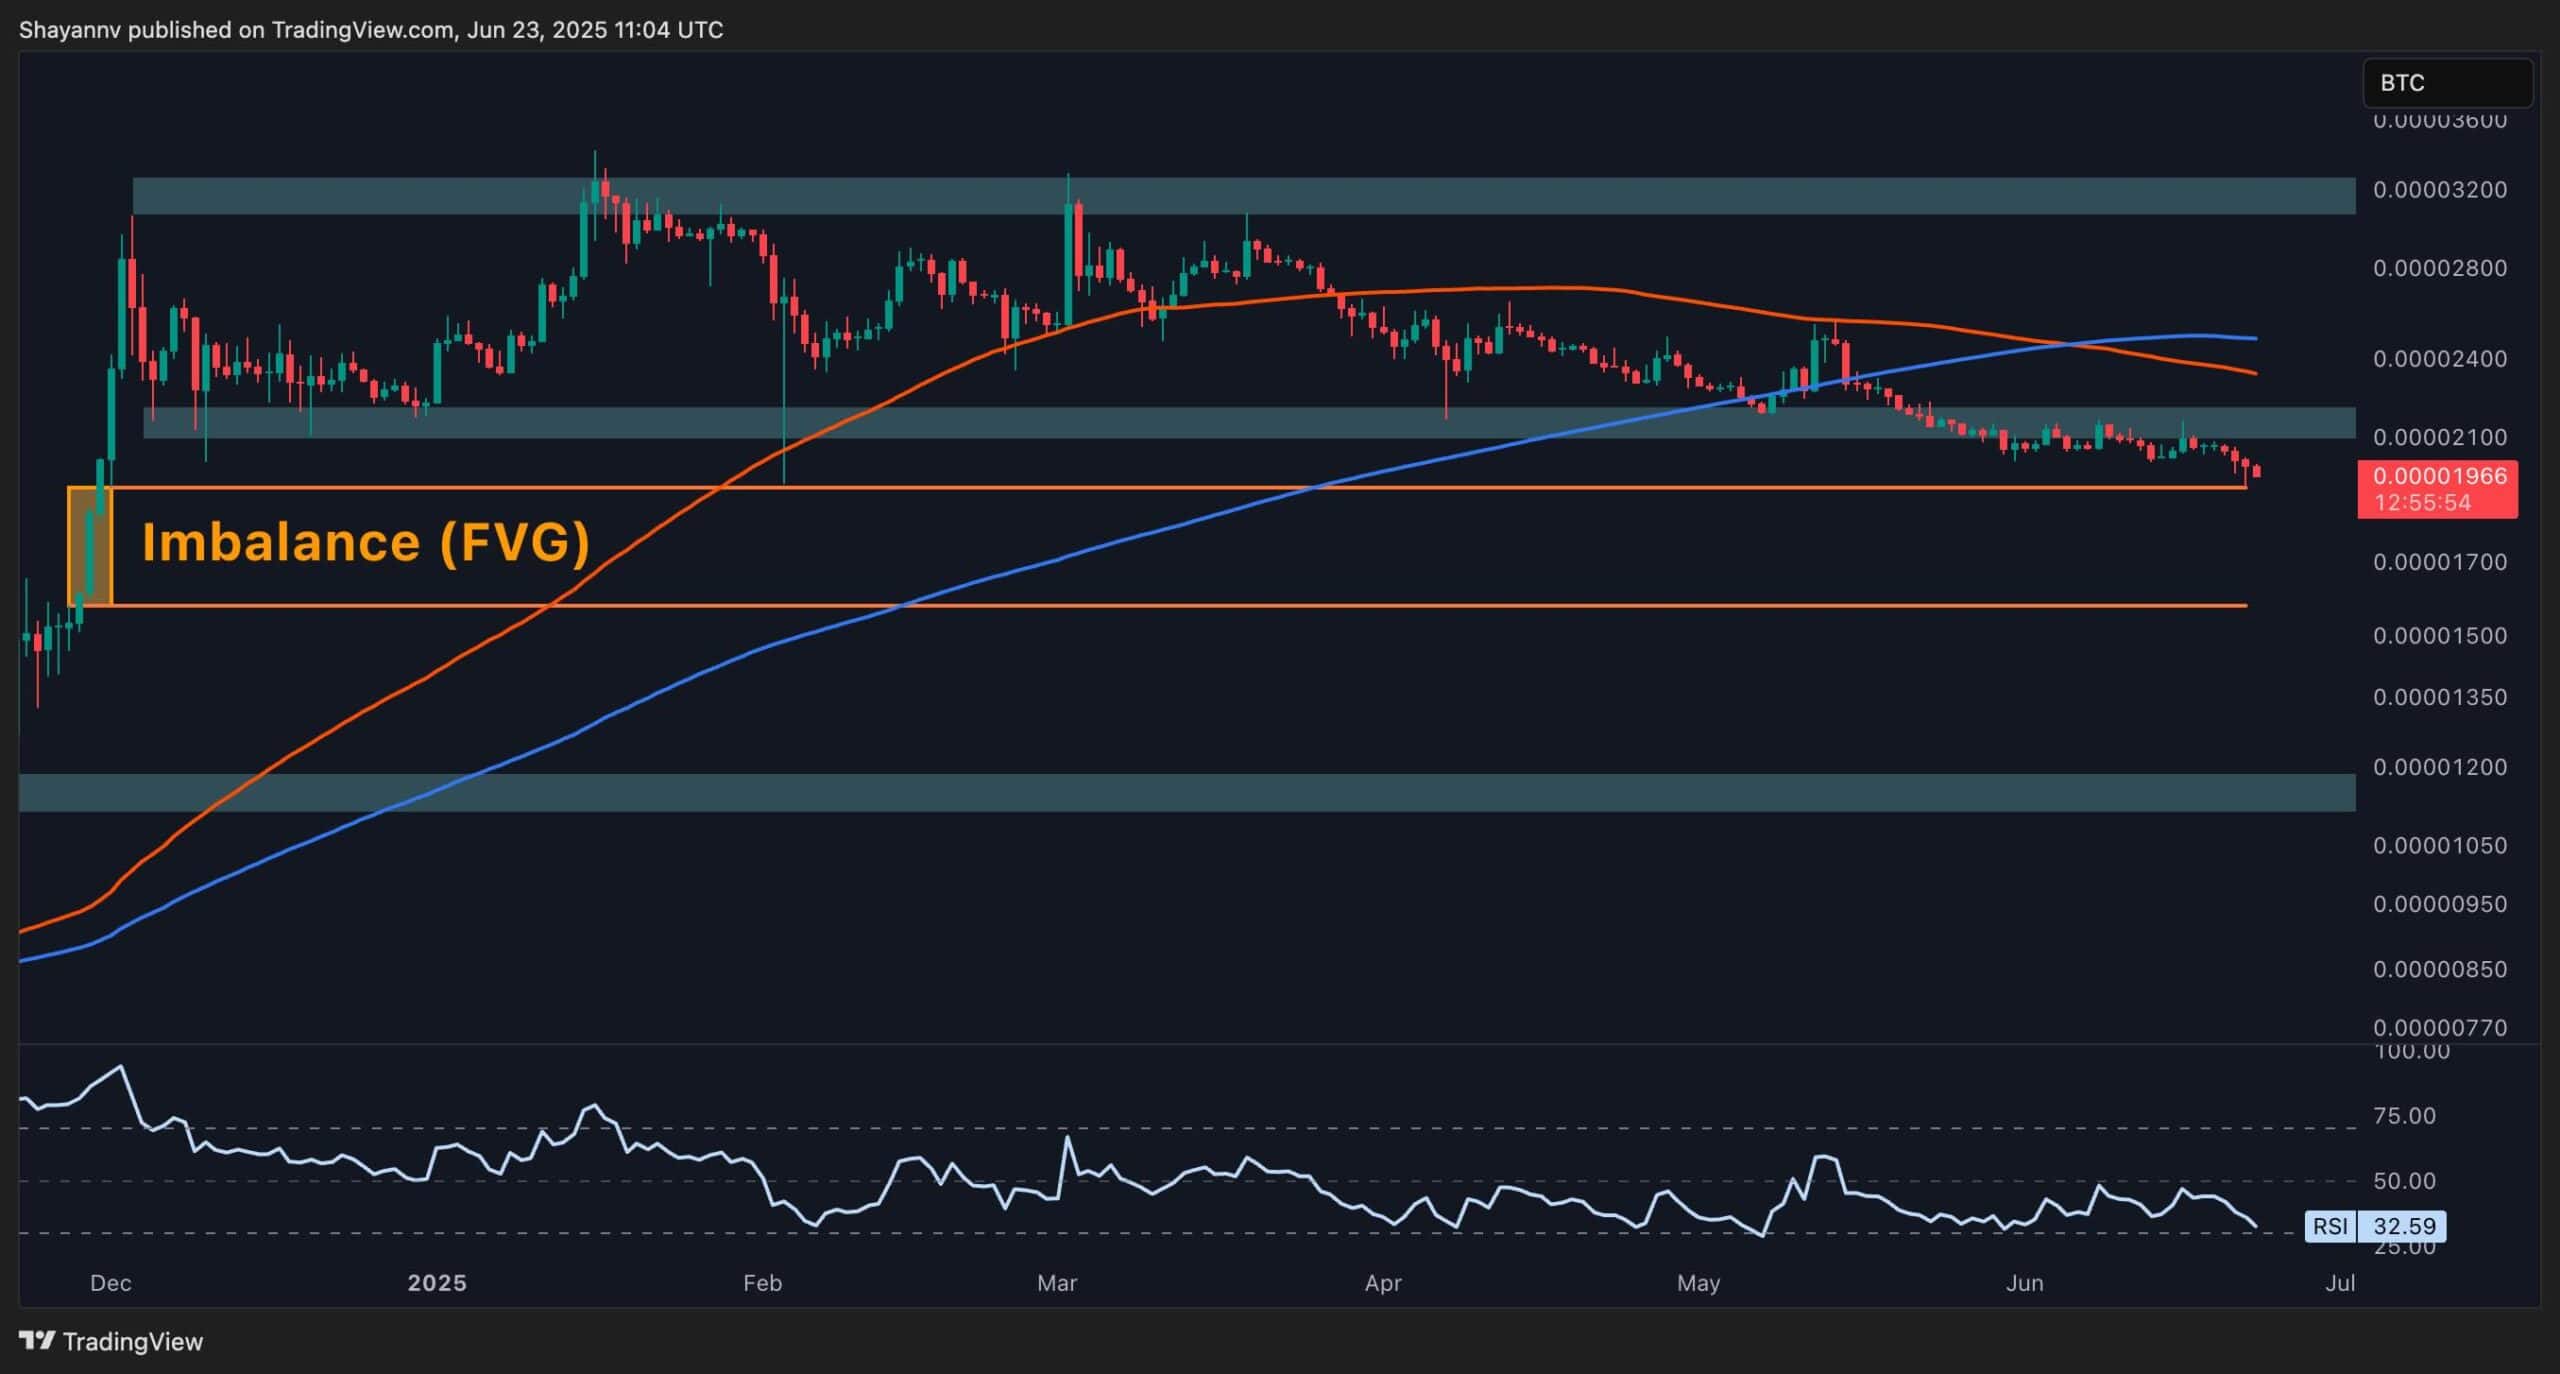
The BTC Pair
Against Bitcoin, XRP has shown persistent weakness since March, consistently printing lower highs and lower lows. The chart highlights a clear bearish market structure.
Both the 100 and 200 moving averages, located near the 2,400 SAT mark, are angled downward after a bearish crossover, and the RSI is still depressed near 32, reflecting ongoing relative underperformance.
Meanwhile, the pair is approaching the imbalance zone (FVG) left from the explosive rally in late 2024. This pocket, located just below 1900 SAT, could act as a support zone for a potential relief bounce. If the buyers step in here, the first challenge lies near the 2200 SAT resistance level. A decisive MOVE above that area could shift short-term momentum, but unless that happens, the pair remains locked in a clear bearish structure.