Bitcoin on the Brink: Explosive Breakout Targets $100K – Can $110K Be Far Behind?

Bitcoin's coiled-spring price action hints at an imminent explosion—traders are bracing for a potential surge toward six figures.
Key levels to watch:
- $100,000: The psychological magnet pulling BTC upward
- $110,000: The next logical target if bulls maintain control
Market technicians note shrinking volatility—a classic precursor to major moves. Meanwhile, Wall Street analysts still can't decide if crypto is 'digital gold' or 'a speculative asset' (spoiler: it's both).
With institutional flows accelerating and retail FOMO brewing, this breakout could rewrite the playbook. Just don't tell the SEC.
The Daily Chart
On the daily timeframe, BTC has formed a triangle pattern, with almost equal lows NEAR $100,000 and lower highs marking sustained selling pressure. The key trendline support from March remains intact, keeping the price inside the larger ascending channel.
The asset is currently attempting to stabilize near $106K, with the RSI hovering around 51, a neutral level indicating a balanced momentum. If the buyers fail to push above the descending resistance and the $110K supply zone, downside liquidity below $100K may become a target.
The 100 and 200-day moving averages are rising and converging for a bullish crossover, indicating the long-term bullish structure remains intact. However, the fact that BTC has been rejected multiple times from the $110K area makes that zone a critical decision point.
A daily close above it WOULD shift the structure bullish again, while a breakdown below the orange trendline support may accelerate a move toward the lower boundary of the large channel.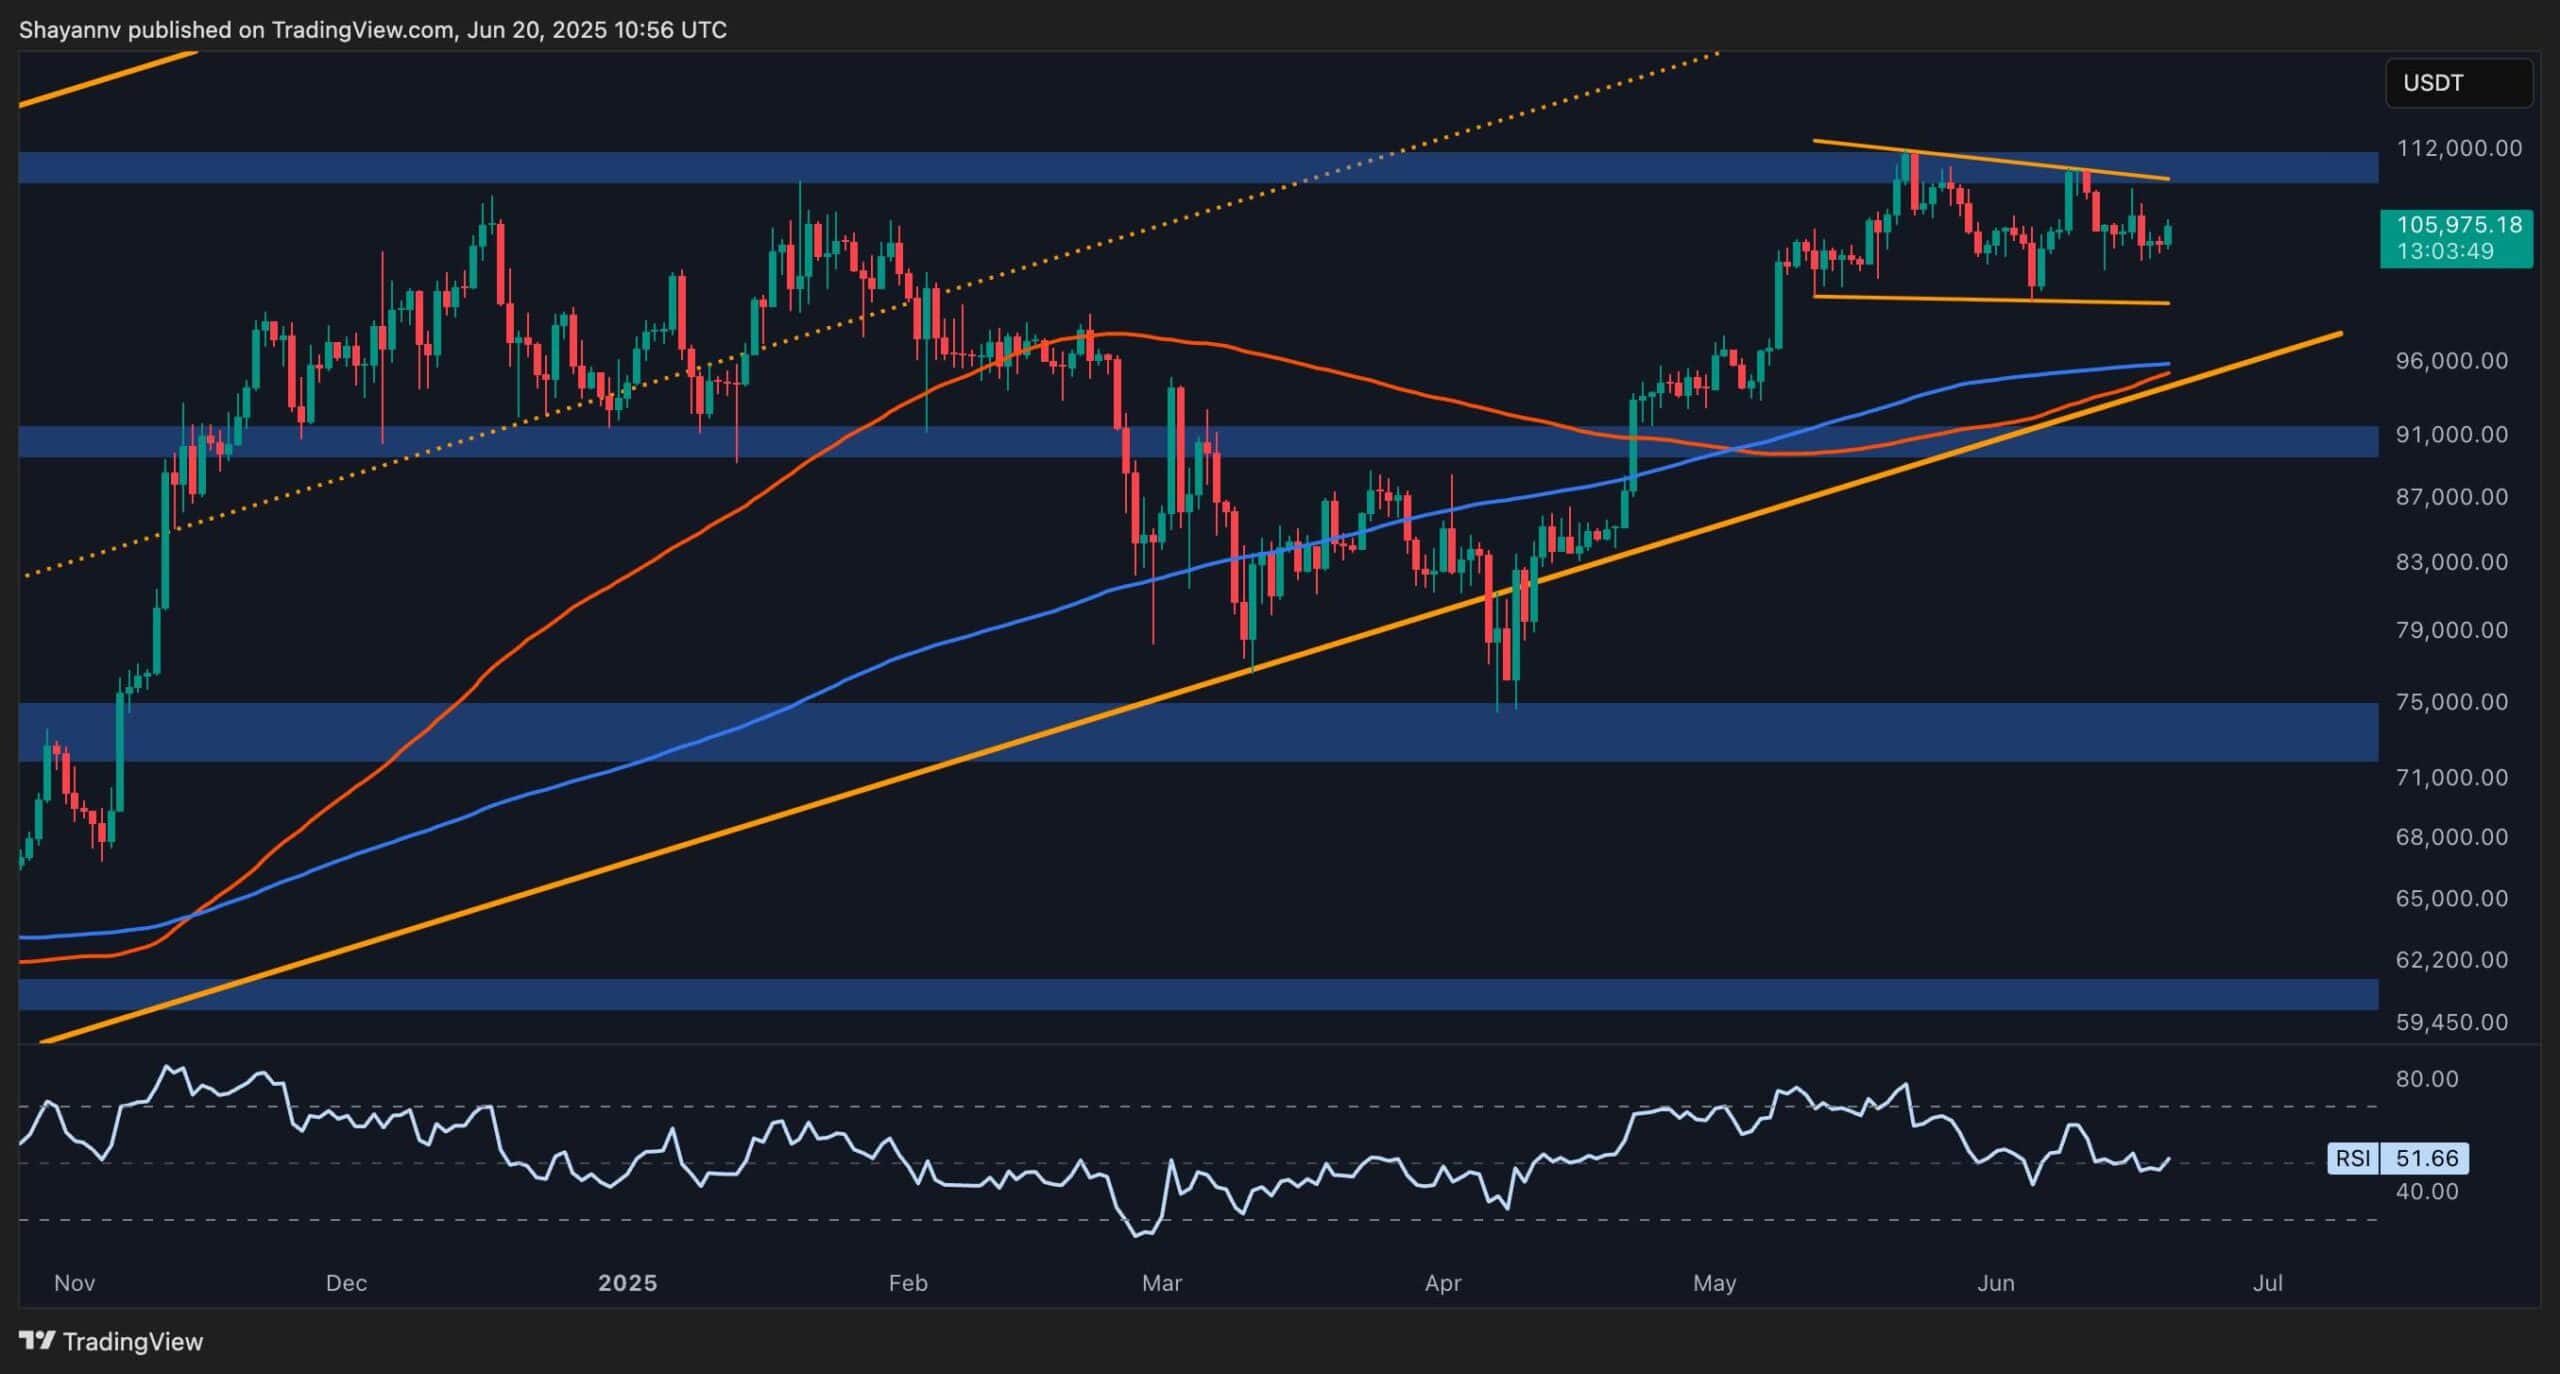
The 4-Hour Chart
In the 4H chart, BTC has rebounded from a local low of $103K, leaving a significant pool of liquidity behind. The price is now pushing back into a fair value gap (FVG) in the $106K zone, which is now acting as a supply barrier. Moreover, the RSI is trending higher at 55, showing mild bullish momentum, but the bearish trendline overhead still caps any impulsive move.
A breakout above the FVG with strong volume could open the path to retest $110K. Otherwise, if sellers defend this area again, we may see a sweep below $103K, aiming for the $102K and even $100K liquidation zones. The short-term structure leans slightly bullish, but the market remains range-bound between liquidity pools.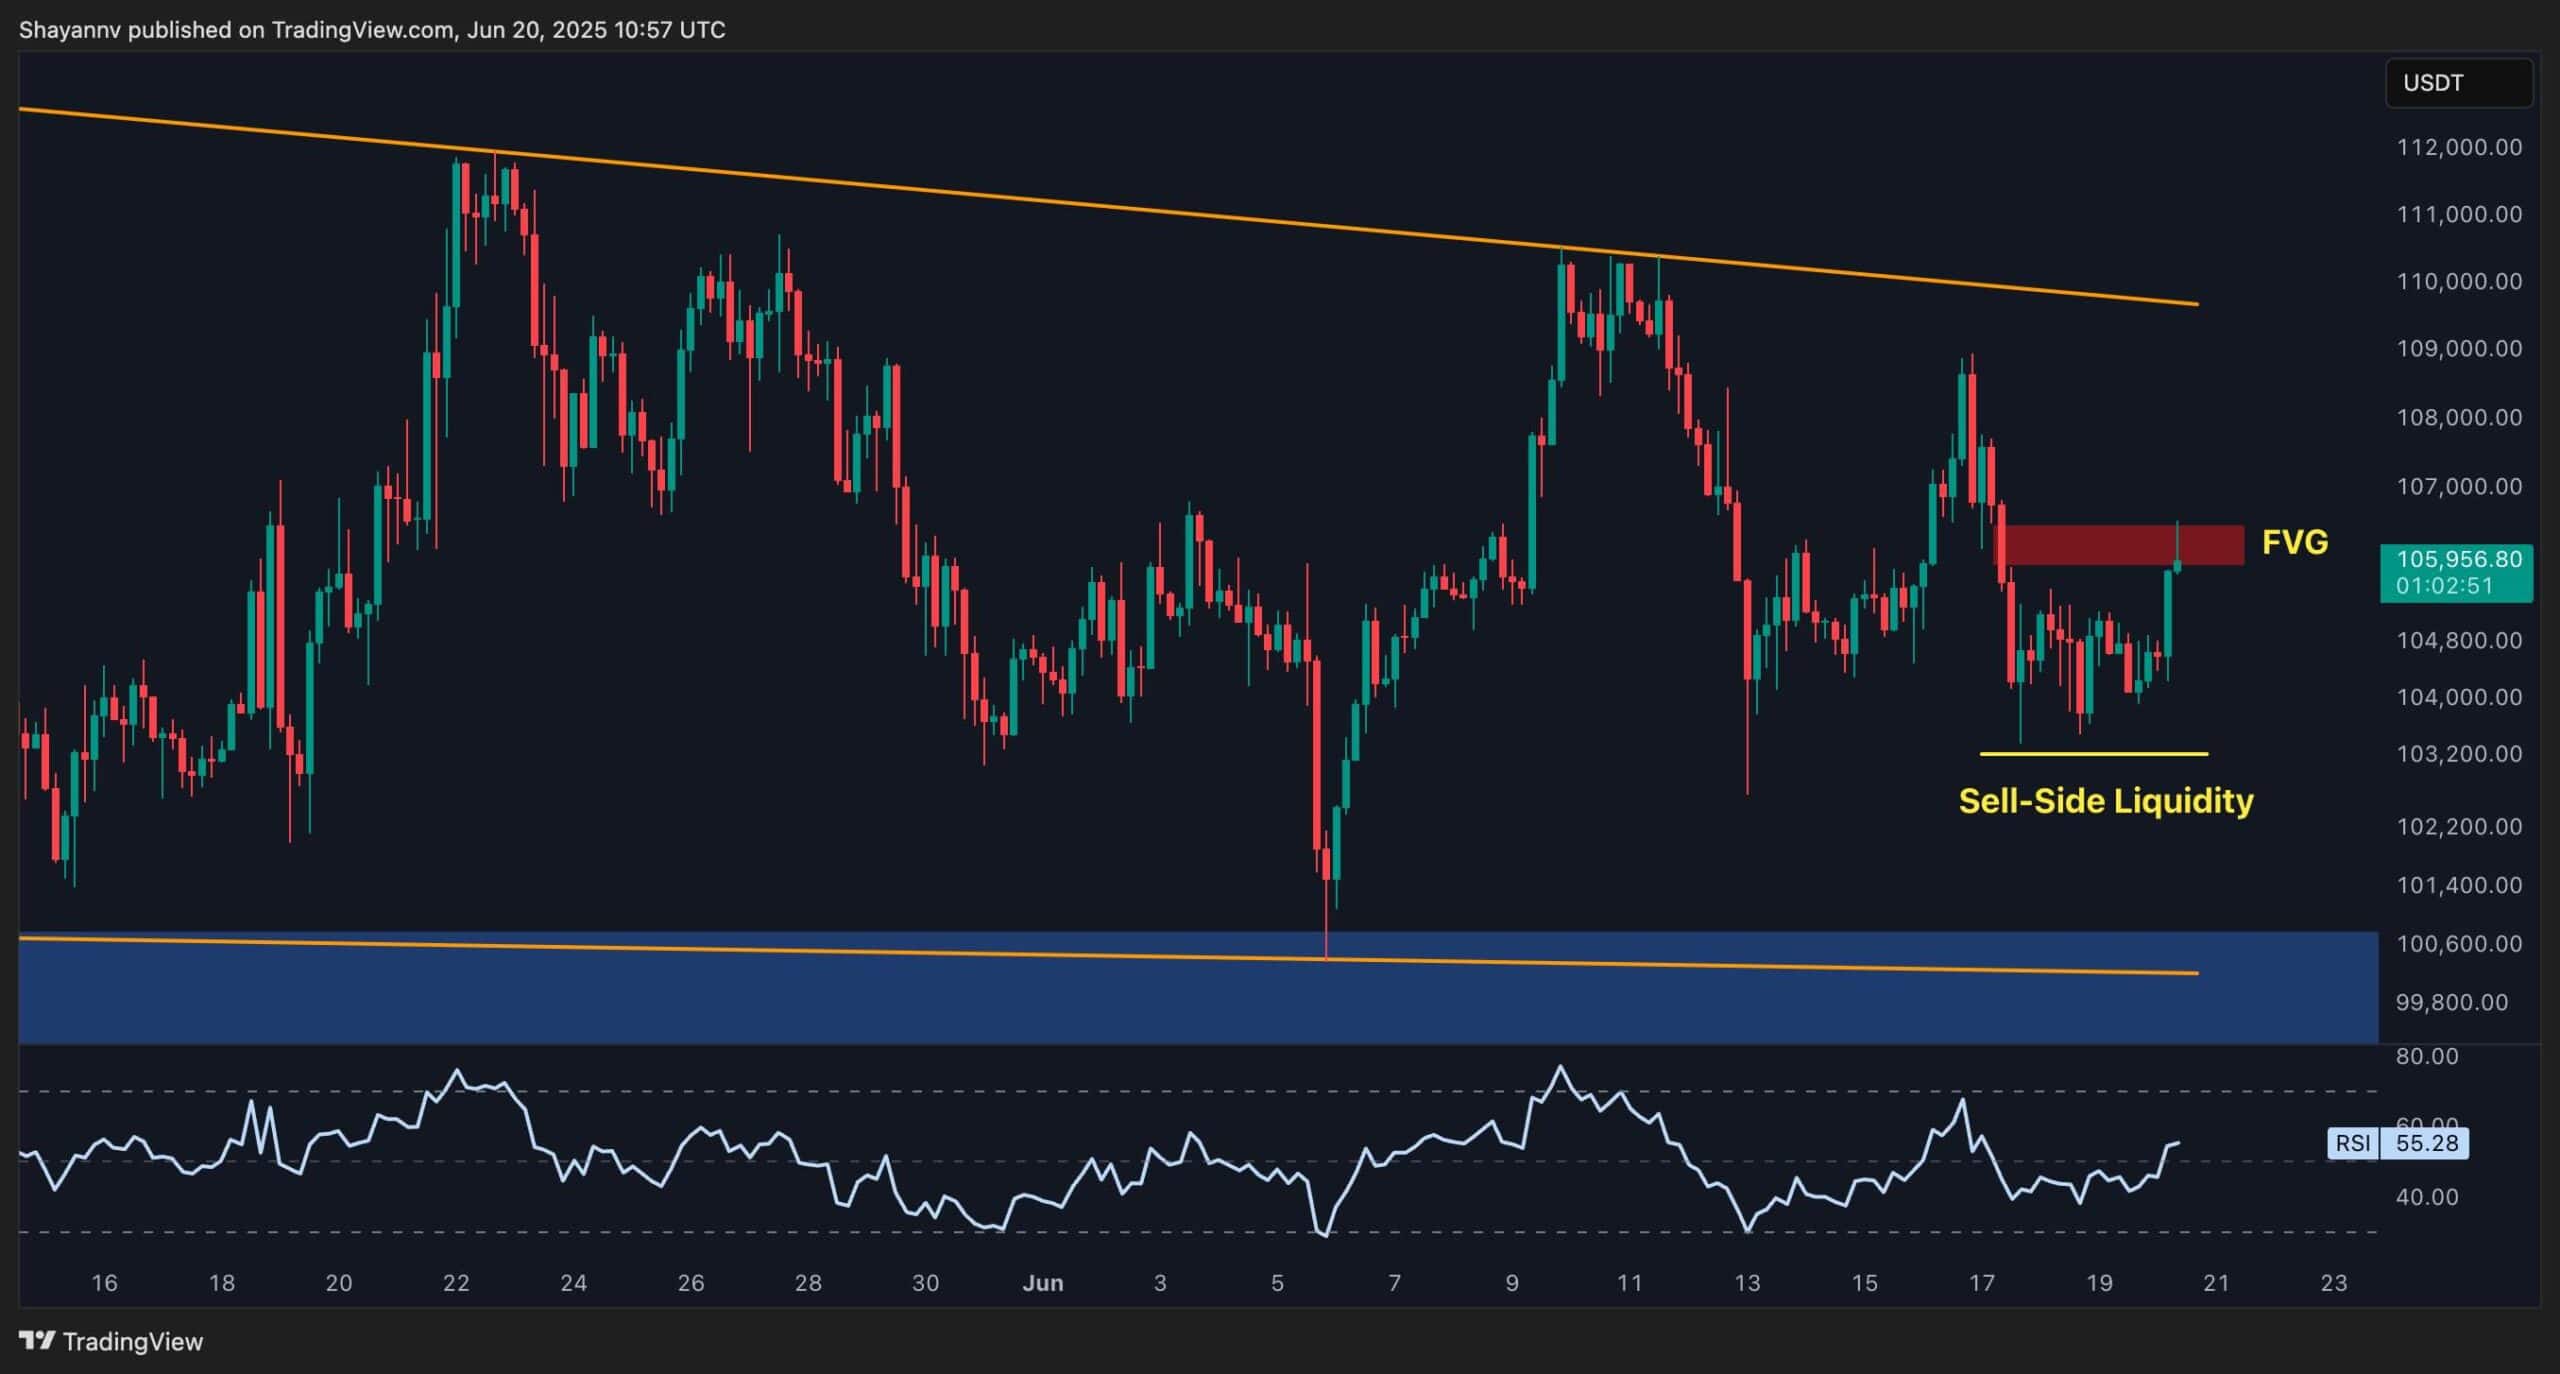
Spot Sentiment Analysis
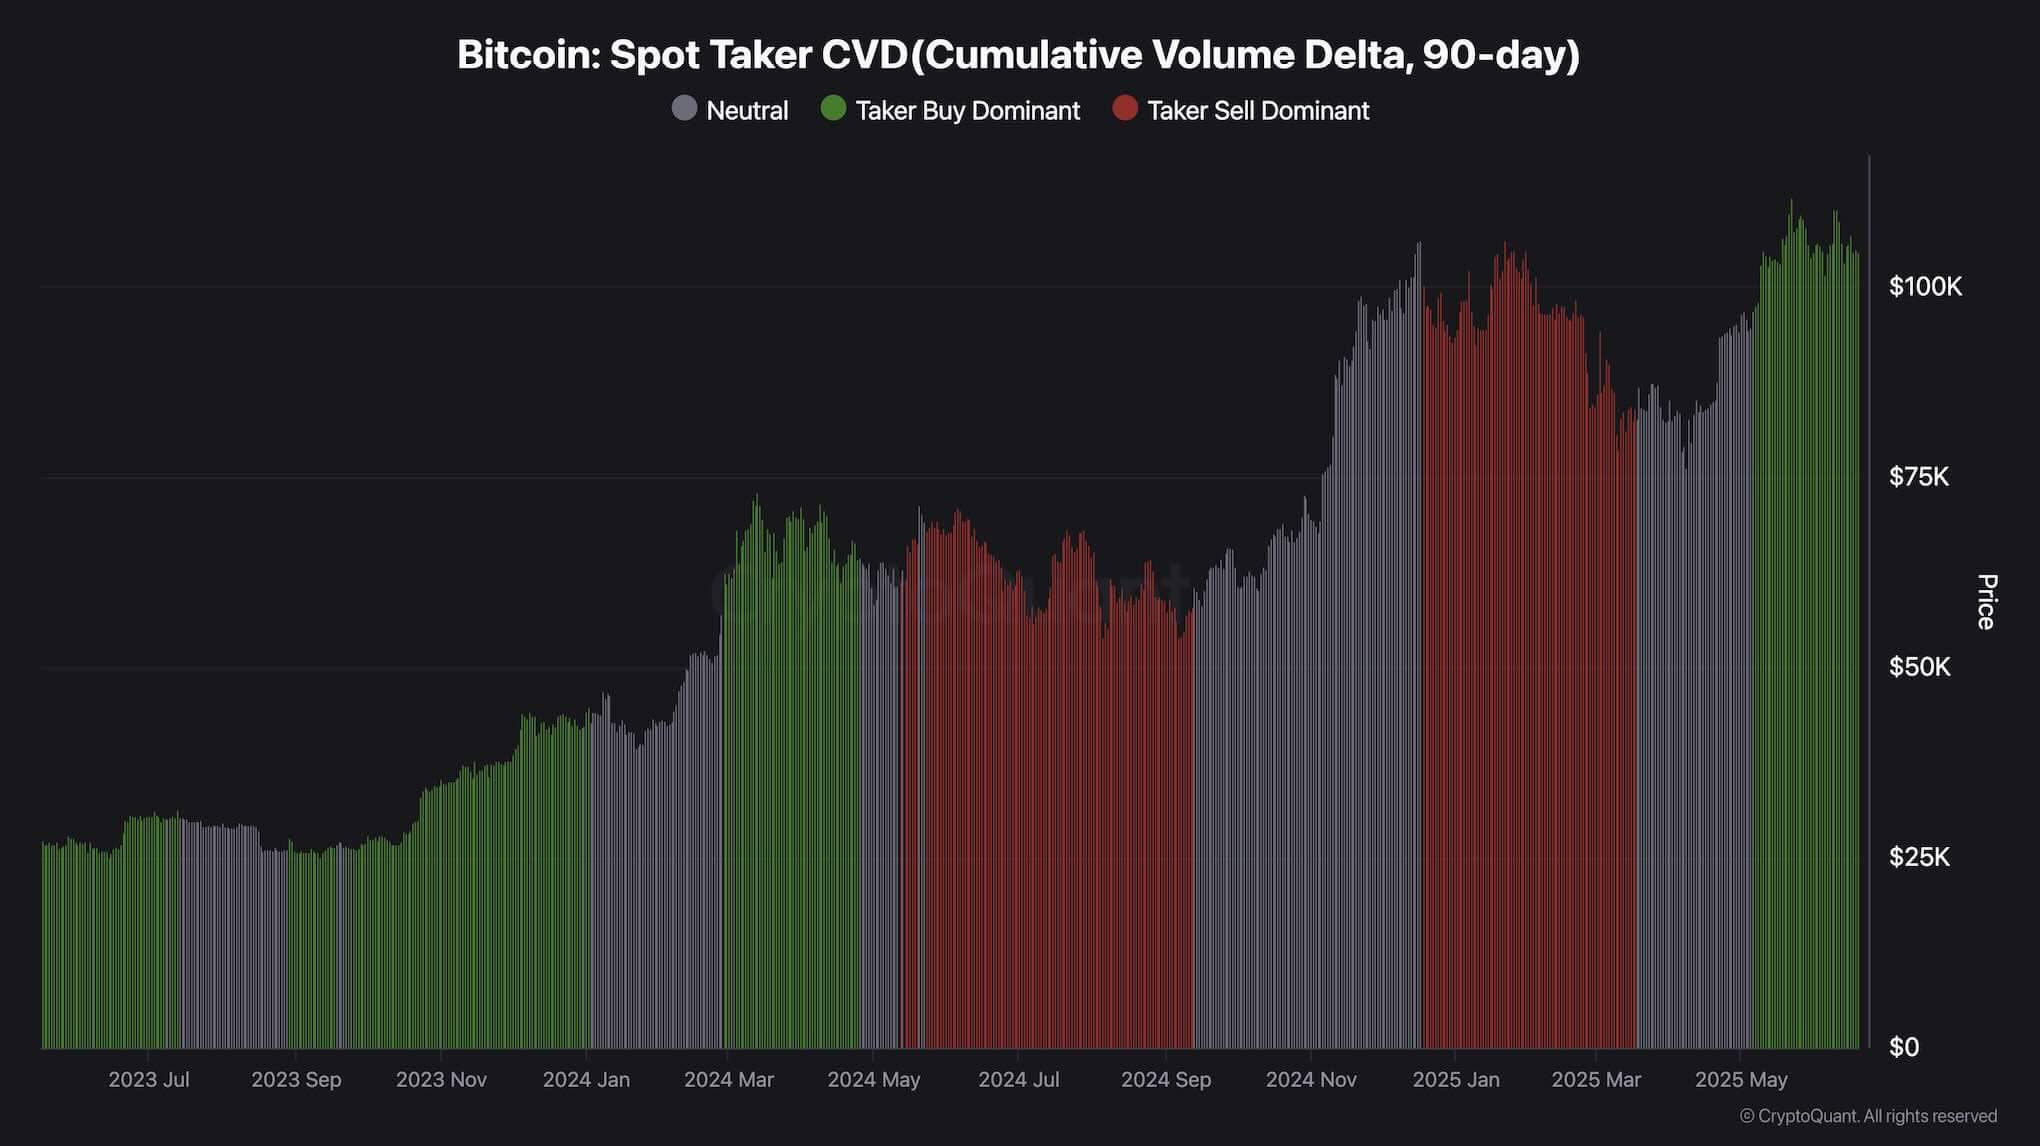
Spot Taker CVD
The Spot Taker CVD chart over the 90-day view shows a return to aggressive buying dominance (green), following a long period of neutral and sell pressure. This shift indicates that market buyers are stepping back in with confidence, absorbing sell orders at current prices. Historically, when CVD flips green after extended red or grey phases, it precedes upward continuation.
This renewed spot demand suggests that large buyers are positioning themselves during this range phase. If this behavior continues while the price holds above key supports, it could lead to a strong breakout. However, if the CVD starts to flatten or turn red again without price advancing, it may indicate exhaustion and foreshadow another sweep of downside liquidity or even a full-blown bearish reversal.