Bitcoin Teeters at the Edge of History—Will It Shatter Its ATH This Week?

Bitcoin''s price action has traders glued to their screens as the king of crypto flirts with its all-time high. The $69,000 psychological barrier isn''t just a number—it''s the line between FOMO and profit-taking pandemonium.
Bullish signals stacking up
On-chain metrics show whales accumulating while retail traders pile into leveraged longs. The last time these stars aligned? Just before the 2021 parabolic rally.Bear traps or breakout fuel?
Short interest on derivatives exchanges keeps climbing—a classic setup for a violent squeeze. Market makers love nothing more than liquidating overleveraged positions in both directions.Meanwhile, traditional finance dinosaurs still can''t decide if BTC is digital gold or a ''speculative asset'' (spoiler: it''s both). The SEC''s predictable foot-dragging on spot ETFs now looks increasingly irrelevant as institutional capital finds backdoor routes into crypto.
One thing''s certain: volatility is coming. Whether you''re stacking sats or shorting the top, buckle up—this next move could define Bitcoin''s narrative for years.
Technical Analysis
By ShayanMarkets
The Daily Chart
BTC has recently swept a critical liquidity zone just around the $100K mark, triggering a strong, impulsive rally that reflects significant demand entering the market. This surge has propelled the price to its all-time high of $111K, signaling renewed bullish momentum.
A key area of buy-side liquidity lies just above the $111K ATH, making it an attractive target for institutional and “smart money” participants. If bullish momentum holds and buyers manage to breach this level, a sharp MOVE higher, potentially driven by a short squeeze, could follow.
However, this zone also overlaps with a likely area of profit-taking and increased supply, which may temporarily slow or cap upward momentum. While a bullish breakout appears imminent, a minor pullback or short-term correction cannot be ruled out. At present, BTC remains range-bound between $100K and $111K, with the breakout direction likely determining the next macro trend.
The 4-Hour Chart
On the lower timeframe, Bitcoin has seen a strong influx of buyers around the $100K level, leading to a breakout above a recently formed bullish flag pattern. This breakout confirms the continuation of the upward trend.
Currently, the price action is approaching a 4-hour Order Block, a key area where supply is expected to re-enter the market. If bulls can reclaim this zone and sustain momentum, BTC could make a swift move toward price discovery and a new ATH.
That said, a short-term rejection or a pullback to retest the breakout level is still a viable scenario before the next leg up. For now, bitcoin is consolidating within a tighter $105K–$111K range on the 4-hour chart. This consolidation phase could serve as a launchpad for the next impulsive rally.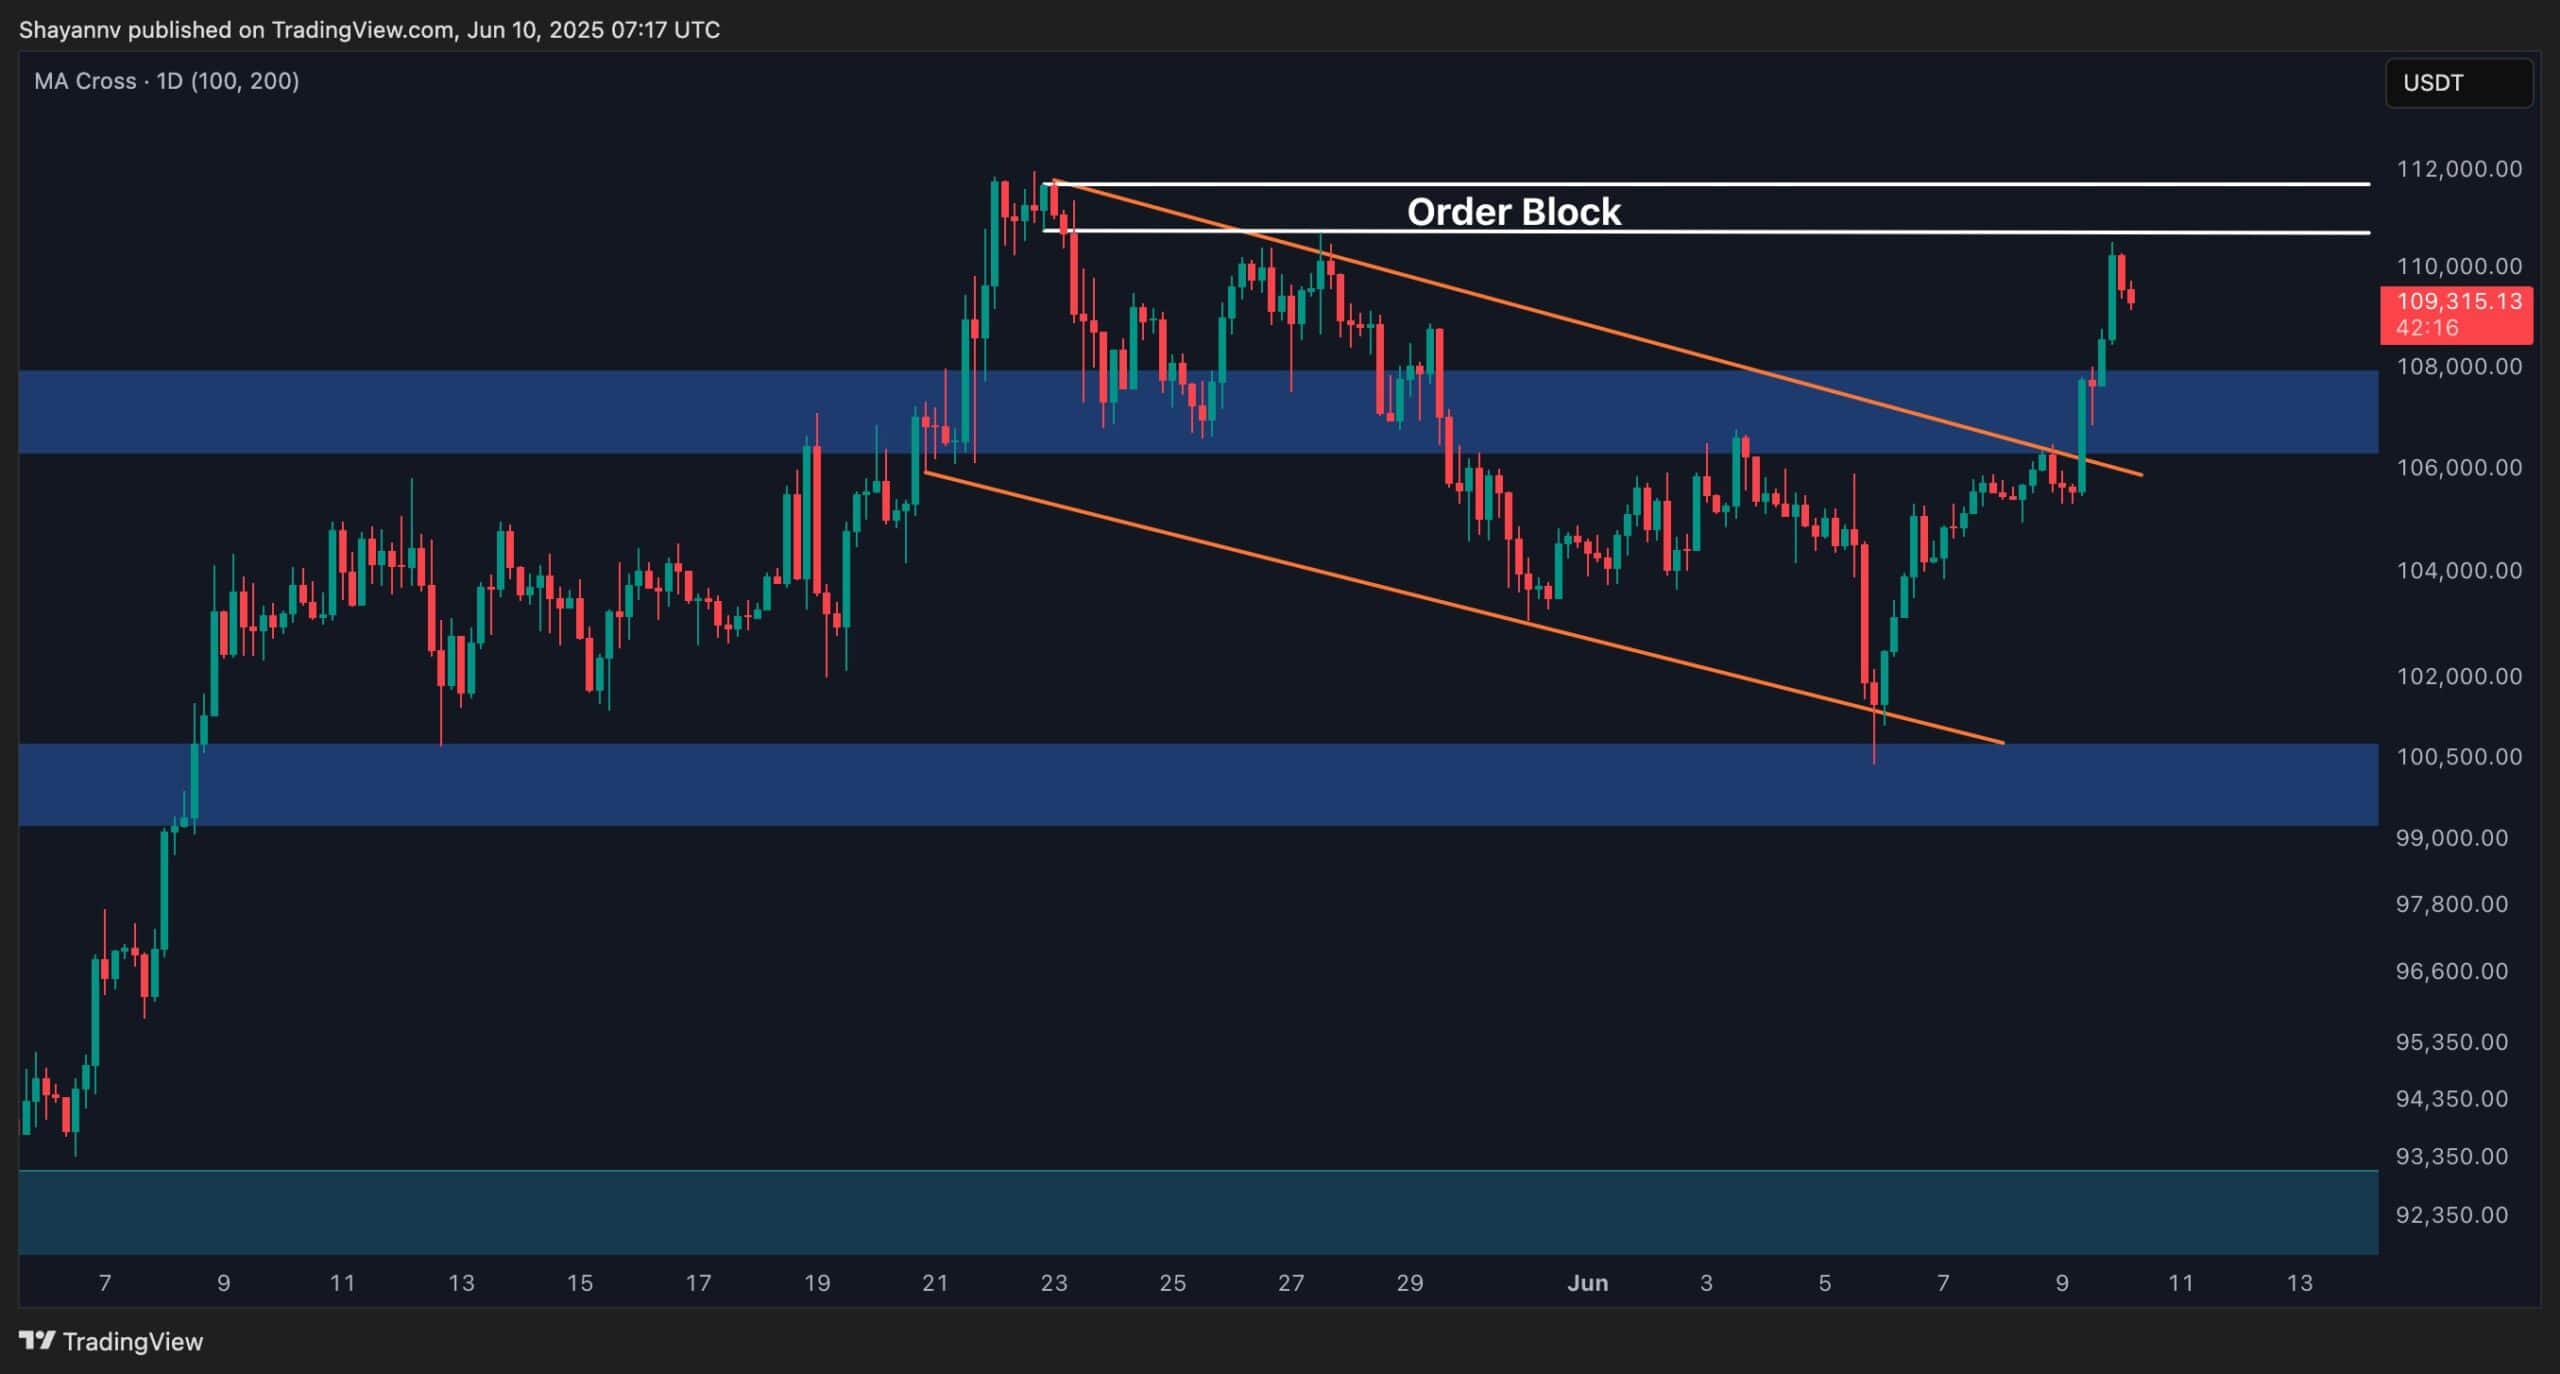
On-chain Analysis
By ShayanMarkets
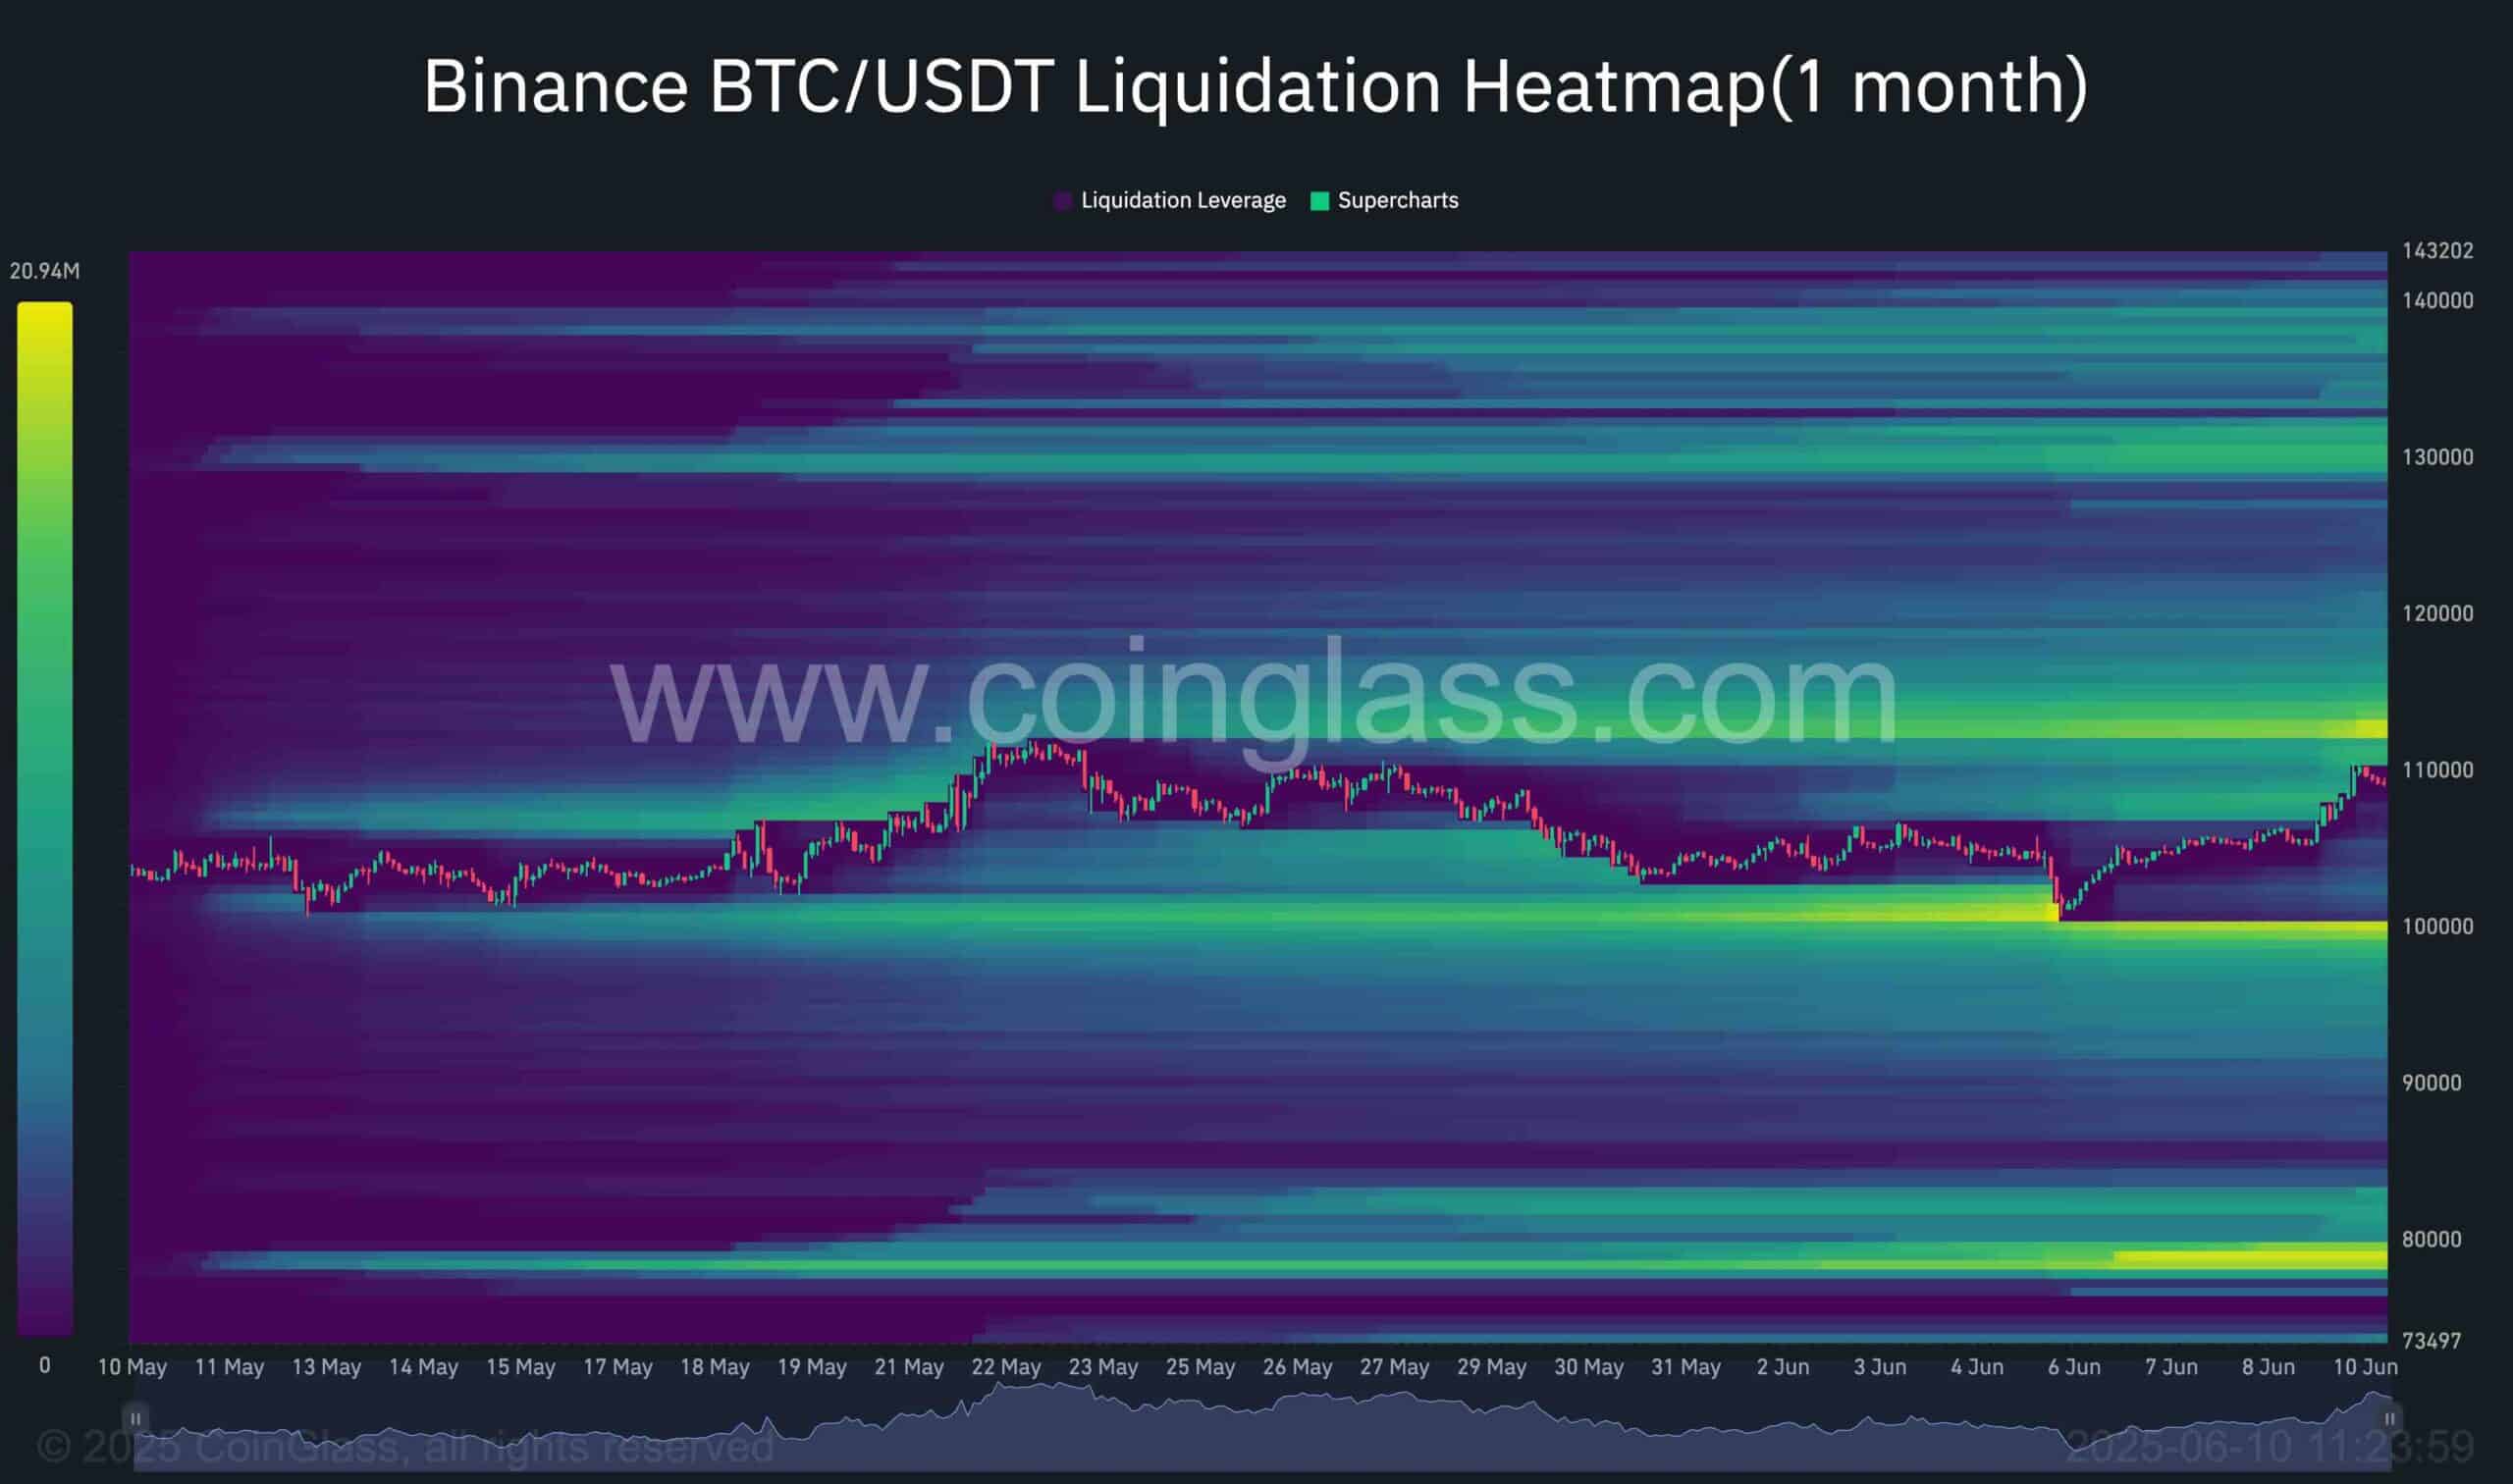
As Bitcoin hovers just below its all-time high of $111K, a closer look at futures market data, particularly the BTC/USDT liquidation heatmap on Binance, offers critical insights into potential price movements.
It reveals two major liquidity clusters: one positioned above the $111K level and another just below $100K. These zones are situated NEAR the current price and represent prime areas where smart money may aim to trigger liquidations of overleveraged retail positions. A decisive move beyond either threshold could ignite a liquidation cascade, accelerating price action in that direction.
Given the prevailing bullish sentiment and broader market structure, a breakout above the $111K resistance appears increasingly likely in the mid-term. Such a move would not only confirm market strength but could also fuel momentum toward a fresh all-time high.