Ripple Price Analysis: XRP at Critical Make-or-Break Level Under Intense Pressure

XRP teeters on the edge as mounting pressure threatens to shatter key support levels.
The Breaking Point
Ripple's native token faces its most crucial test in months, trading at levels that could determine its trajectory for the remainder of the quarter. Market forces converge like storm clouds, leaving traders watching every tick with heightened intensity.
Technical Pressure Cooker
Chart patterns scream tension as XRP battles against converging trendlines. The token dances along support zones that have held firm for weeks—but even the strongest foundations crack under sufficient strain. Volume indicators suggest something's brewing beneath the surface.
Market Forces Collide
Regulatory whispers and institutional positioning create competing currents that pull XRP in opposite directions. The digital asset finds itself caught between traditional finance skepticism and blockchain innovation optimism—a familiar position for cryptocurrencies that somehow still surprises Wall Street analysts who should know better by now.
This isn't just another price fluctuation—it's a defining moment that separates strategic accumulation from panic selling. The coming sessions will reveal whether XRP maintains its structural integrity or joins the growing list of 'promising projects' that couldn't withstand real pressure.
Technical Analysis
By Shayan
The USDT Pair
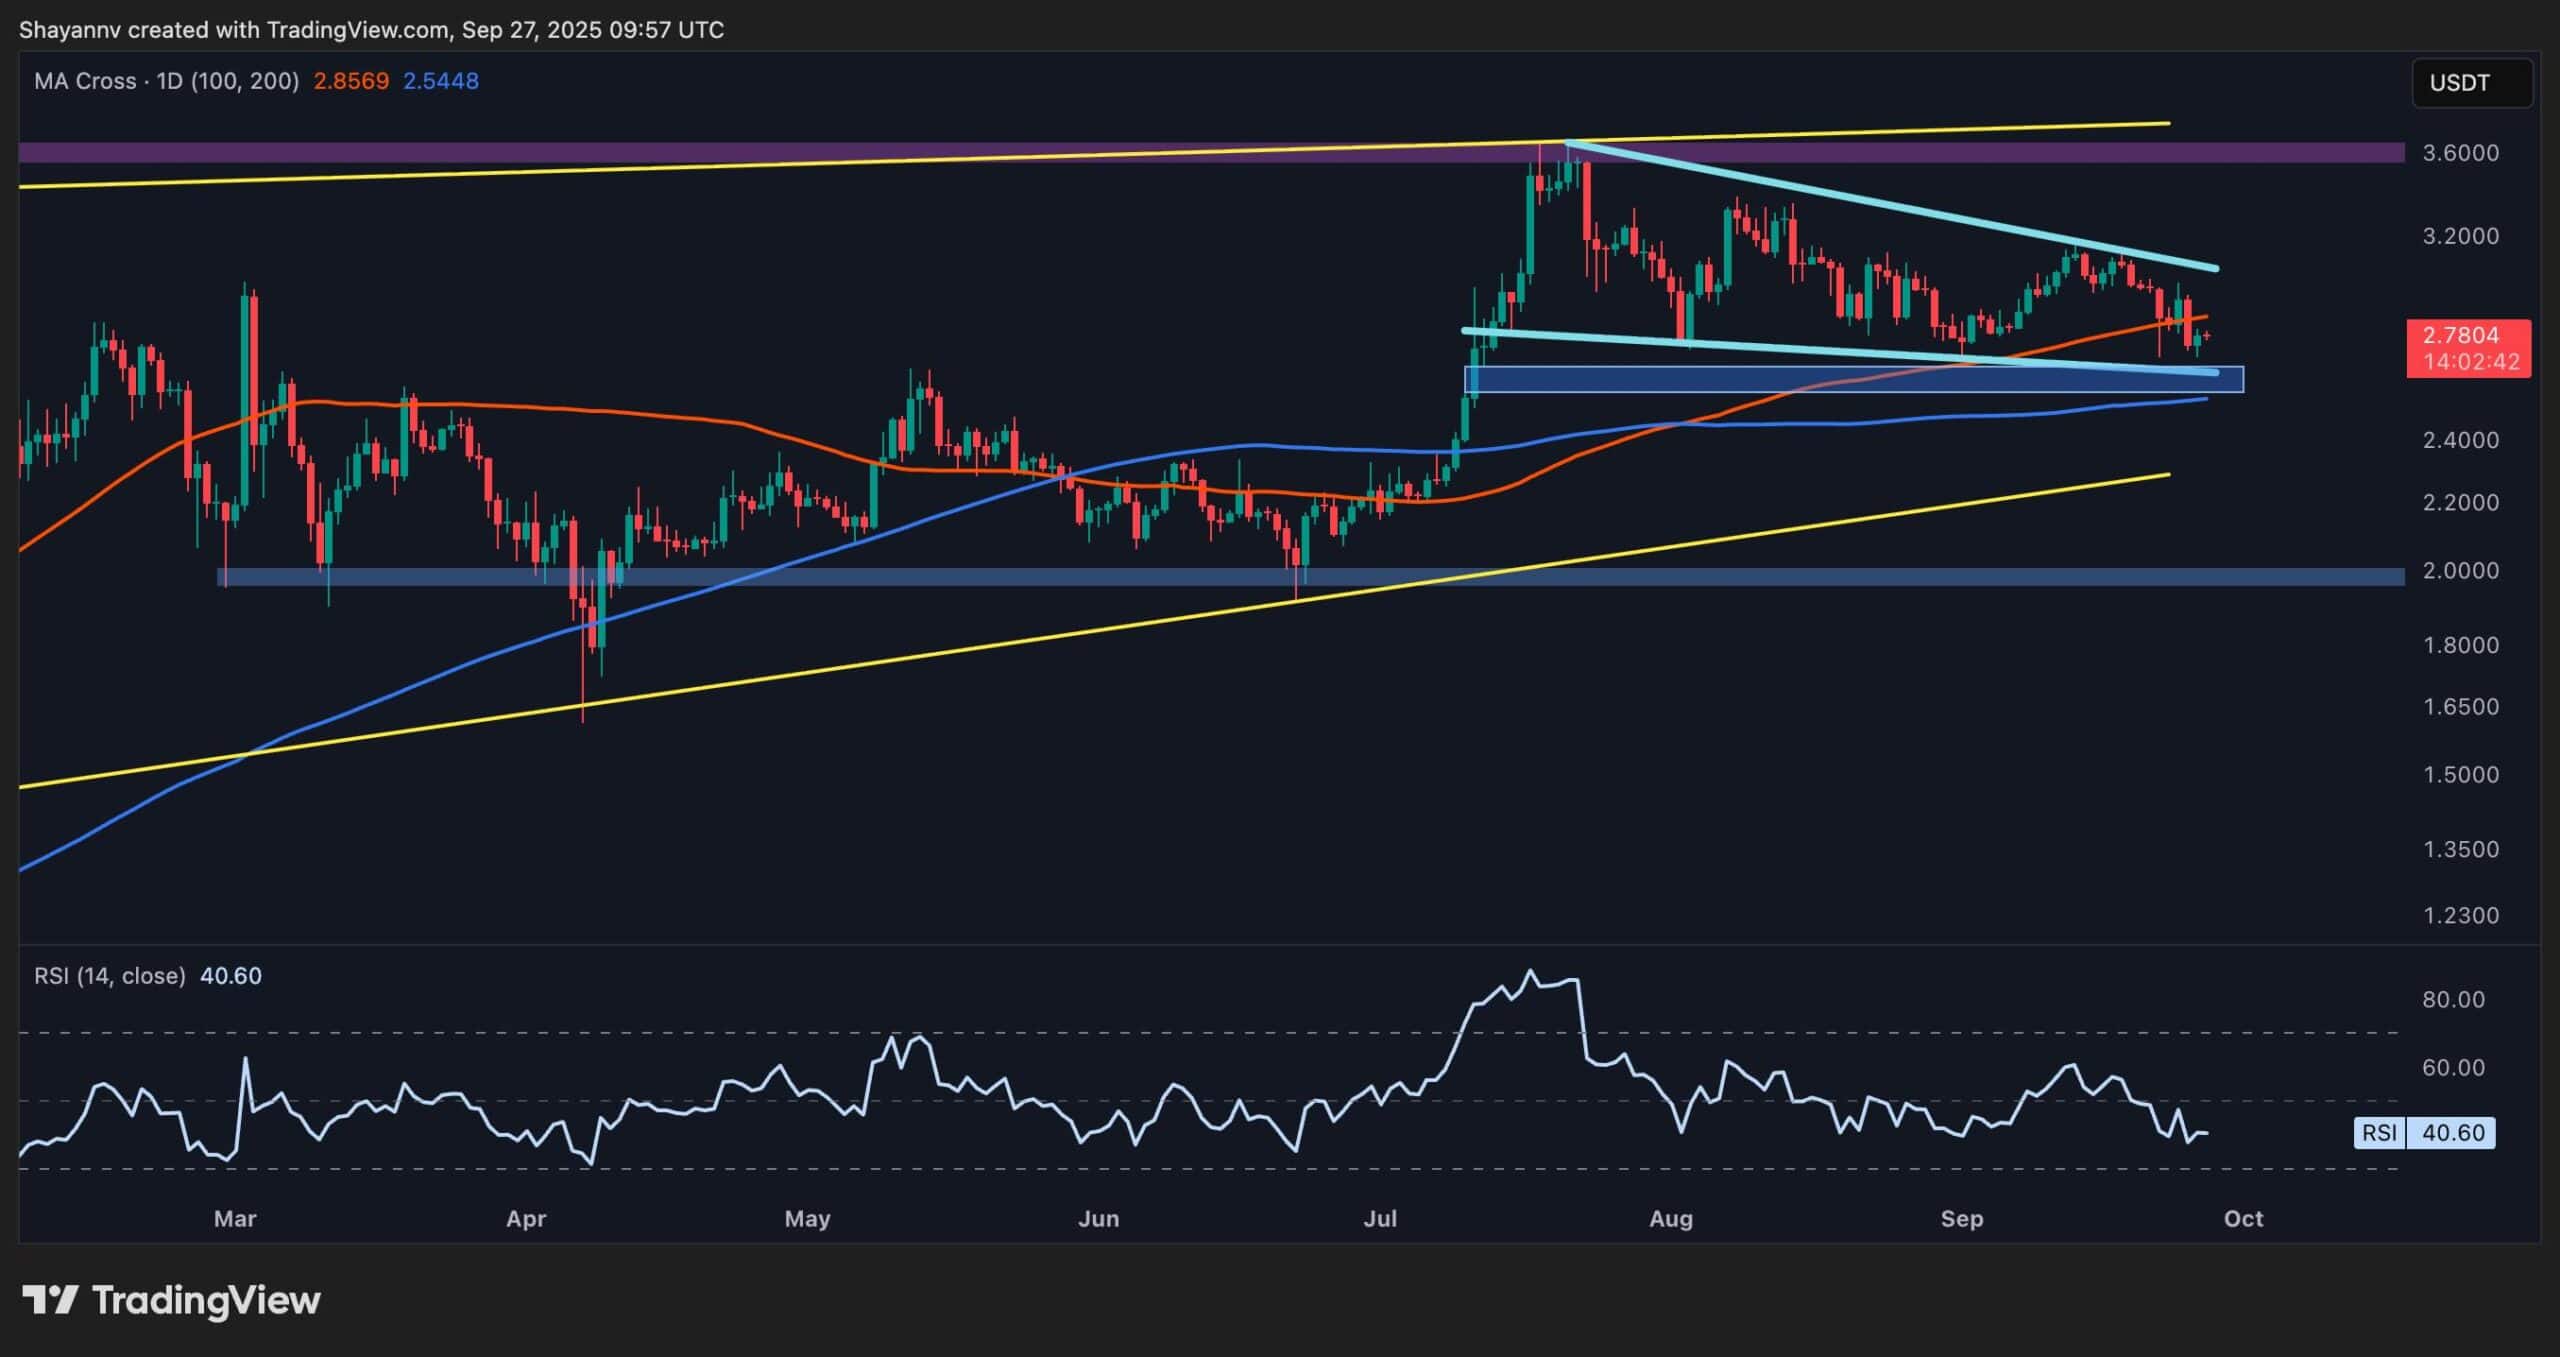
XRP has remained within a falling wedge structure, as the asset recently slipped below the 100-day moving average. The recent low at $2.75 is being tested again, and just below lies a more critical demand zone around $2.60, backed by the 200-day moving average, which is just below this area. This confluence makes it a make-or-break level for the buyers.
If this area holds, we could see a bounce and a potential challenge of the wedge’s upper boundary near $3.10. A breakout from the wedge WOULD open the door toward the key $3.60 level. But if the support gives out, XRP could decline to the $2.20 zone, which aligns with the lower boundary of the large ascending structure.
The BTC Pair
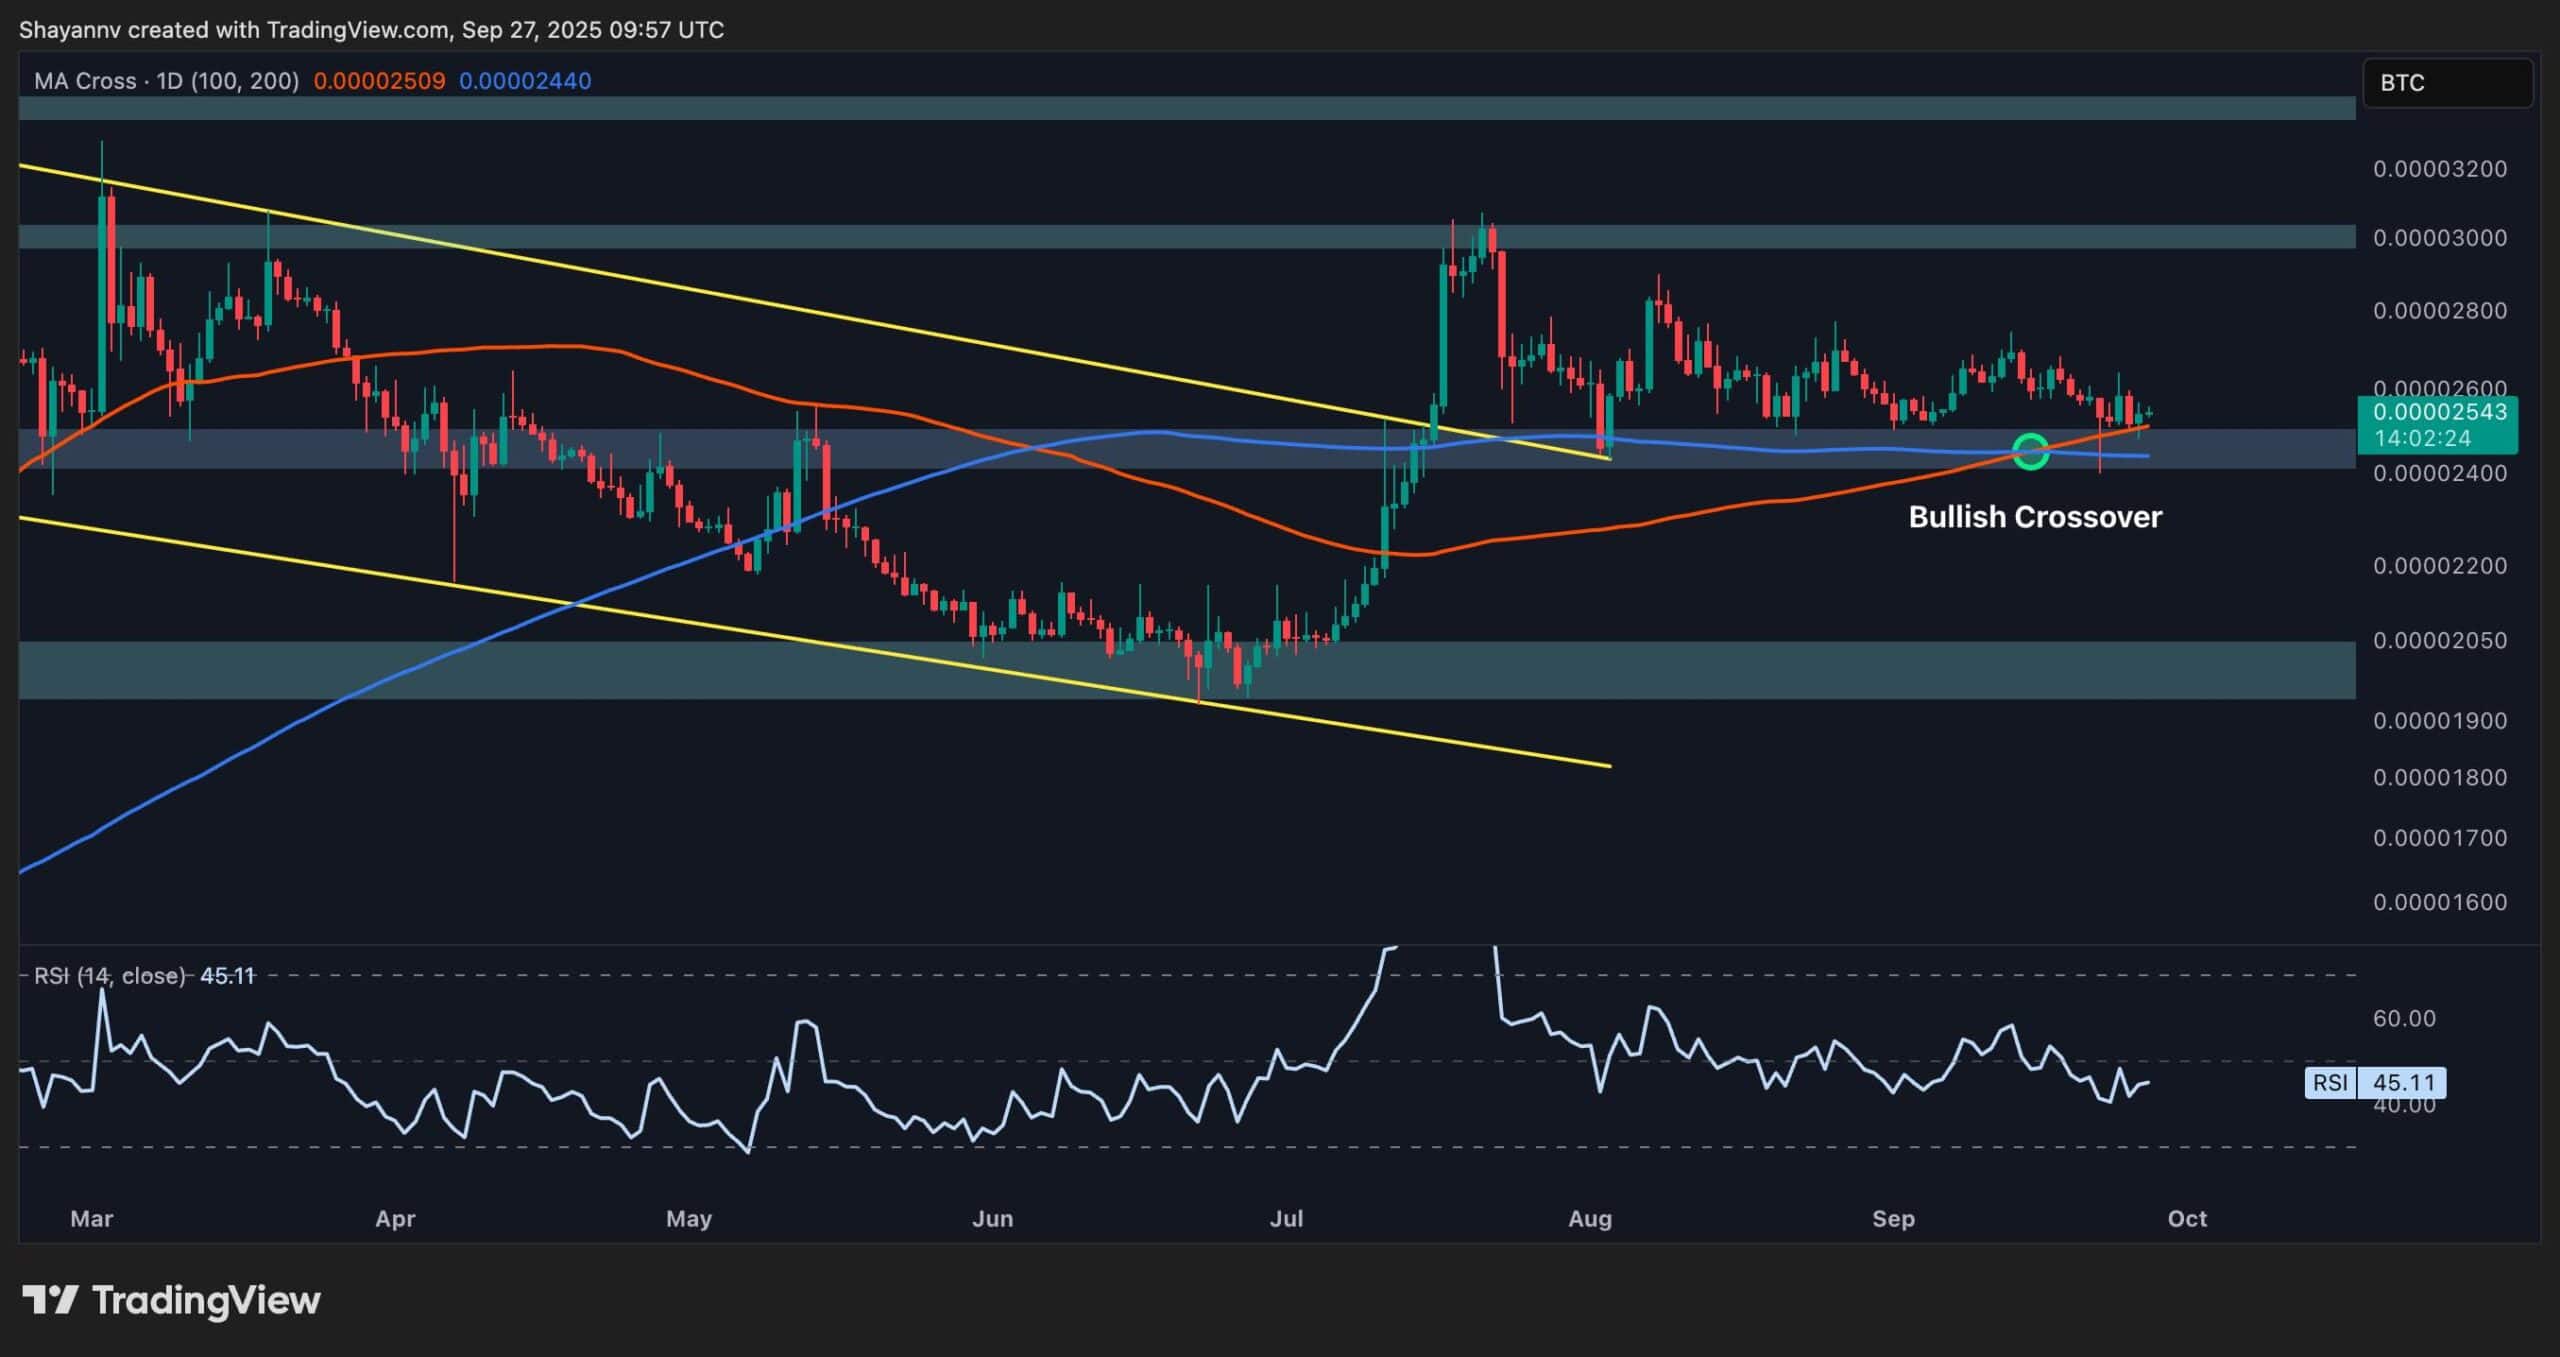
Moving on to the XRP/BTC chart, a bullish golden cross has occurred recently, as the 100-day MA pushed above the 200-day MA, but the asset hasn’t followed through yet. After a strong rally in July, the price has been moving sideways just above the 2,400 SAT support.
The consolidation above both MAs suggests underlying strength, but the buyers need to hold the 2,400 SAT zone to prevent a deeper pullback. A clean break above the 2,800 SAT zone, which aligns with recent consolidation highs, could kick off the next leg higher, targeting the 3,000 SAT region once again.
Otherwise, losing support may drag the pair toward the 2,000 SAT zone, shifting the overall market structure bearish. As a result, the 2,400 SAT zone remains a critical level for the investors to defend in the short term.