Dogecoin’s (DOGE) Monthly RSI Signals Another Massive Move Ahead

Dogecoin's technical setup flashes bullish as monthly RSI patterns hint at significant price action brewing.
RSI Patterns Scream Volatility
The Relative Strength Index on DOGE's monthly chart mirrors historical formations that preceded previous explosive movements. Traders tracking momentum indicators spot familiar alignment—suggesting the meme coin might be gearing up for another trademark surge.
Technical Alignment Points to Big Swings
When Dogecoin's monthly RSI hits these specific levels, history shows it doesn't just whisper—it shouts. The current configuration bypasses traditional analysis, cutting straight to what crypto veterans recognize as accumulation territory.
Market Watchers Brace for Impact
While fundamental analysts debate utility and institutional adoption, the charts tell their own story. This technical setup often precedes moves that leave both skeptics and enthusiasts scrambling—proving once again that in crypto, sometimes the best fundamental analysis is watching what the market actually does rather than what Wall Street predicts.
Another Dogecoin rollercoaster appears to be loading up—because nothing says 'sound investment strategy' like a meme coin that moves when technical indicators align and Elon Musk tweets.
Monthly RSI Structure Points to Defined Market Phases
Dogecoin (DOGE) is showing a clear long-term pattern based on its monthly Relative Strength Index (RSI), according to analyst Trader Tardigrade. The chart separates the market into three stages: Accumulating, Hodling, and Selling zones.
Notably, the Accumulating zone appears when RSI is low, which has historically aligned with quiet price action and long periods of sideways trading. This was seen before major rallies in 2017 and 2021. The Hodling zone follows, where RSI begins to climb, and price momentum starts to build. The final phase is the Selling zone, reached when RSI spikes to extreme levels.
Historical data indicate that this area typically marks the peak of Doge cycles. At the moment, RSI is rising but still below the Selling zone. Trader Tardigrade stated,
$Doge/monthly#Dogecoin monthly RSI offers a simple strategy:
– Buy in the Accumulating zone
– Hodl in the Hodling zone
– Sell only in the Selling zone
I just want to say:
Don’t sell any of your DOGE before the RSI reaches the Selling zone. pic.twitter.com/EXZxb1JUeV
— Trader Tardigrade (@TATrader_Alan) September 26, 2025
This suggests that the current structure may still have room to MOVE upward.
Price Action Repeats Earlier Breakout Pattern
A separate chart from the same analyst shows that DOGE may be repeating the price structure last seen between 2015 and 2017. In that cycle, the asset formed a base, broke above key resistance, and entered a strong trend. The 2025 breakout appears to be developing in a similar way, with resistance levels and pattern shape closely matching the earlier cycle.
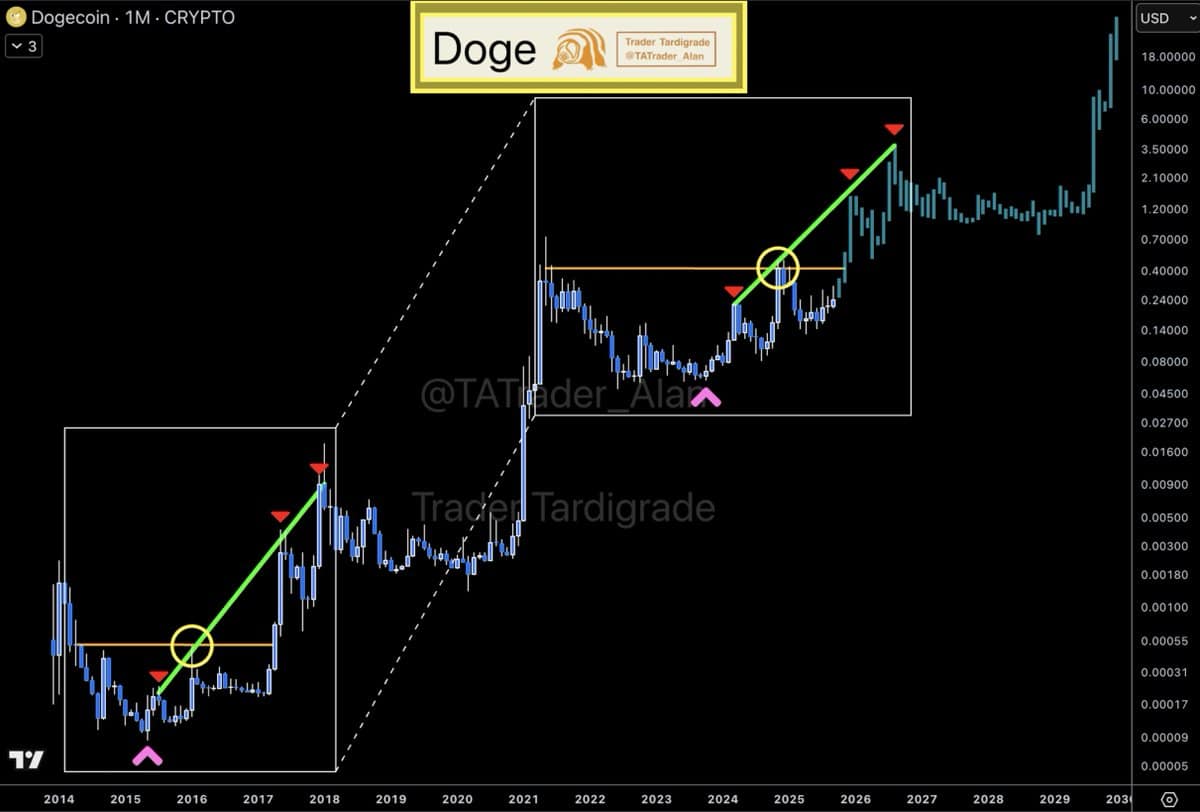
DOGE was trading at $0.22 at press time. It has declined 4% in the past 24 hours and 19% over the last seven days. Daily trading volume is over $3.83 billion.
Support at $0.22 Remains Important for Short-Term Setup
Analyst Ali Martinez shared a daily chart showing DOGE inside a rising triangle. The lower trendline of the structure is NEAR $0.22, which also matches the 0.618 Fibonacci level at $0.2288. According to Ali Martinez,
Dogecoin $DOGE must hold $0.22 for a potential rebound to the triangle’s x-axis at $0.29! pic.twitter.com/ZhgcCMAjue
— Ali (@ali_charts) September 26, 2025
The chart outlines a possible consolidation within the triangle, followed by an upward move if support holds. A drop below $0.22 could open the way for further losses toward $0.20 or $0.19.
Structure Holds, But Needs Higher Lows to Continue
Daan crypto Trades pointed out that DOGE has moved steadily upward since April 2025, forming higher highs and higher lows. He noted that this has not been a smooth trend, but it remains intact. The price is currently above both the daily 200-day EMA at $0.22 and the 200-day MA at $0.20, which are key levels to maintain.
I think $DOGE summarizes the market pretty well the past few months.
Yes, most coins are up since the April lows, especially the majors. But as you can see, it is moving up very slowly making marginally higher highs and higher lows.
Technically this is an up trend but it… pic.twitter.com/k70Hs1WQQS
— Daan Crypto Trades (@DaanCrypto) September 26, 2025
While gains have been limited, the trend remains positive as long as current support holds.
