Buy the Dip? ETH Hits Key Support as Q4 Rally Looms - Don’t Miss the Rebound

Ethereum finds its footing at critical support levels as traders position for fourth-quarter momentum.
Technical Breakthrough or False Hope?
The smart contract giant bounces off make-or-break territory that historically precedes significant moves. Market watchers eye the charts as ETH tests levels that could determine its trajectory through year-end.
Seasonal Patterns Favor Bulls
Historical data shows cryptocurrencies often rally during final quarter trading. Institutional accumulation patterns suggest smart money anticipates traditional year-end flows into digital assets.
Defi Ecosystem Shows Resilience
Despite recent volatility, Ethereum's network activity maintains steady growth. NFT volumes tick upward while layer-2 solutions continue eating into mainnet congestion - though gas fees remain a persistent headache for retail traders.
Wall Street's Cautious Dance
Traditional finance giants keep one foot in and one foot out, simultaneously launching ETH ETFs while warning clients about regulatory uncertainty. Because nothing says 'confident investment' like hedging every statement with three pages of risk disclosures.
The moment of truth approaches for Ethereum. Either this support holds and fuels the next leg up, or we're in for another round of 'crypto winter' conversations at holiday parties.
Pullback Tests Support as Compression Builds
Ethereum (ETH) is trading NEAR $4,200 after a sharp decline from recent highs close to $4,950. The correction puts the asset down nearly 20% from its peak. Despite the drop, some market participants are watching key price levels as potential areas of interest.
Michaël van de Poppe, a market analyst, notes that ethereum may enter a sideways period. He points out that the 20-week moving average is now approaching the price, and compression is forming.
He stated, “I don’t know whether we’ll dip as deep as $3,550–$3,750,” leaving open the possibility for a MOVE into that range but not confirming it. The zone between $3,550 and $3,750 is marked as potential support, close to the rising 20-week MA.
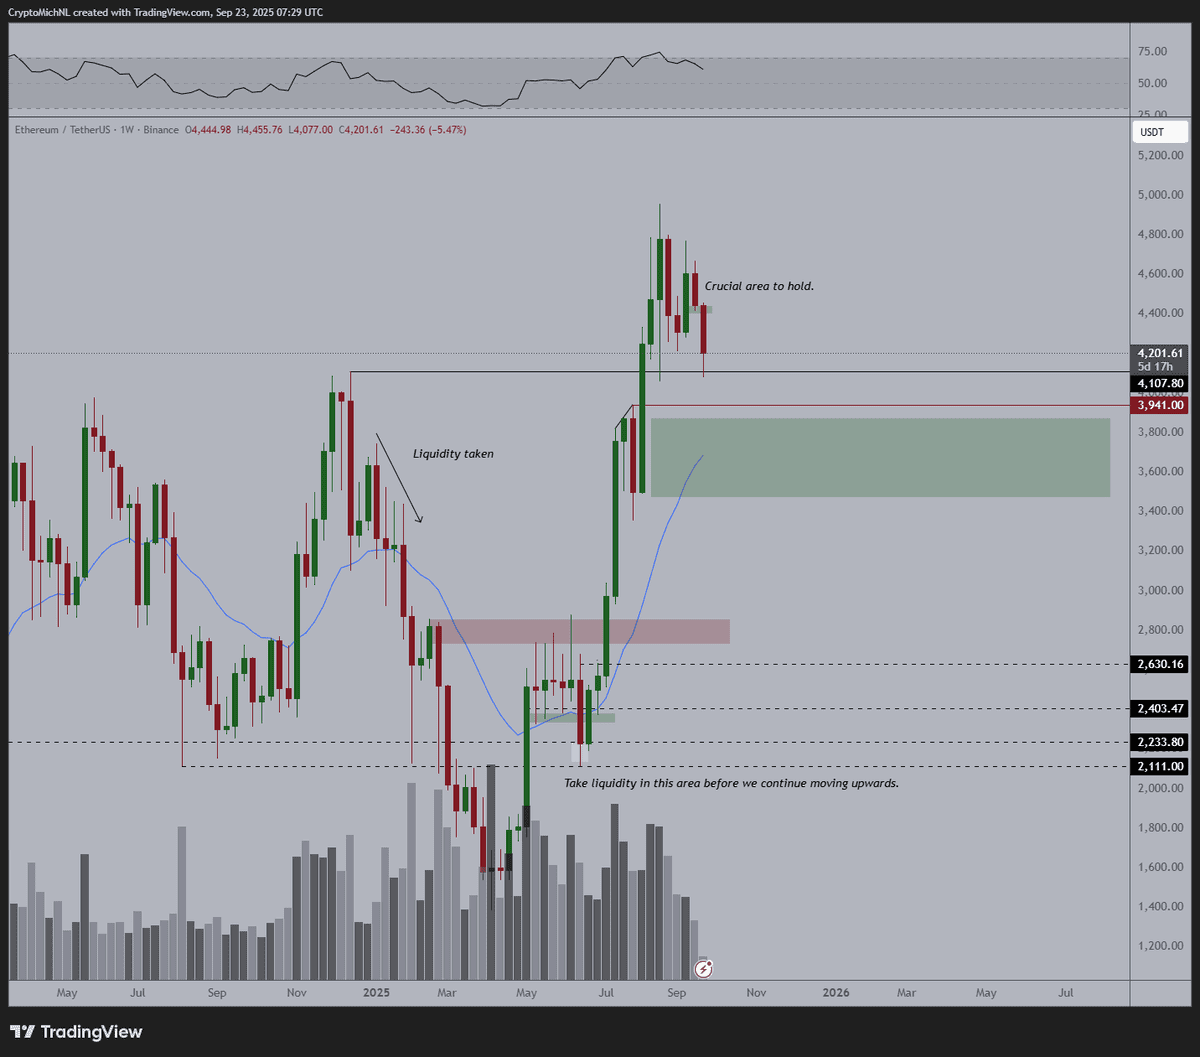
On the weekly timeframe chart, ETH’s price keeps holding above $4,100 as a critical zone. Just below lies a wider support area that rests between $3,550 and $3,750, aligning with a former breakout area and the 20-week moving average. A green support box also appears lower on the chart as a historical consolidation area around $2,800.
Past moves show that ETH has responded to these levels. Labels such as “liquidity taken” at $3,900 and “take liquidity in this area” near $2,800 suggest that if the price revisits those levels, reactions could follow. Lower volume in recent weeks supports the idea that price may be preparing for a more directional move.
Chart Structures Point to a Setup
Another pattern on the chart comes from Trader Tardigrade, who points to a falling wedge. The setup is clear, with the asset trending within two downward lines. The falling wedge is near its apex, and the price is testing previous breakout levels. The chart includes a possible move toward $6,800 if it breaks above the wedge.
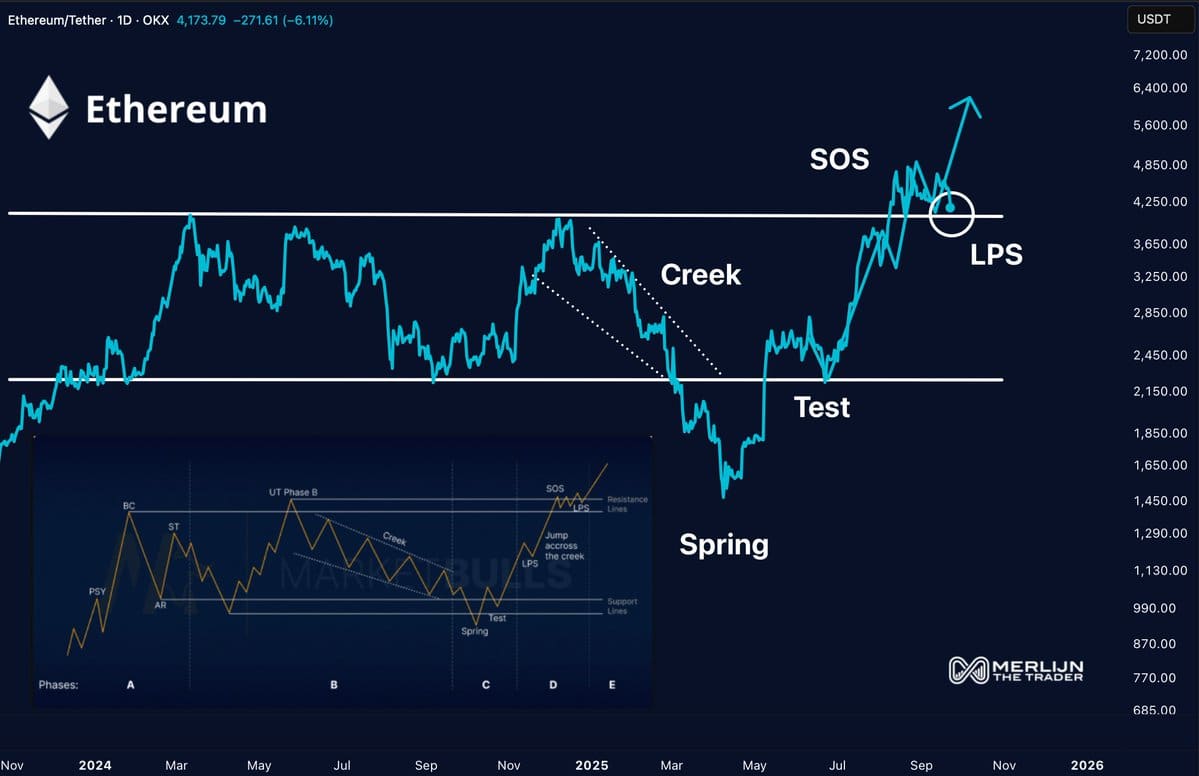
Separately, Merlijn The Trader uses the Wyckoff model to describe ETH’s movement. The model shows that Ether may have completed its Spring, Test, and Sign of Strength phases. It is now in what’s labeled as the Last Point of Support, a position in the structure where stronger upward movement often begins. “This is where Ethereum accelerates into five digits,” he wrote, pointing to the next phase of the cycle.
Q4 Setup Resembles Previous Cycles
Ethereum has had a strong fourth-quarter performance during past bull runs. In 2017, it gained over 140% in Q4. In 2020, these returns were above 100%. This year, ETH saw a drop of -45.41% in Q1 but recovered in Q2 (+36.48%) and Q3 (+79.55%).
Crypto Rand referred to these figures and asked,
GM guys! Is $ETH getting ready to perform like in 2017 and 2020? pic.twitter.com/JaIv9ogrEZ
— Rand (@crypto_rand) September 23, 2025
The recent rebound and historical Q4 strength have led to comparisons with those cycles. While no outcome is guaranteed, traders are watching to see if a similar trend develops.
