Ripple Price Analysis: XRP Defies Gravity Despite Brutal Market Correction

XRP shrugs off market turbulence as technical indicators signal underlying strength.
The Resilience Factor
While most altcoins bled out during the recent downturn, Ripple's native token displayed remarkable fortitude. Trading volumes spiked as buyers absorbed selling pressure—classic accumulation behavior that often precedes significant moves.
Technical Bullish Divergences Emerge
Key momentum oscillators flashed bullish divergences even as price action retreated. The RSI held above critical support levels while funding rates normalized—suggesting the pullback represented healthy profit-taking rather than fundamental weakness.
Institutional Tailwinds Remain
Despite regulatory theater that would make Shakespeare cringe, XRP continues attracting enterprise adoption. Cross-border payment pilots expand while traditional finance institutions quietly integrate Ripple's technology behind the scenes.
This crypto refuses to die—much to the chagrin of Wall Street bankers still trying to figure out blockchain basics.
Ripple Analysis
By Shayan
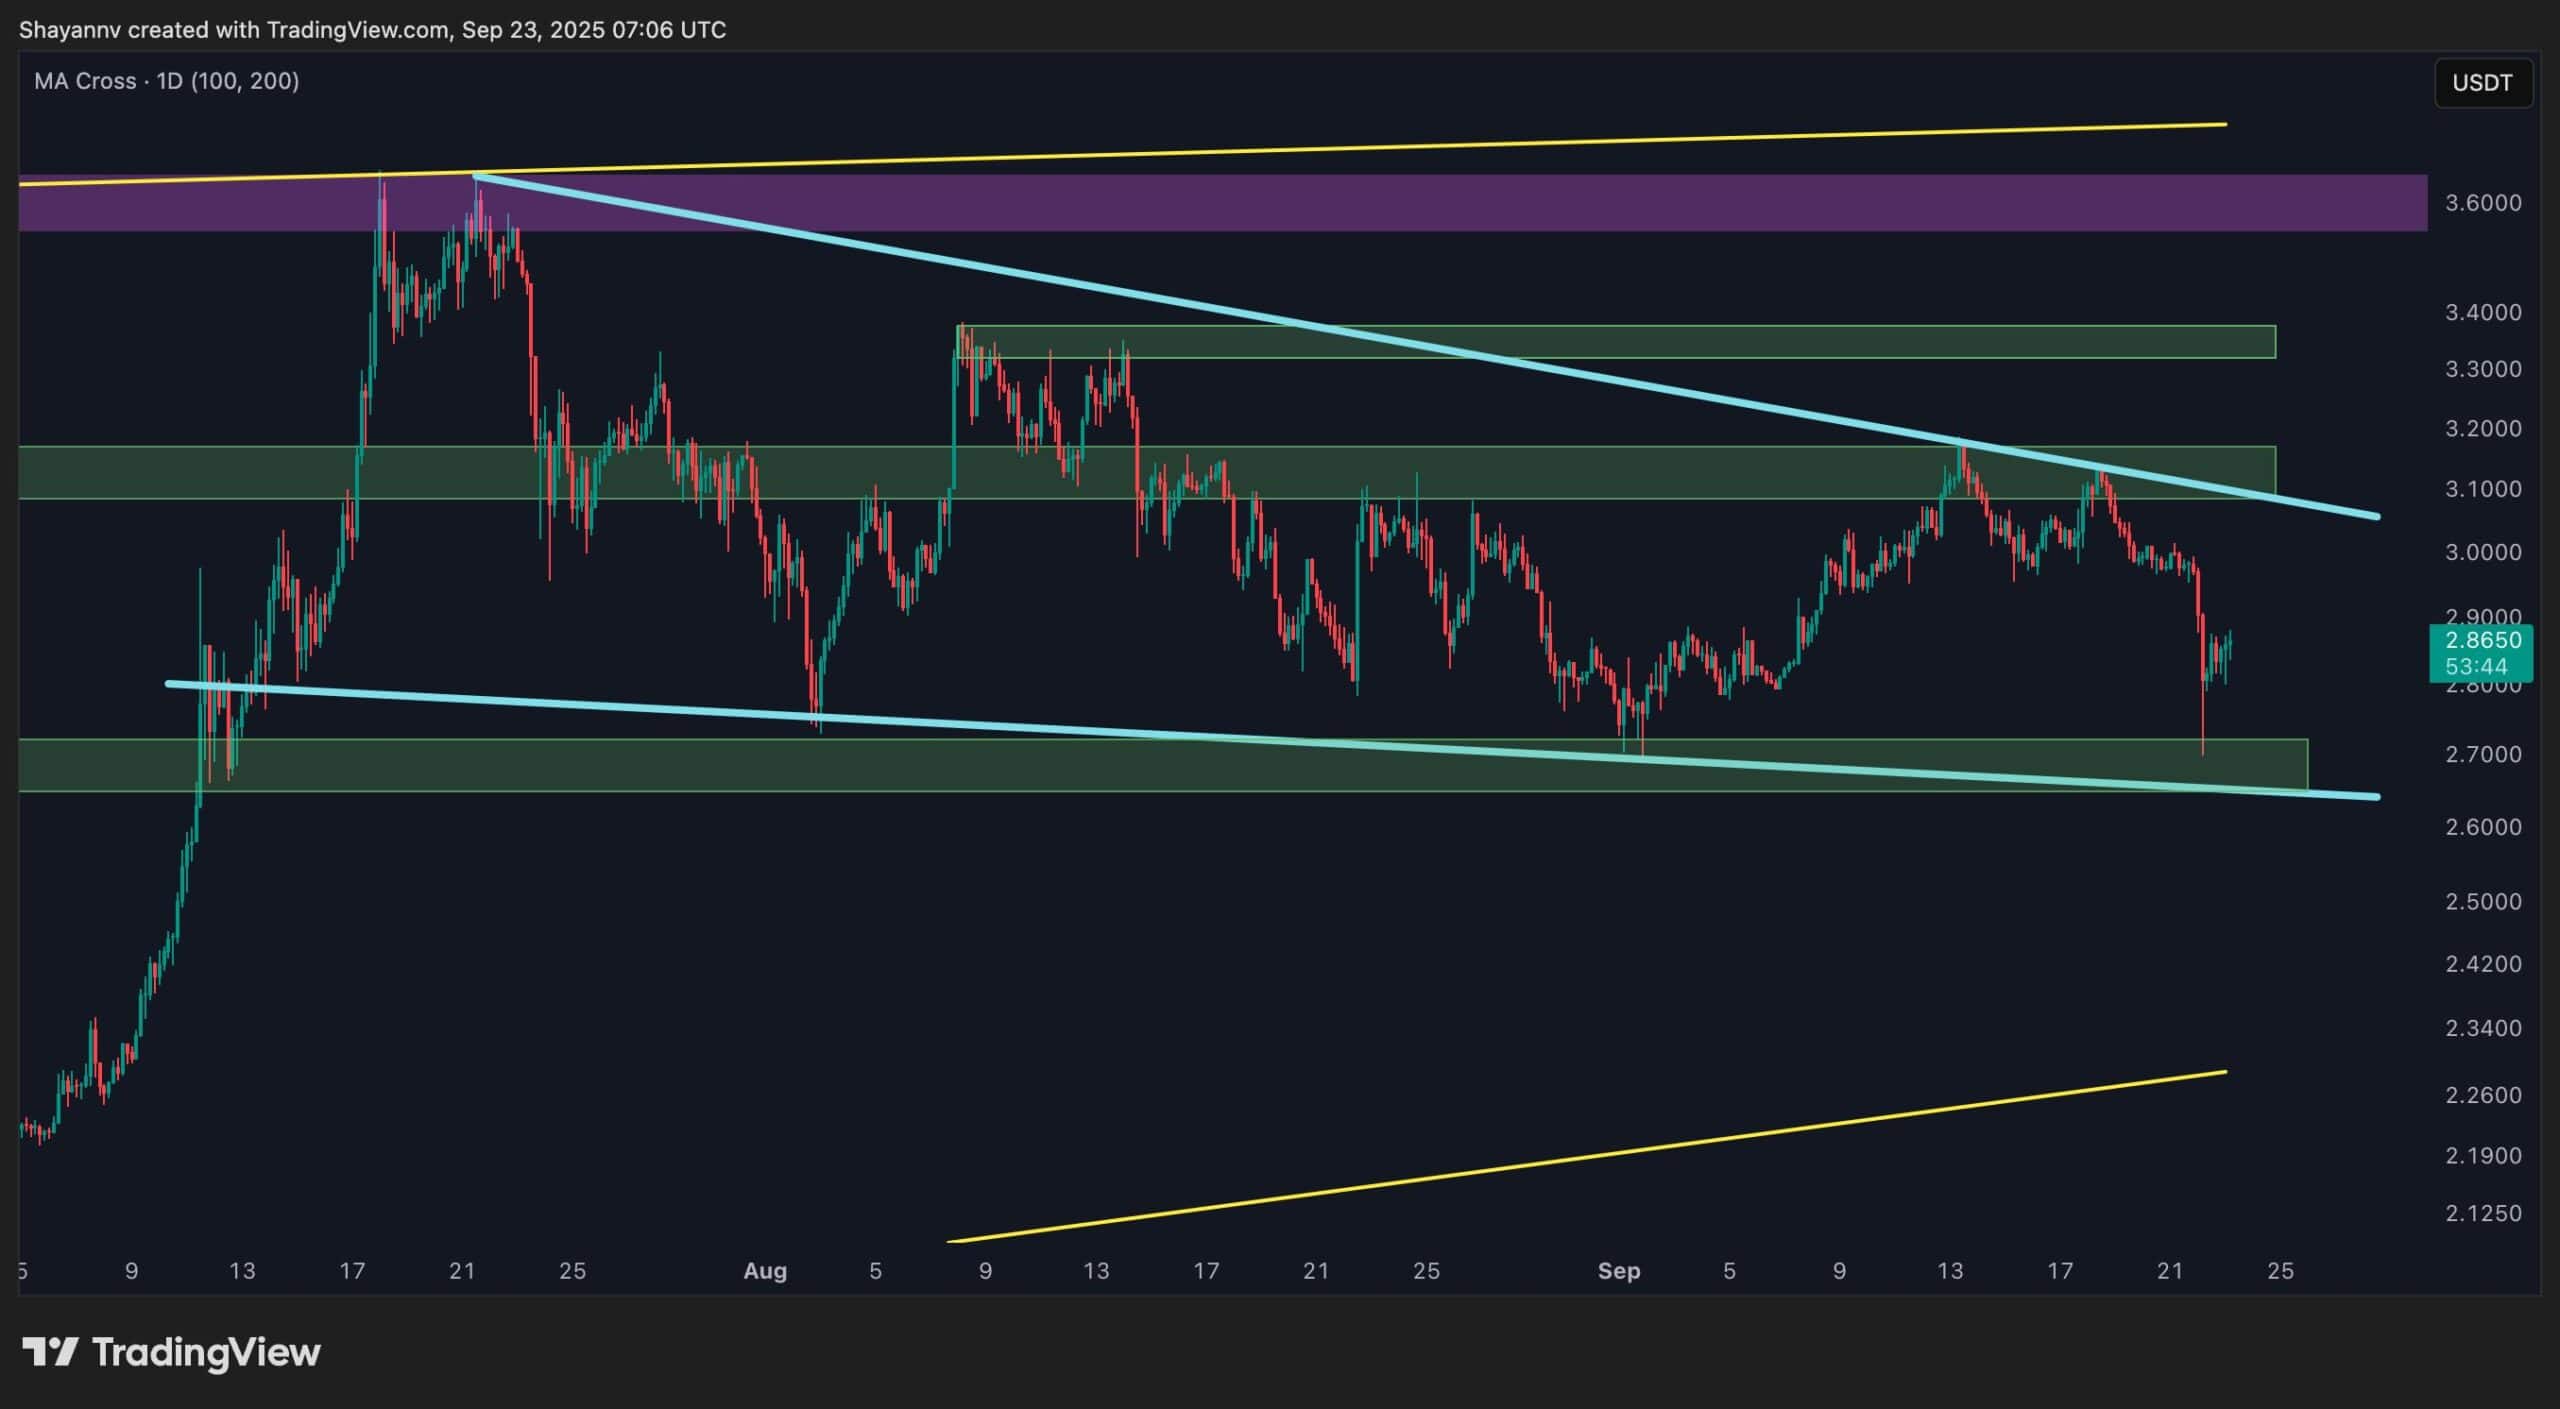
The Daily Chart
On the daily timeframe, XRP has retested its 100-day moving average following the recent sell-off. The decline from the mid-range resistance drove the asset toward the $2.85 zone, where horizontal support converges with the MA. This overlap makes the current level a critical battleground.
If buyers can defend this region, bullish sentiment may revive, with potential for a recovery toward higher resistance. However, a clean break below WOULD expose the $2.0–$2.1 support zone, a deeper demand area that could absorb selling pressure. Overall, XRP appears to be in a retracement stage within a broader upward channel.

The 4-Hour Chart
The 4-hour structure highlights a descending channel forming after the failure to sustain higher levels. The asset recently bounced from the $2.7 demand area, showing some buy-side defense. Yet, as long as the descending resistance trendline contains momentum, the short-term outlook remains corrective.
A retest of the $3.1 zone could prove decisive; a rejection here would likely extend the correction, while a breakout above would signal the start of a bullish recovery. Until then, the $2.7 green demand zone remains the key decision point for traders to monitor in the short term.