Ethereum Price Analysis: What’s Next for ETH After Sharp Rejection at $4.5K?

Ethereum hits a wall at $4,500—now what? The crypto giant's failed breakout attempt leaves traders scrambling for direction as technical indicators flash mixed signals.
Technical Breakdown: Reading the Charts
ETH's rejection at the $4.5K resistance level creates a classic standoff between bulls and bears. The price action suggests institutional players are taking profits while retail FOMO lingers just below key support levels. Trading volume patterns reveal whether this is a healthy pullback or the start of something more concerning.
Market Psychology: Fear vs Greed
Traders are watching how Ethereum handles this pressure test—will it bounce like it did at previous resistance levels, or are we looking at a longer consolidation phase? The $4,500 barrier has become crypto's latest psychological battleground, with options data showing heightened volatility expectations through the coming weeks.
Broader Context: Macro Matters
While technicals dominate short-term moves, Ethereum's fate remains tied to broader crypto adoption trends and—let's be honest—whether traditional finance dinosaurs finally figure out how blockchain works beyond PowerPoint presentations. The network's fundamental upgrades continue attracting serious development activity, even if price action feels stuck in neutral.
Bottom line: Ethereum's $4,500 rejection sets up a critical test of market conviction. Watch how institutions reposition while retail sentiment swings between euphoria and despair—because nothing says 'healthy market' like leveraged traders getting liquidated at both resistance and support levels.
Technical Analysis
By Shayan
The Daily Chart
On the daily chart, ETH failed to hold above $4,400, breaking below the small ascending channel formed recently. This breakdown has shifted momentum, with price now hovering around $4,200. The RSI is also sitting around 40, reflecting a loss of bullish strength but not yet an extreme oversold condition.
The first major support is found NEAR $4,000, followed by the $3,800 area, which lines up with the 100-day moving average and the lower boundary of the larger channel. If buyers defend this level, ETH could form a higher low structure, keeping the broader uptrend intact.
For now, ETH’s mid-term trend remains bullish as long as $3,700 holds, but the momentum shift suggests more downside probing before strength returns.

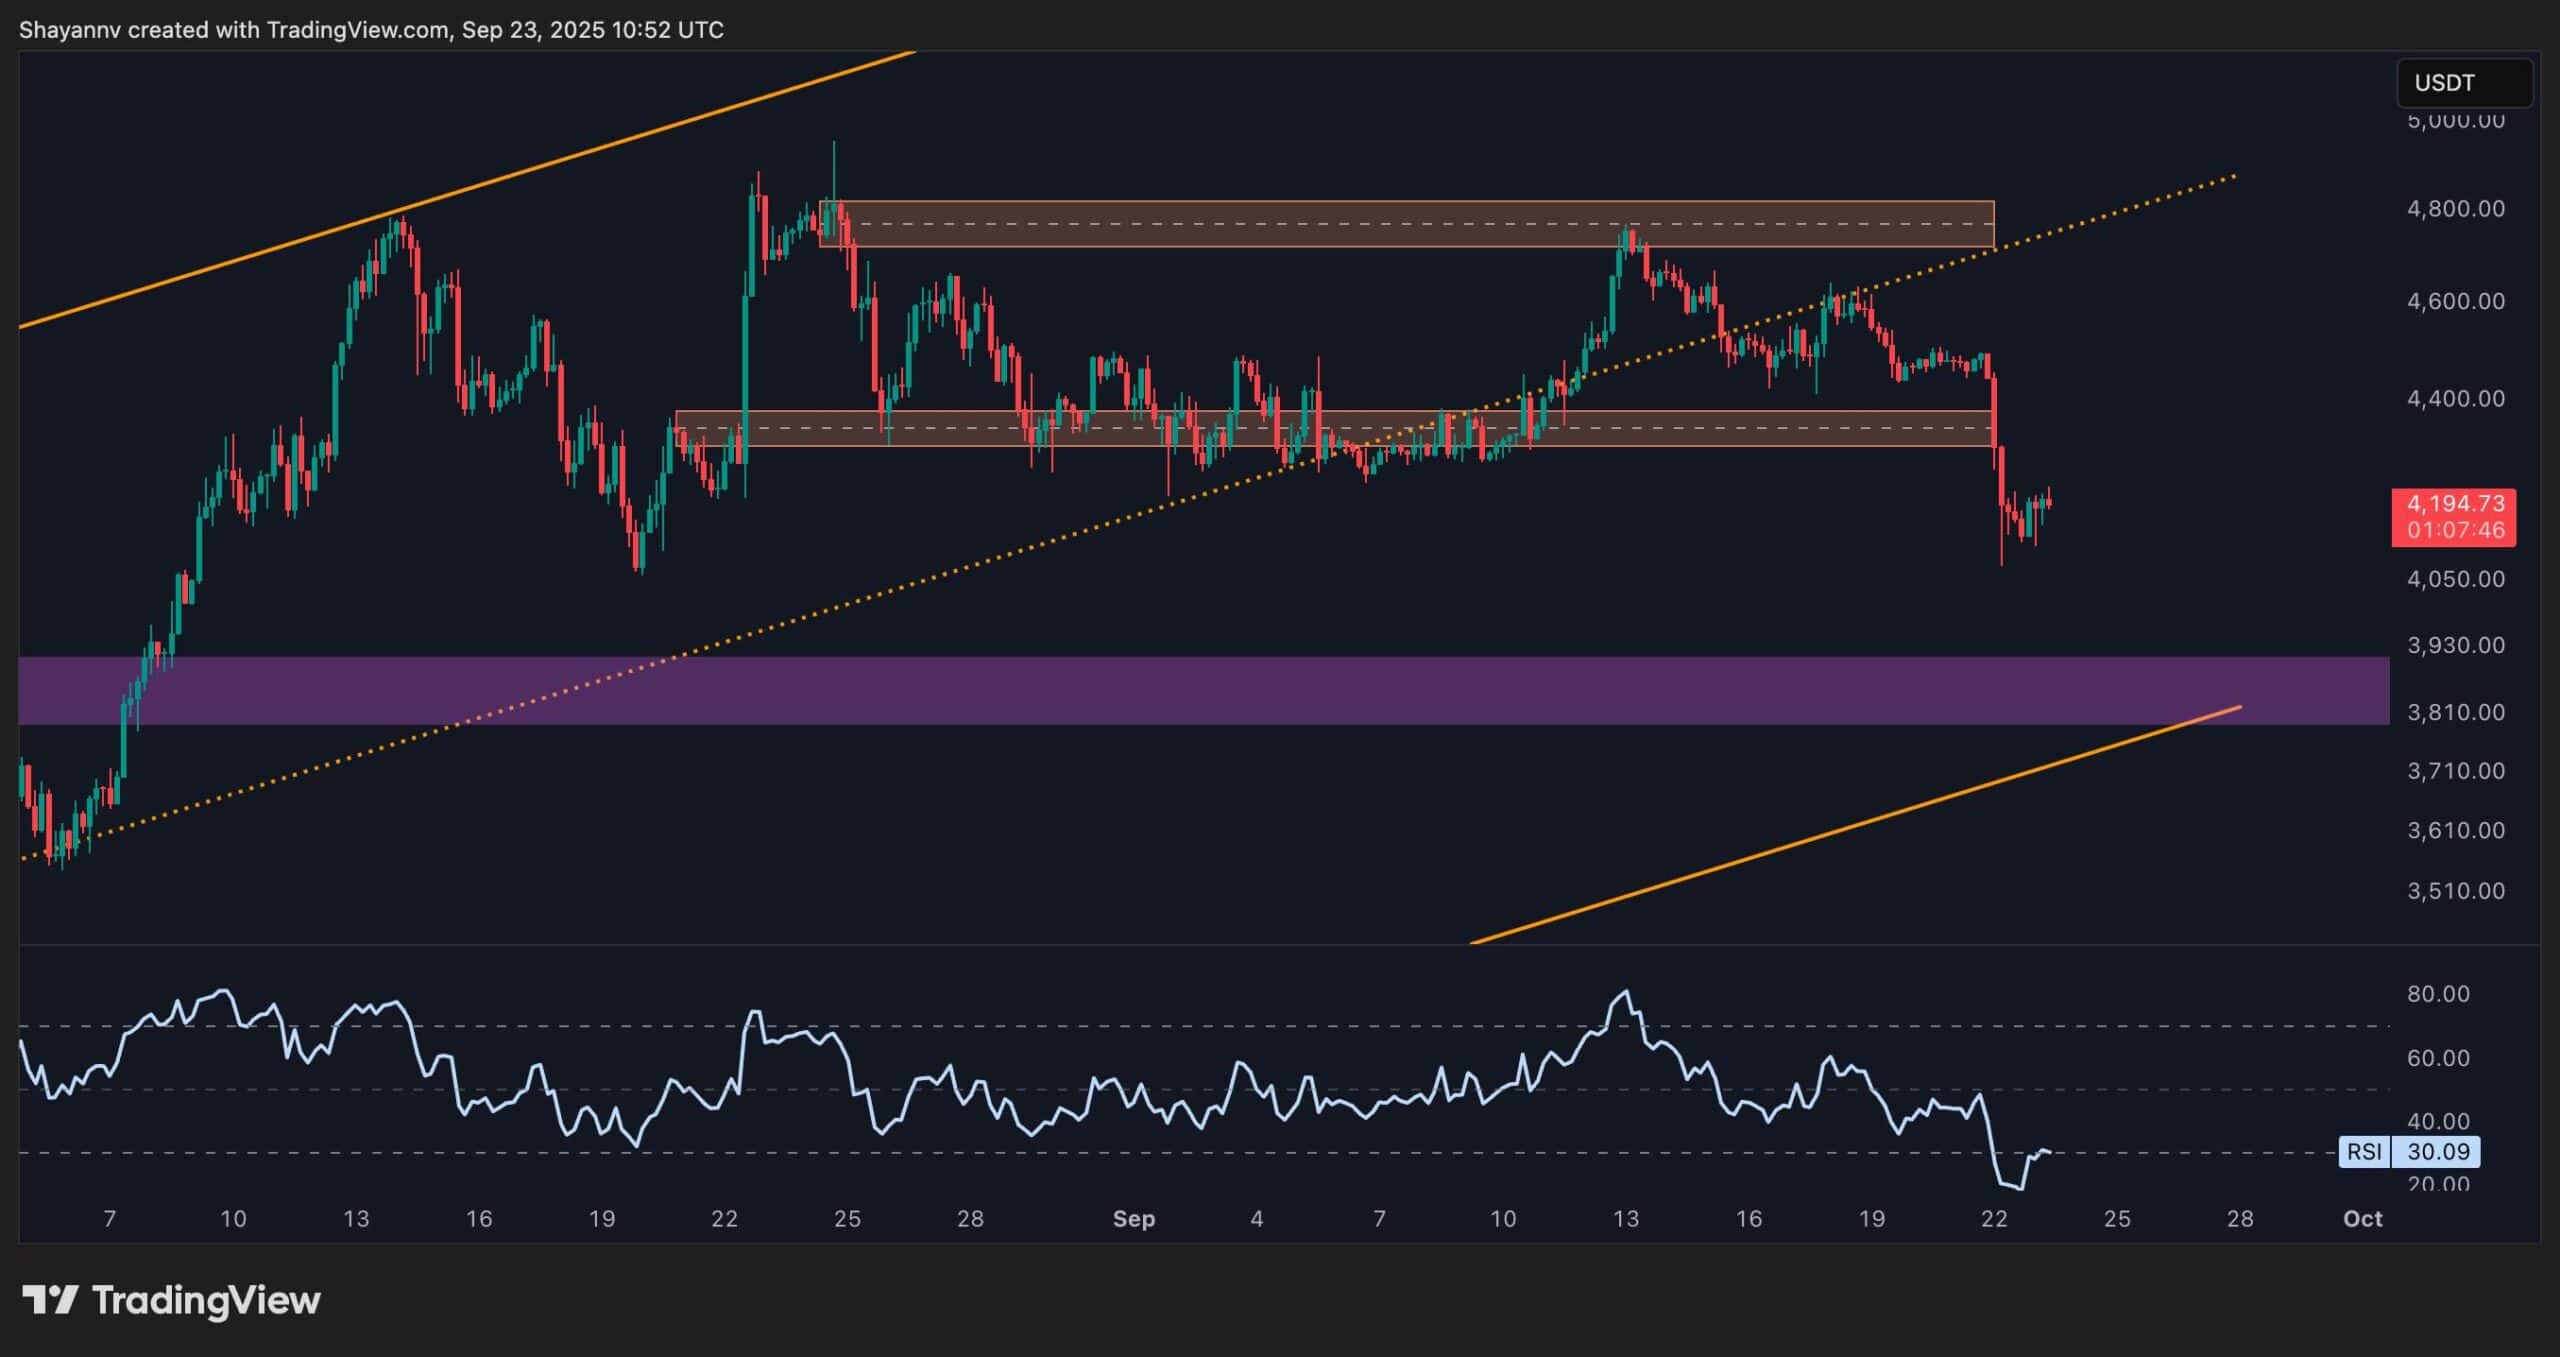
The 4-Hour Chart
The 4H chart paints a clearer picture of recent weakness. ETH broke down from its $4,400–$4,800 consolidation range and quickly dropped toward $4,100. Momentum is now heavily tilted to the downside, with RSI near 30, showing short-term oversold conditions. While this could spark a relief bounce, the breakdown has shifted the local trend bearish until $4,400 is reclaimed.
The next strong liquidity cluster sits around $3,800, which aligns with both horizontal demand and the ascending trendline. This zone is likely where buyers will attempt to step in aggressively. If ETH can hold and rebound from this area, the first upside target WOULD be $4,200, followed by a retest of the key $4,400 level. On the other hand, failing to hold above $3,800 could accelerate selling pressure, dragging the market into an overall bearish phase.
Onchain Analysis
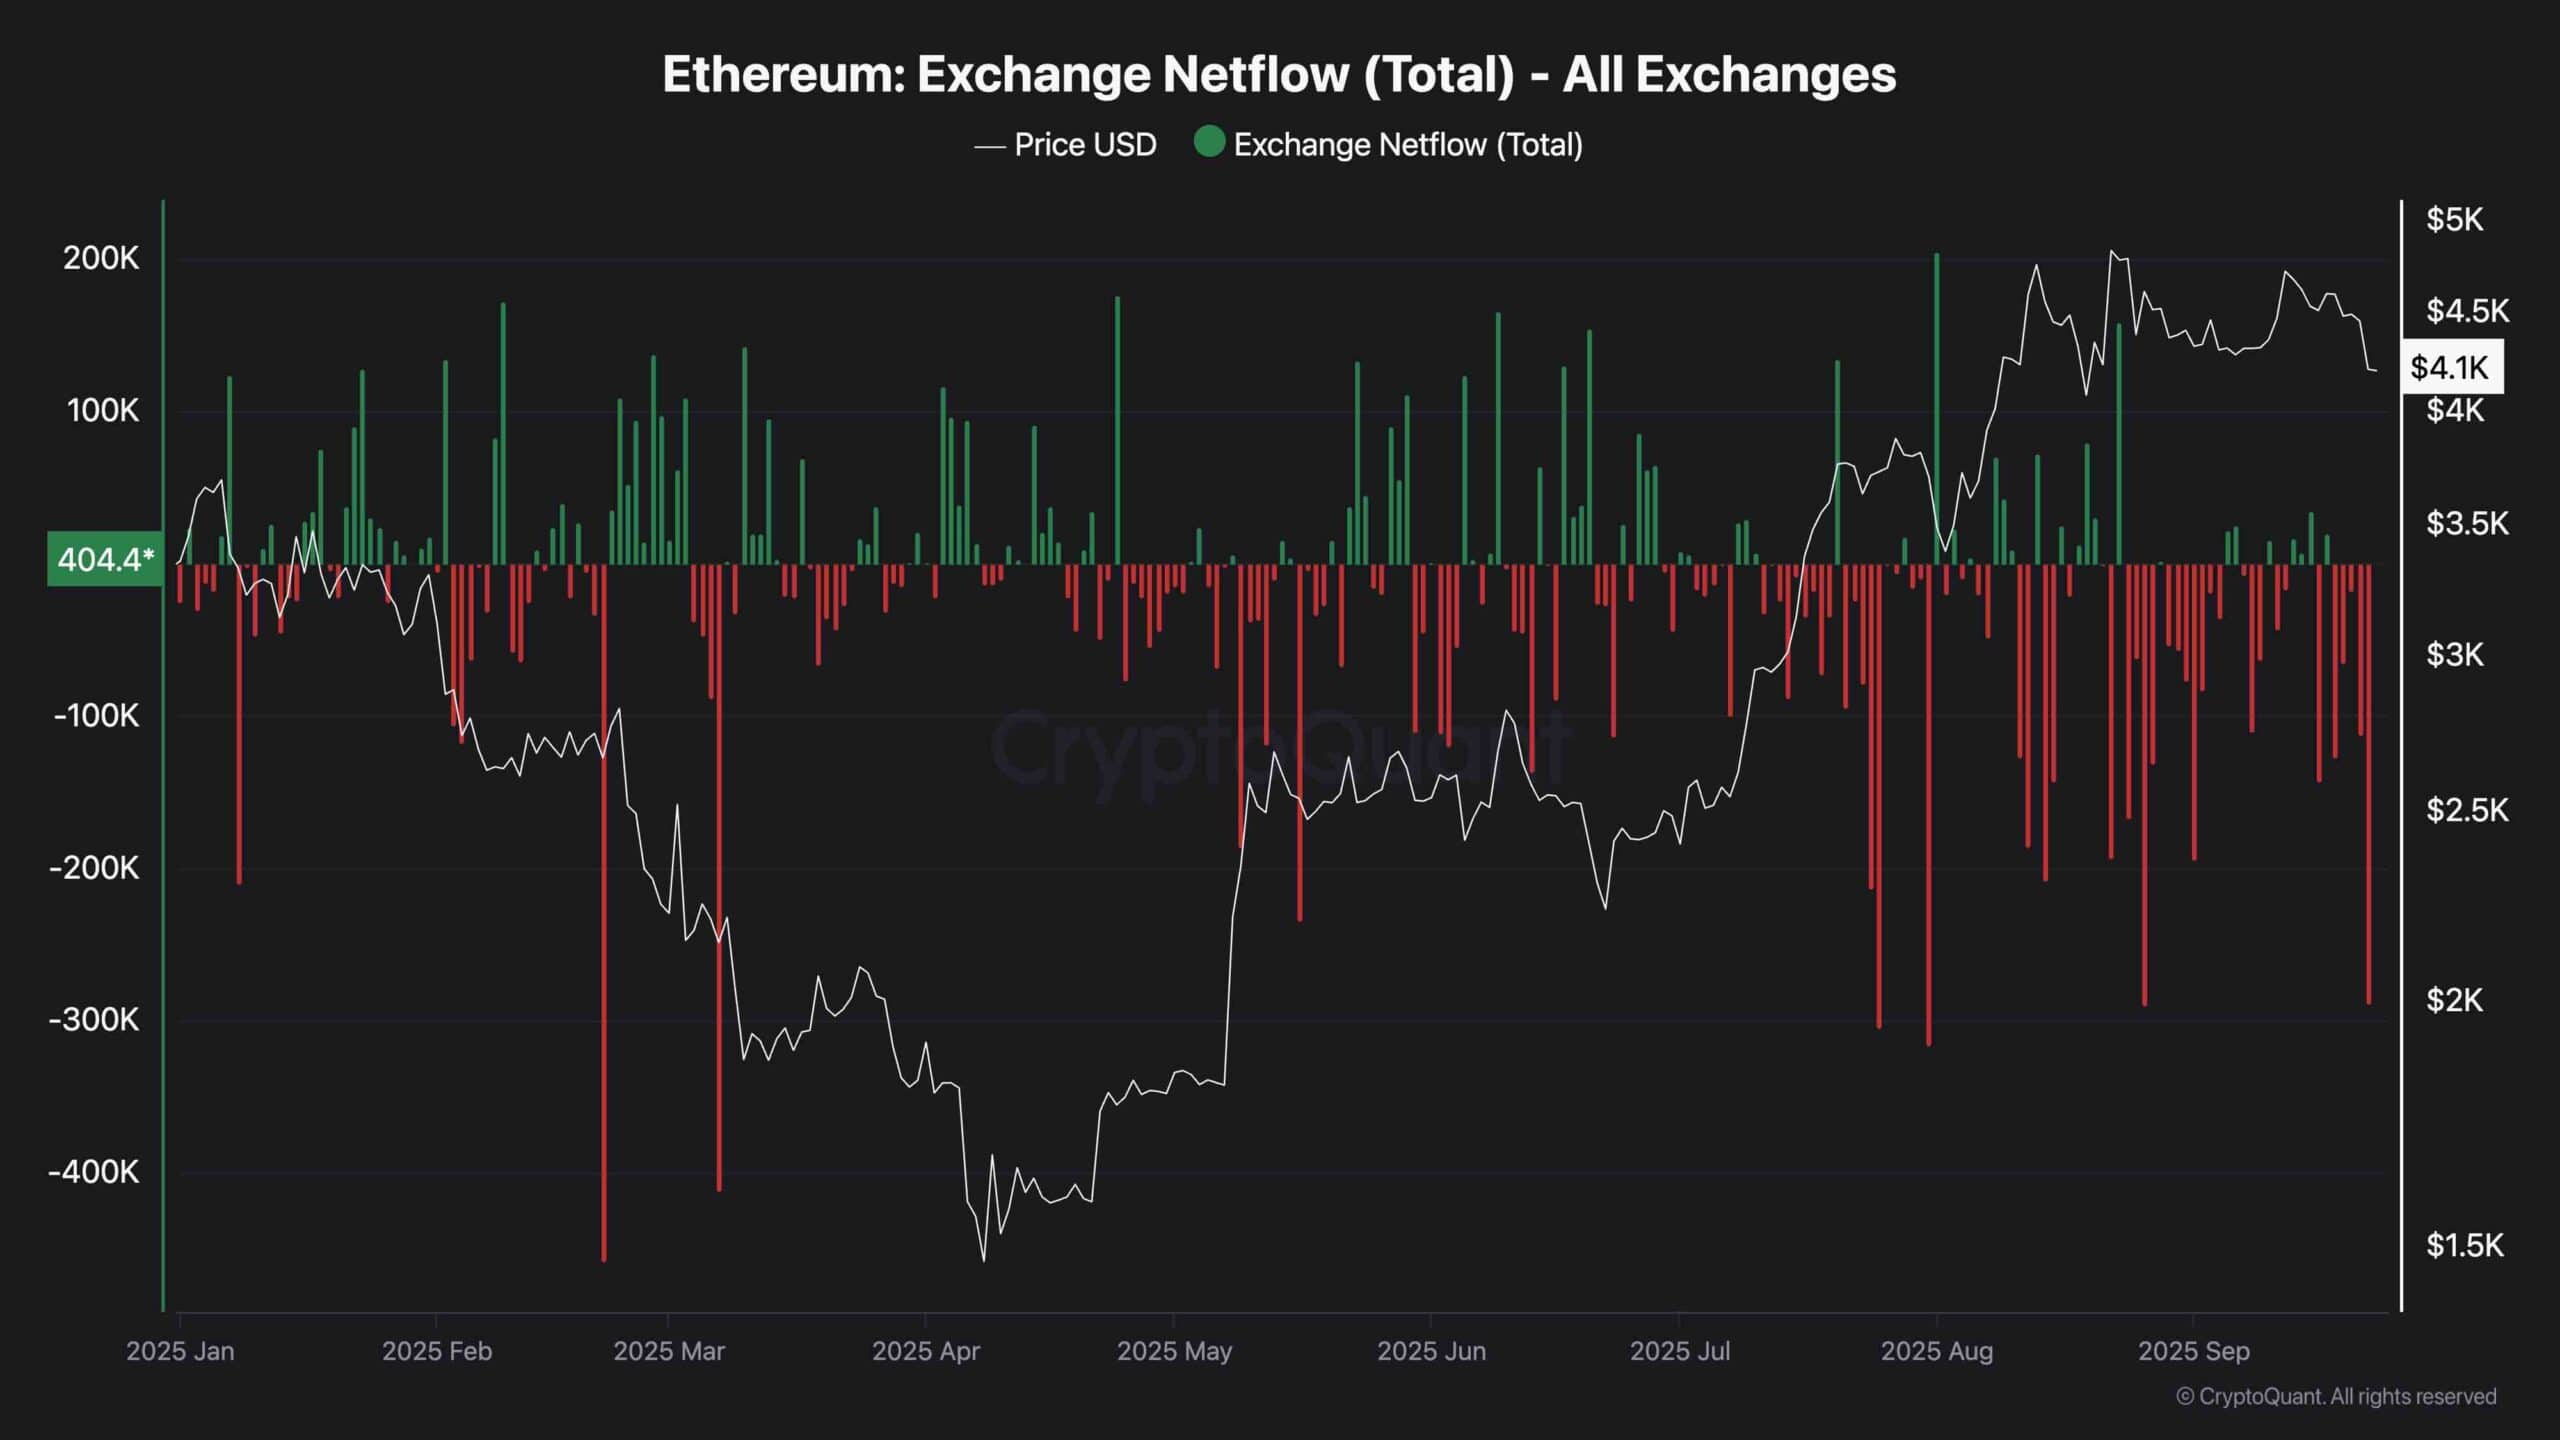
Exchange Netflows
Exchange netflows continue to show large negative spikes, indicating consistent ETH outflows from exchanges. This suggests investors are moving coins into self-custody or staking, which reduces sell-side supply and is generally bullish over the medium to long term.
However, in the short term, the market is more influenced by technical weakness and profit-taking at recent highs. If accumulation continues during this dip, it could set the stage for a strong recovery later, but for now, market sentiment leans toward testing lower support levels before a new bullish leg begins.