Aptos Price Forecast 2025-2031: Can APT Defy Gravity or Is This Another Crypto Mirage?

Aptos bulls are betting big—but will Layer 1 hype outlast the next market cycle? We break down the make-or-break factors for APT’s long-term trajectory.
Technical Outlook: The charts show a coin that’s either consolidating for liftoff or priming for a rug pull. Key resistance levels loom at $35 and $58, while $18 acts as critical support. Watch the moving averages like a hawk.
Adoption Metrics: Mainnet activity tells the real story. Developer exodus? Red flag. DApps gaining traction? Green light. The VC-backed ’Solana killer’ narrative cuts both ways.
Macro Wildcards: Fed policy swings and regulatory crackdowns could torpedo even the most bullish tech. Remember when ’institutional adoption’ was going to save us all? So much for that thesis.
Closing Reality Check: Aptos has the tech chops—but in a market where dog memes outpace fundamentals, APT’s 2031 price depends more on gambler psychology than white papers. Place your bets accordingly.
Overview
| Cryptocurrency | Aptos |
| Symbol | APT |
| Current price | $5.86 |
| Aptos crypto market cap | $3.64B |
| Trading volume | $221.75M |
| Circulating supply | 621.33M |
| All-time high | $19.90 on Jan 30, 2023 |
| All-time low | $3.09 on Dec 30, 2022 |
| 24-hour high | $6.14 |
| 24–hour low | $5.80 |
Aptos price prediction: Technical analysis
| Metric | Value |
| Volatility (30-day variation) | 6.90% |
| 50-day SMA | $5.24 |
| 200-day SMA | $7.45 |
| Current APT crypto sentiment | Bullish |
| Green days | 16/30 (53%) |
Aptos price analysis
At press time, May 12, Aptos traded at $5.92, a 0.83% rise in 24 hours, with its trading volume dropping by 22.72%. The price chart shows that Aptos could be heading for a retest after a daily breakout.
Aptos 1-day chart price analysis
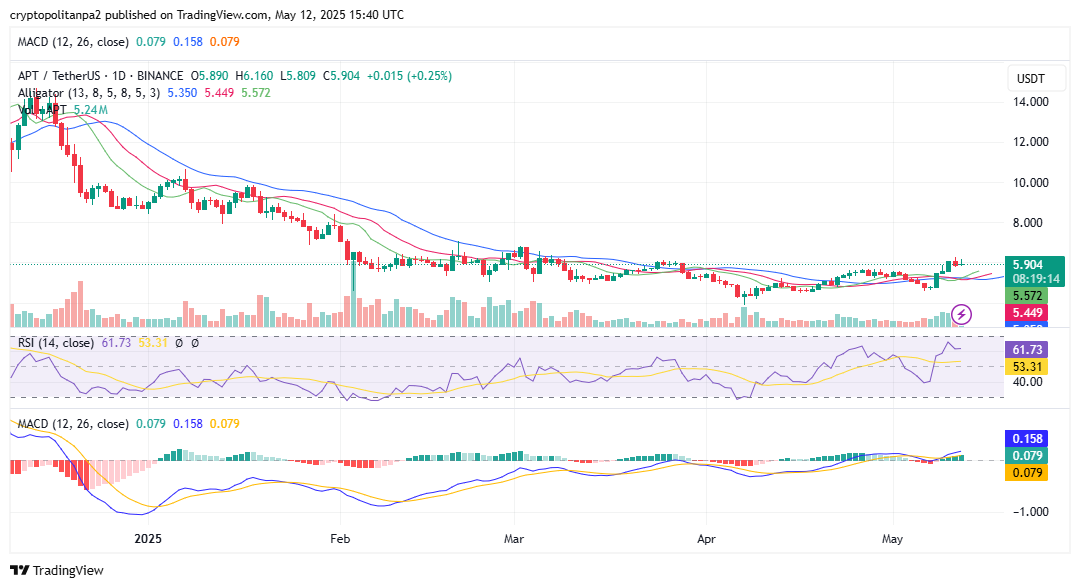
At current levels, Aptos is trading sideways. The William Alligator trendlines signal risin volatility, and the relative strength index is in neutral territory. The MACD histograms indicate rising positive market momentum.
Aptos 4-hour chart price analysis
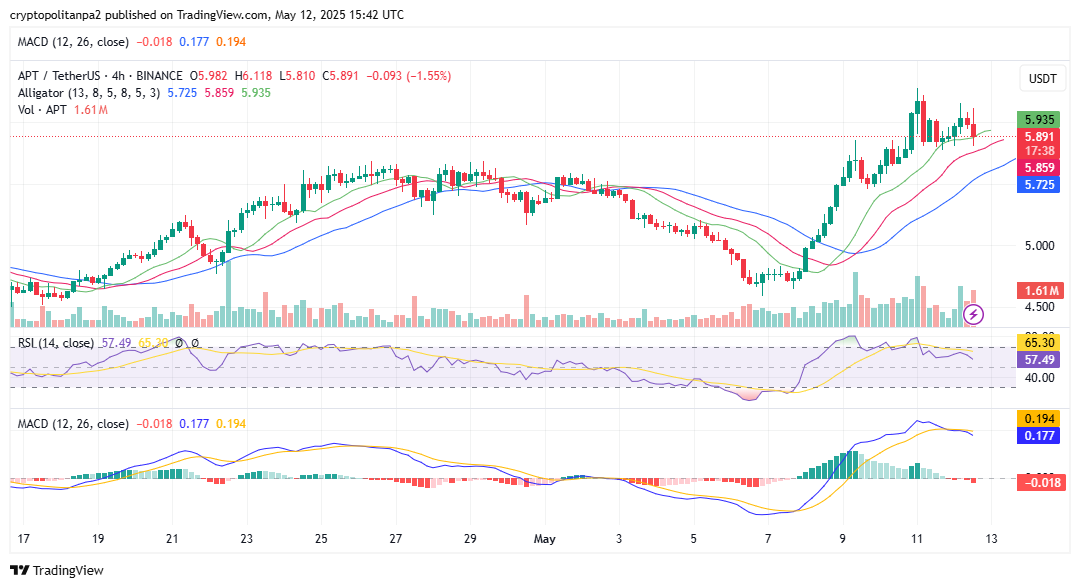
The 4-hour chart, like the daily chart, shows rising volatility with negative price momentum on the MACD histograms. The MOVE came as APT registered consecutive bullish engulfing candles, sending it to a high of $6.28.
Watch the $5.66 level on the chart at the channel’s lower trendline if the drop continues. The cryptocurrency could find support near a narrow range of consolidation.
Investors should monitor the $6.30 level upon a price reversal. A rally into this area WOULD likely face resistance from an earlier low at the flattening 100-day SMA
Aptos technical indicators: Levels and action
Daily simple moving average (SMA)
| Period | Value ($) | Action |
| SMA 3 | 5.43 | BUY |
| SMA 5 | 5.57 | BUY |
| SMA 10 | 5.39 | BUY |
| SMA 21 | 5.44 | BUY |
| SMA 50 | 5.24 | BUY |
| SMA 100 | 5.62 | BUY |
| SMA 200 | 7.45 | SELL |
Daily exponential moving average (EMA)
| Period | Value ($) | Action |
| EMA 3 | 5.21 | BUY |
| EMA 5 | 5.09 | BUY |
| EMA 10 | 5.06 | BUY |
| EMA 21 | 5.20 | BUY |
| EMA 50 | 5.67 | BUY |
| EMA 100 | 6.59 | SELL |
| EMA 200 | 7.55 | SELL |
What to expect from APT price analysis next?
According to the technical indicators, APT has recorded 16 bullish days in the last thirty, meaning its general sentiment is bullish. The charts show that APT has hit the month’s high and is now correcting.
Why is Aptos down?
Aptos was bullish in the last quarter of 2024. The wider crypto market corrected into 2025.
Will Aptos reach $10?
Yes, Aptos ROSE above $10 this year. The move will come as the market recovers to previous highs.
Will Aptos reach $100?
Per the Cryptopolitan price prediction, Aptos will reach the $100 mark in 2031.
Will Aptos reach $1000?
Per the Cryptopolitan price prediction, it remains unlikely that Aptos will get to $1000 before 2031.
What is the long-term price prediction for Aptos?
According to Cryptopolitan price predictions, Aptos will trade higher in years to come. However, factors like market crashes or difficult regulations could invalidate this bullish theory.
How high can Aptos coin go?
Per the Cryptopolitan price prediction, Aptos will reach a high of $24.84 in 2031.
Is Aptos worth investing in?
APTOS’s design prioritizes scalability, reliability, and upgradeability. It is notable for using the MOVE programming language, developed by Facebook and now META. While the current trend is bearish, predictions paint a different narrative.
Recent news
An Aptos community member submitted a proposal to slash APT staking rewards by nearly 50%. The proposal aims to improve capital efficiency, align with LAYER 1 benchmarks, and redirect incentives toward ecosystem growth (DeFi, MEV, restaking). While the proposal offers compelling opportunities, it also carries risks, such as centralization as smaller delegators opt out, requiring community collaboration to mitigate.
Aptos price prediction May 2025
The Aptos price forecast for May is a maximum price of $6.18 and a minimum price of $4.65. The average price for the month will be $5.08.
| Month | Potential low ($) | Potential average ($) | Potential high ($) |
| May | 4.65 | 5.08 | 6.18 |
Aptos price prediction 2025
For 2025, APT’s price will range between $3.50 and $15.54. The average price for the period will be $9.72.
| Year | Potential low ($) | Potential average ($) | Potential high ($) |
| 2025 | 3.50 | 9.72 | 15.54 |
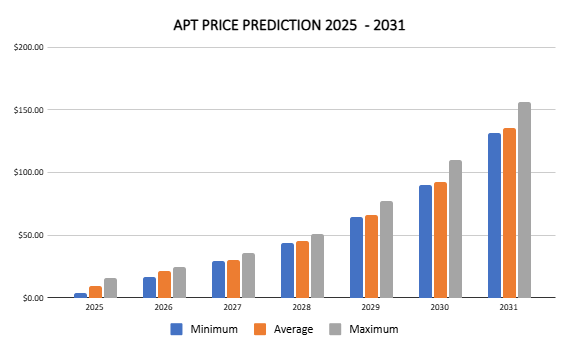
APT price prediction 2026-2031
| Year | Potential low ($) | Potential average ($) | Potential high ($) |
| 2026 | 16.59000 | 21.18000 | 24.84000 |
| 2027 | 29.33000 | 30.18000 | 35.91000 |
| 2028 | 44.08000 | 45.59000 | 50.67000 |
| 2029 | 64.42000 | 66.24000 | 77.14000 |
| 2030 | 89.95000 | 92.60000 | 109.65000 |
| 2031 | 131.21000 | 135.84000 | 155.97000 |
Aptos price prediction 2026
The Aptos price prediction estimates it will range between $16.59 and $24.84, with an average price of $21.18.
Aptos price prediction 2027
Aptos coin price prediction climbs even higher into 2027. According to the predictions, APT’s price will range between $29.33 and $35.91, with an average price of $30.18.
Aptos price prediction 2028
Our analysis indicates a further acceleration in APT’s price. It will trade between $44.08 and $50.67, with an average price of $45.59.
Aptos price prediction 2029
According to the Aptos Price prediction for 2029, the price of APT will range between $64.42 and $77.14, with an average price of $66.24.
APT price prediction 2030
According to the Aptos price prediction for 2030, Aptos will range between $89.95 and $109.65, with an average price of $92.60.
Aptos price prediction 2031
The Aptos price prediction for 2031 is a high of $155.97. It will reach a minimum price of $131.21 and an average price of $135.84.
APT market price prediction: Analysts APT price forecast
| Platform | 2025 | 2026 | 2027 |
| Digitalcoinprice | $12.97 | $15.23 | $21.18 |
| Coincodex | $16.72 | $11.95 | $6.51 |
| Gate.io | $6.11 | $7.49 | $9.21 |
Cryptopolitan’s APT price prediction
Our predictions show that APT will achieve a high of $15.54 before the end of 2025. In 2027, it will range between $29.33 and $35.91, with an average of $30.18. In 2030, it will range between $89.95 and $109.65, with an average price of $92.60. Note that the predictions are not investment advice. Seek independent professional consultation or do your research.
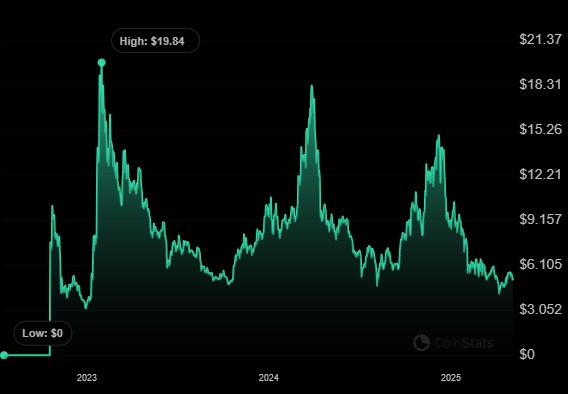
Aptos historic price sentiment
- Aptos raised seed funding in January 2022, led by a16z. Series A funding included Apollo, Dragonfly, Franklin Templeton, and others.
- Some members previously worked on the Diem blockchain proposed by Facebook.
- The Aptos mainnet launched in October 2022 with an initial supply of 1 billion tokens.
- After the launch hype, Apt fell to its lowest in December 2022, at $3.09. A month later, the tables turned, as it peaked at a time high of $19.90 on January 30, 2023.
- It pumped, partly driven by the NFT market. Collections such as Aptos Monkeys and Aptomingod have attracted more users.
- On June 6, it fell below its initial listing price and extended the losses in the preceding months.
- In October, it started correcting, rising as high as $8.47 in November.
- In 2024, it broke above $10, reaching $18 in March. From April, it reversed, falling below $10. By September, it had fallen as low as $6. It recovered in October, rising above $7.50. It crossed into November, trading at the $8.9 mark, and rose to as high as $13.91. It corrected and traded at $13.24 into December.
- It later corrected and crossed into 2025, trading at the $8.71 mark. The drop continued into February and in May it fell below $5.10.

Log in to Reply
Log in to comment your thoughtsComments
Related Articles
|Square
Get the BTCC app to start your crypto journey
Get started today Scan to join our 100M+ users